

Quantifying the flammability of living plants at the branch scale: which metrics to use?
J. G. Cawson A * , J. E. Burton A , B. J. Pickering A , V. Demetriou B and A. I. Filkov A
A
B
International Journal of Wildland Fire 32(10) 1404-1421 https://doi.org/10.1071/WF23007
Submitted: 18 January 2023 Accepted: 23 August 2023 Published: 15 September 2023
Abstract
Plant flammability is an important factor in fire behaviour and post-fire ecological responses. There is consensus about the broad attributes (or axes) of flammability but little consistency in their measurement.
We sought to provide a pathway towards greater consistency in flammability research by identifying a subset of preferred flammability metrics for living plants.
Flammability was measured at the branch scale using a range of metrics for 140 plant specimens in an apparatus that simulates an approaching fire front.
We identified a subset of preferred metrics, which quantify the axes of flammability for living plants, including time to ignition (ignitability), peak heat release rate (combustibility), flaming duration (sustainability) and consumption (consumability). Flaming duration was strongly correlated with heat release rate, so could be a proxy for combustibility. Flammability was higher for species with greater surface area and biomass per branch.
We identified a subset of preferred metrics for quantifying the flammability of living plants. These metrics quantify the key axes of flammability and are measurable using different experimental apparatus and across multiple scales, making them suitable for widespread use.
The inclusion of these flammability metrics in future studies has the potential to enhance consistency and comparability between studies.
Keywords: branch scale, consumability, combustion, fire behaviour, fire intensity, flammability, fuel, ignition, quantifying flammability.
Introduction
Flammability is an important but ambiguous concept in the field of wildfire science. Broadly, it describes how vegetation burns, from individual leaves to whole vegetation communities (Gill and Zylstra 2005; Varner et al. 2015). Vegetation acts as fuel in a wildfire; therefore, how it burns is a key determinant of fire behaviour (Murphy et al. 2013). A change in species composition or structure can escalate or diminish a fire, depending on the traits of the species (Cardoso et al. 2018; Newberry et al. 2020; Viedma et al. 2020). This has consequences for the fire regime and ecological response of species to fire (Pausas et al. 2017). Therefore, it is important to understand how flammability varies among plant species. For such knowledge to develop, consistency is needed in the way flammability is measured.
There is general agreement in describing flammability using four broad attributes (or axes): (1) ignitability; (2) combustibility; (3) sustainability; and (4) consumability (Anderson 1970; Martin et al. 1993; White and Zipperer 2010; Varner et al. 2015; Pausas et al. 2017; Murray et al. 2020). Each axis has implications for fire behaviour and prompts certain ecological responses. These fire behaviour implications and ecological responses should be at the forefront when deciding the most relevant flammability axes for a specific purpose.
Ignitability measures the time required for vegetation to begin an exothermic reaction after exposure to a heat source, signified by the initiation of smouldering/glowing (smouldering hereafter) or flaming combustion (Anderson 1970). It is an important factor in fire behaviour because it determines the probability that a fire will occur and influences the rate of spread of a fire. Flames spread faster when adjacent fuel particles ignite rapidly, provided the heat output is sufficient to ignite the surrounding fuel (Gill and Zylstra 2005). Plants that are more difficult to ignite are less likely to burn, allowing them to persist in fire-prone landscapes (Pausas et al. 2017).
Combustibility is the rate of heat release as a fuel particle burns (Martin et al. 1993). The combustibility of individual fuel particles influences the intensity of a fire, that is, the rate of heat release per unit area (Gill and Zylstra 2005; Keeley 2009). Fires with a high heat release rate – exhibiting rapid consumption of large quantities of vegetation – pose the greatest danger to people and are more difficult to suppress (Alexander 2000; Harris et al. 2012). Heat release rate, together with ignitability, also influence the flame spread rate (Martin et al. 1993). Combustibility (aka fire intensity) influences the level of damage to individual plants and modes of regeneration post-fire. Individual plants may survive a low-intensity fire, but in a higher-intensity fire some plants or above-ground plant parts will die, and the way they regenerate may reflect the fire intensity (Christensen et al. 1981; Pausas and Keeley 2014; McArthur and Cheney 2015).
Sustainability describes how long a fuel particle burns via flaming or smouldering combustion. The terms ‘residence time’ and ‘burn-out time’ are field scale measures of sustainability (Cheney 1981; Gill and Zylstra 2005). In the laboratory, sustainability can be measured by observing the duration of flaming and smouldering, or duration of heat release (White and Zipperer 2010). Fuel particles that burn for longer will have a greater likelihood of preheating adjacent fuel to ignition temperature and are therefore more likely to pass fire onto adjacent fuel particles (Martin et al. 1993). Longer smouldering combustion can produce more smoke, with potential health impacts (Ottmar 2001). Ecologically, longer residence times provide more opportunity for heat transfer into the bark, seed pods and soil (Lawes et al. 2011; Alexander and Cruz 2012). Heat is sometimes needed to trigger regeneration from the soil seed bank, but too much heating can cause biological disruptions (Neary et al. 1999; Hanley and Lamont 2000).
Consumability denotes the proportion of fuel combusted (Pausas et al. 2017). Other terms used to describe the same concept include ‘burning efficiency’ and ‘combustion completeness’ (Balde et al. 2023). Consumability can be measured directly by weighing plant specimens pre- and post- burning, or it may be inferred from visual or remotely sensed measures of fuel consumption such as fire severity (Keeley 2009). From a fire behaviour perspective, consumability may be an indicator of total heat release because the amount of fuel consumed is an input into fire intensity calculations (Byram 1959). Ecologically, species with higher rates of fuel consumption tend to favour regeneration from fire-resistant seed (Pausas et al. 2017). At landscape scales, consumption or burning efficiency is an important determinant of carbon emissions during a wildfire (Knorr et al. 2012).
Despite broad agreement about the importance of the four flammability axes, there is little consistency in how they are measured (Varner et al. 2015). This inconsistency is caused by different experimental apparatus and scales of measurement. For example, heat release rate is a fundamental measure of combustibility (Babrauskas and Peacock 1992) but not measurable with all apparatus and across all scales. Instead, combustibility is estimated using mass loss rate at the leaf scale (Krix and Murray 2018), maximum flame temperature at the branch scale (Jaureguiberry et al. 2011) and char height at the community scale (Tumino et al. 2019). Rarely are comparisons made between different metrics for the same flammability axis (but see Krix et al. 2019 for an exception), so it is unclear if they are analogous. Even when the same metrics are used, the experimental apparatus can influence the magnitude of data values because each apparatus provides a different burning environment. Ignitability will vary depending on the heat output of the ignition source (Martin et al. 1993), and combustibility will be higher if the plant is exposed to an external heat source for the full duration of the test (Krix et al. 2022). Furthermore, the relative flammability of a plant species can vary depending on the scale of measurement (e.g. leaf vs branch scale) due to changes in the importance of different vegetative traits that determine flammability (Schwilk 2015; Alam et al. 2020).
Navigating a path towards more comparable flammability research is a challenge in view of these inconsistencies in metrics, experimental apparatus and scales of measurement. Ultimately, the choice of methodology should be guided by the study’s purpose. However, a greater understanding of the relationships between flammability metrics could help inform the selection of suitable metrics for a particular purpose and guide the interpretation of results. Furthermore, some of the ambiguity inherent within flammability studies could be overcome by identifying a subset of preferred metrics that are always included irrespective of experimental apparatus, scale or research goals. The subset of metrics would need to encapsulate the broad axes of flammability and be measurable using a range of experimental apparatuses and across different scales. This would create consistency across studies and make datasets more comparable and conducive to meta-analyses.
Our aim was to provide a pathway towards greater consistency in future flammability research by quantifying relationships among eight flammability metrics using live plant specimens at the branch scale. Specifically, we asked:
Methods
We quantified the flammability of 14 plant species (10 live plant specimens per species = 140 individual plants) at the branch scale using a custom-designed variable heat flux apparatus (VHFlux), which simulates an approaching fire front (Miller et al. 2023). Our focus was on the flammability of live foliage, rather than litter beds. We measured eight flammability metrics and explored relationships among them. Then, we examined relationships between nine vegetation traits and the flammability metrics.
Species selection
We focused on understorey plant species because the flammability of this strata is considered most important from a fuel hazard perspective in Australian ecosystems (Hines et al. 2010; Gould et al. 2011). Plant samples were collected from the Wombat State Forest, 100 km north-west of Melbourne, Victoria, Australia (37°26′54.5″S, 144°12′15.3″E). Climate in this region is temperate, with mean annual rainfall of 800–900 mm and mean monthly temperatures ranging from 7 (July) to 24°C (January/February) (Bennett et al. 2013). We used a subset of the sites from an earlier study (Burton et al. 2023). Sites were within two forest types – Shrubby Foothill Forest (three sites) and Heathy Dy Forest (three sites) (Department of Environment Land Water and Planning 2016). Both vegetation types are common within the region, with Shrubby Foothill Forest occurring on moderately fertile soils and Heathy Dry Forest occurring on shallow, low fertility soils. Sites were dispersed across an aridity gradient (Nyman et al. 2014) encompassing contrasting topographic positions to capture differences in understorey species composition within each forest type. At each site, we estimated the cover abundance of all understorey species. From this, we chose understorey species whose cover exceeded 15%, assuming the most abundant species would have a dominant influence on the flammability of a site. In total, there were 14 species, covering a variety of growth forms (tall shrub to ground creeper) (Table 1).
| Growth form | Species name | Common name | |
|---|---|---|---|
| Tall shrub | Acacia acinacea | Gold dust wattle | |
| Acacia dealbata | Silver wattle | ||
| Acacia mucronata | Narrow-leaved wattle | ||
| Acacia verticillata | Prickly moses | ||
| Daviesia leptophylla | Narrow-leaf bitter pea | ||
| Goodenia ovata | Hop goodenia | ||
| Olearia argophylla | Musk daisy bush | ||
| Small shrub | Acrotriche serrulata | Honey Pots | |
| Monotoca scoparia | Prickly broom-heath | ||
| Tree fern | Dicksonia antarctica | Soft tree fern | |
| Ground fern | Blechnum nudum | Fishbone water fern | |
| Polystichum proliferum | Mother shield fern | ||
| Pteridium esculentum | Bracken | ||
| Ground creeper | Platylobium obtusangulum | Common flat pea |
Field sampling
We collected branch samples from 10 individual plants per species in the field (as per Pérez-Harguindeguy et al. 2013). Sampling occurred in January and February 2021, during the summer fire season. Two branches per plant were collected – one for the plant trait measurements and one for the flammability tests with the VHFlux. If plants did not have multiple branches, then each branch was collected from a different individual plant (a total of 30 individual plants). For a subset of three plants per species, an additional branch was collected to determine heat of combustion in the oxygen bomb calorimeter.
We aimed for all branch samples to be 40 cm long for the flammability testing and trait measurements – measured from the terminating leaf or leaf-like structure back towards the main stem. However, if the total plant length was smaller than 40 cm, then the maximum possible stem length was sampled. Each branch was stored in a cool box and transported to the laboratory within 2 h of collection. The cut stem of each branch was then placed in water for a minimum of 6 h for rehydration prior to measurement (as per Pérez-Harguindeguy et al. 2013). The 40 cm branch length is the maximum that can be accommodated in the VHFlux due to the size of the radiant heat panel. Branches were smaller than those used in some other flammability apparatus (e.g. 70 cm in the plant barbeque (Jaureguiberry et al. 2011)) but still sufficiently large to capture the effect of branch architecture on flammability.
Measurement of flammability
The flammability measurements occurred within 48 h of branch sample collection, after they had been fully hydrated. Flammability was measured under a dynamic heating regime and with a flaming piloted igniter using the Variable Heat Flux (VHFlux) apparatus (Miller et al. 2023) (Fig. 1). The VHFlux consists of a radiative panel, linear stage, gas pilot ignitor, PC control system, exhaust system and shutter. The radiative panel contains 12 infrared short-wave lamps producing radiative heat flux. The radiative panel is installed on a linear stage, which allows the panel to move forward and backwards, simulating variable heat flux and emulating conditions that might be expected from an approaching fire front. A pilot ignitor, made of a copper pipe with radially drilled holes for flames to come out, was used to ignite the branch. It is designed to represent a surface fire front beneath the branch. The pilot ignitor was connected to a gas bottle with a flow regulator to produce a flame height of 4 ± 1 cm beneath the branch. The shutter protects the sample from radiation prior to the flammability test and is opened via remote control. The PC control system allows the operator to set the conditions of the experiment.

The VHFlux was equipped with an insulated clamp to hold the plant specimen, a heat flux sensor, weighing platform, ruler and camera. Insulation on the clamp was used to ensure the conductive heat from the clamp did not influence ignitability. The water-cooled heat flux sensor SBG01-100 (Hukseflux Thermal Sensors B.V.) was connected to the PC control system and used to monitor heat flux produced by the samples during the experiment. The weighing platform was connected to the PC control system and consisted of a Sartorius balance (Sartorius AG) that was programmed to record mass loss to 0.01 g at a 1 Hz frequency. A ruler was placed behind the weighting platform as a reference for flame length measurements. A digital SLR camera (Canon EOS 600D) was connected to the PC control system, and the software Camera-EOS Utility was used to film the experiments. This camera was fixed on a tripod and was situated approximately 2 m perpendicular to the sample stage.
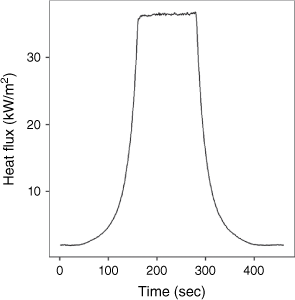
The radiative panel was programmed to mimic the propagation of a surface fire and its heat exposure (as observed by Santoni et al. 2006; Morandini and Silvani 2010). It travelled 120 cm over a 2-min (120 s) period with a 1 cm/s rate of spread, stopping 21 cm from the branch sample to achieve a maximum radiative heat flux of 35 kW/m2. It then remained in this forward position for 2 min, before moving back to its initial position for a further 2 min. As the radiative panel approaches, the plant sample is exposed to an increasing level of radiant heat (akin to an approaching flame front) (Fig. 2). Then, after 2 min at the maximum radiant heat flux, the panel recedes and the radiant heat flux exposure declines.
Dynamic heat flux curve depicting the radiant energy received by a branch sample during the flammability test.
Before the experiment commenced, the branch samples were positioned so the minimum distance between the branch and the radiative heat panel was 21 cm (at its most forward position to achieve a maximum radiative heat flux of 35 kW/m2). The branch was clamped from above by the main stem, with the foliage hanging down. The height was adjusted so that the lowest part of the branch specimen could be directly impacted by the flames from the pilot ignitor. This orientation allowed for a more consistent application of flames to the foliage of each species irrespective of its growth form; that is, if oriented with the main stem at bottom, some species like P. esculentum would only have their stems exposed to flame, whereas others like A. serrulata would have leaves and stems exposed. A limitation of our approach was that the leaves were not always orientated as they would occur in a natural setting. However, a ‘natural’ orientation is difficult to define because it varies throughout the plant and among species. The pilot ignitor was positioned so that it would sit directly underneath the sample when the radiative panel was at its most forward position.
Once the plant sample was in position, the shutter was closed, the radiative panel turned on to pre-heat for 2 min and the pilot ignitor lit. The shutter was opened with the commencement of the linear stage movement program. Time to ignition and flaming duration were measured using a stopwatch (and checked against camera footage where required). Branch mass was recorded pre- and post-experiment, and mass loss was recorded throughout the experiment. Footage of each experiment was reviewed to determine the maximum flame length. See Table 2 for further details about each flammability metric.
| Flammability attribute | Flammability metrics | Abbrev. | Definition and method | |
|---|---|---|---|---|
| Ignitability: ease of ignition | Time to flaming ignition, s | time.ig | Time taken for sample to ignite after start of radiative heat exposure | |
| Probability of ignition | prob.ig | Proportion of successful ignitions out of total attempts (10) | ||
| Combustibility: rate of burning | Peak heat release rate, kJ/s | peak.hrr | Maximum rate of heat release during flaming combustion | |
| Median heat release rate, kJ/s | median.hrr | Median rate of heat release during flaming combustion | ||
| Flame length, cm | flame.len | Maximum length of flames | ||
| Sustainability: duration of burning | Flaming duration, s | flam.dur | Time from ignition to cessation of flaming. For branches with intermittent flaming (where there were multiple ignitions and extinctions), the duration of flaming for each instance was summed | |
| Total heat release, kW | total.hr | Total heat release during flaming combustion, calculated from start of first flaming to end of last flaming | ||
| Consumability: proportion of plant material consumed | Consumption, g/g | consume | Proportion of fuel consumed during the flammability test, calculated from branch mass pre- and post-experiment. |
In addition to the VHFlux, we used an IKA C1 oxygen bomb calorimeter to determine the gross heat of combustion of each plant species using the third set of branches collected. These branches were also fully rehydrated (as per Pérez-Harguindeguy et al. 2013) and only leaves were used in the test. Three tests were performed per species.
Calculation of flammability metrics
Mass loss data were checked for errors (e.g. spikes, missing values). Outliers and spikes were removed. Missing values were identified, and mass was interpolated using a fitted generalised additive model. Mass loss rate (g/s) was calculated for each time step (each second) by subtracting the mass of the current time step from the previous. From these data, peak mass loss was calculated (maximum value of mass loss during experiment).
Peak heat release rate was determined by calculating the heat release rate for each time step using the following equations and then finding the maximum value.
where ΔHc,net is the net heat of combustion (KJ/g), ΔHc,gross is the gross heat of combustion (KJ/g, obtained in oxygen bomb calorimeter), 2.449 is the heat content of condensed water (KJ/g), w is the plant moisture content (wet basis, [wet mass − dry mass]/wet mass), ΔHc,ch is the chemical heat of combustion (KJ/g), χ is the combustion efficiency (value of 0.88 used, combustion efficiency for wildfires (Urbanski 2013)), Q̇ is the heat release rate (KJ/s or KW) and ṁ is mass loss rate (g/s).
Total heat release (kW) was calculated by summing the heat release rate for the duration of flaming combustion. Heat release rate was determined by calculating the median value for heat release across all time steps during flaming combustion.
Time to flaming ignition and flaming duration did not require any further calculation. Probability of ignition was determined by dividing the total number of successful ignitions by the number of ignition attempts.
Measurement of plant traits
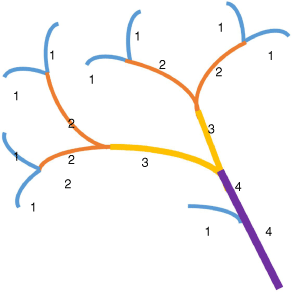
The traits of each plant species were measured within 48 h of sample collection; Table 3 describes each trait. Trait measurements were conducted on the full sample (all leaves and stems), except for leaf area and specific leaf area, which were determined for a single leaf per sample. The Horton–Strahler ordering scheme (where the smallest branch is defined as order one) was used to identify the maximum branch order in each plant specimen (Fig. 3). Oven dry weight was achieved by drying samples in an oven at 105°C for 48 h and weighing twice, 24 h apart, to ensure they reached constant mass. The bulk volume of the specimen was calculated by measuring the dimensions (length, width, depth) of the smallest rectangular prism that would encase each plant sample when clamped with the main stem at the top (for consistency with flammability experiments). A LI-COR LI-300C leaf area meter was used to measure one-sided surface area for a single leaf to determine leaf area and specific leaf area. All leaves and stems (less than 4 mm in diameter) from each branch were then processed in the leafarea meter to determine the one-sided surface area of the branch. Branch total surface area was calculated by multiplying the one-sided surface area of the branch by two and then adding this to the surface area of stems greater than 4 mm in diameter (measured using the equation of a cylinder). Branch volume was calculated using water displacement. Mean values of each trait were calculated for each species using the 10 replicate samples.
| Plant trait | Abbrev. | Description | |
|---|---|---|---|
| Leaf traits | |||
| Specific leaf area, cm2/g | sla | One-sided surface area of a single fresh leaf per oven dry weight | |
| Leaf area, cm2 | la | One-sided surface area of a single fresh leaf | |
| Branch traits | |||
| Bulk density, g/cm3 | bulkden | Mass of dry branch divided by the bulk volume of the branch | |
| Branch moisture content, % | mc | Percent of water in the branch divided by its oven dry weight | |
| Maximum branch order | order | Maximum branch order per plant specimen using the Horton-Strahler ordering scheme | |
| Branch total surface area, cm2 | tsa | Total surface area of the branch | |
| Branch surface area to volume ratio, cm2/cm3 | sav | Total surface area of the branch divided by the bulk volume of the branch | |
| Packing ratio, cm3/cm3 | packing | Volume of the branch divided the bulk volume of the branch | |
| Branch biomass (dry weight), g | biomass | Oven dry weight of branch | |
Diagram depicting plant specimen. Numbers indicate branch order based on the Horton–Strahler ordering scheme (Strahler 1957; Mileyko et al. 2012).
Data analysis
Median values for the flammability metrics and plant traits were calculated for each species using the 10 replicate branch specimens. These median data were used for all subsequent analysis. We quantified the level of correlation between all flammability metrics. This enabled us to examine relationships between the flammability attributes (ignitability, combustibiliy, sustainability and consumability), as well as relationships between different metrics for the same attribute (e.g. ignitability: time to flaming ignition vs probability of ignition). We used Spearman’s rank correlation coefficient due to the non-normality of some metrics.
We applied a set of evaluation criteria to identify metrics that may be suitable to use across multiple flammability studies to promote greater consistency. We considered each metric in terms of its:
ability to differentiate between species based on flammability measurements in this study;
strength of correlation with the fundamental metric for a particular flammability axis based on correlation analyses outlined above;
measurability with most experimental apparatuses; and
measurability at different scales from leaf to vegetation community.
The fundamental metrics were ‘time to ignition’ for ignitability (Anderson 1970), 'peak heat release rate’ for combustibility (Babrauskas and Peacock 1992) and ‘total heat release’ for sustainability (Schwilk 2015). Consumption (proportion consumed) was the only metric for consumability. The measurability of the metrics using different experimental apparatuses and across different scales was assessed qualitatively by considering the metrics used in previous studies with contrasting methodologies (e.g. leaf held over a flame (Clarke et al. 2014), muffle furnace (Gill and Moore 1996; Murray et al. 2013), cone calorimeter, epiradiator (Ganteaume et al. 2021), plant barbeque (Jaureguiberry et al. 2011).
Next, we sought to identify which plant traits best predict the subset of flammability metrics at the branch scale. This was done using multiple linear regression (GLMs) (Moore and McCabe 1999). We examined the correlations between each pair of plant traits using Spearman’s rank correlation coefficient. For highly correlated pairs of traits (r > 0.9), we retained the trait that was easier to measure in the laboratory and field. We used all additive combinations of the remaining predictor variables to fit the models. The number of predictors in any model was limited to two to avoid overfitting the models given the small sample size (n = 14). We used Akaike’s information criterion (AIC) to compare levels of support for the models (Burnham and Anderson 2004). Each model was assigned an Akaike weight (w), which is the probability that the model is the best model. We present only the highest-ranked models (within two AIC units of the best model) in the results. The plant traits that best predict each flammability metric are identified among these highest-ranked models. We calculated R2 as a measure of goodness of fit for the highest-ranked models.
All data processing and statistical analyses were done in the R statistical programming language (version 4.1.1). We used the psych package to display the correlations (Reville 2023), the MuMln package (Barton 2022) to fit and rank the GLMs and the visreg package to display the regression models (Breheny and Burchett 2017).
Results
Relationships between key flammability metrics
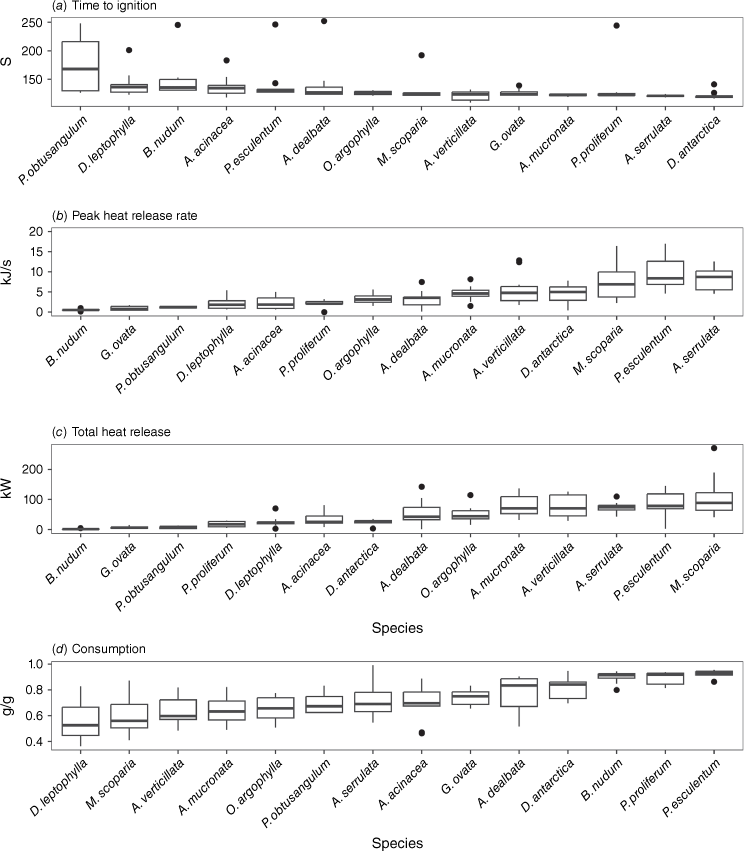
The species varied substantially in their flammability (Fig. 4, Table 4) with a combination of growth forms at either end of the flammability spectrum (e.g. ferns with broad fronds vs fine needled shrubs). D. antarctica, a tree fern that is typically found in wetter parts of the landscape, exhibited the shortest time to ignition (120 s) and a relatively high peak heat release rate (3.86 kJ/s). In contrast, A. serrulata, a dense mounding shrub with small, needle-like leaves, had a similar time to ignition (121 s) and the highest peak heat release rate (4.22 kJ/s). P. esculentum, a ground fern found across a wide spectrum of eucalypt forests and woodlands, also had a high peak heat release rate (1.72 kJ/s) and high total heat release (52 kW) as well as the highest consumption (93%). Conversely, B. nudum, a ground fern found in wetter parts of the landscape had one of the longest times to ignition (136 s), the lowest peak heat release rate (0.18 kJ/s), but relatively high consumption (92%). P. obtusangulum, a ground creeper found in dry eucalypt forests and heathy woodlands, had the longest time to ignition (168 s) and one of the lowest peak heat release rates (0.68 kJ/s).
Boxplots depicting values for the ‘fundamental’ flammability metrics for each species. (a) Time to ignition as a measure of ignitability. (b) Peak heat release rate as a measure of combustibility. (c) Total heat release as a measure of sustainability. (d) Consumption as a measure of consumability. Species are ordered from least to most flammable for each metric based on their median values.
| Heat of combust A (MJ/Kg) | time.ig (s) | prob.ig | median.hrr (kJ/s) | peak.hrr (kJ/s) | flame.len (cm) | total.hr (kW) | flam.dur (s) | Consume (g/g) | ||
|---|---|---|---|---|---|---|---|---|---|---|
| Acacia acinacea | 10.7 (0.17) | 135 (14) | 1.0 | 0.46 (0.29) | 0.96 (0.43) | 25 (13) | 25.88 (23.96) | 22 (31) | 0.70 (0.11) | |
| Acacia dealbata | 7.28 (0.21) | 127 (12) | 0.9 | 1.02 (0.91) | 2.10 (1.59) | 29 (8) | 42.94 (41.42) | 25 (38) | 0.83 (0.22) | |
| Acacia mucronata | 8.48 (0.36) | 123 (3) | 1.0 | 1.00 (0.40) | 2.40 (0.99) | 49 (25) | 70.67 (56.52) | 412 (10) | 0.63 (0.15) | |
| Acrotriche serrulata | 11.44 (0.06) | 121 (2) | 1.0 | 0.79 (0.98) | 4.22 (3.28) | 28 (17) | 74.36 (15.10) | 27 (9) | 0.69 (0.15) | |
| Acacia verticillata | 7.56 (0.55) | 124 (14) | 1.0 | 0.37 (0.20) | 1.28 (1.39) | 48 (38) | 71.03 (69.48) | 43 (11) | 0.60 (0.15) | |
| Blechnum nudum | 2.95 (1.01) | 136 (19) | 1.0 | 0.09 (0.13) | 0.18 (0.41) | 43 (21) | 1.44 (0.99) | 5 (3) | 0.92 (0.03) | |
| Dicksonia antarctica | 6.72 (0.16) | 120 (3) | 0.9 | 1.17 (0.61) | 3.86 (1.98) | 47 (9) | 27.52 (8.24) | 17 (5) | 0.84 (0.13) | |
| Daviesia leptophylla | 9.91 (0.24) | 137 (14) | 1.0 | 0.40 (0.21) | 0.75 (0.18) | 18 (29) | 21.96 (6.72) | 14 (17) | 0.53 (0.22) | |
| Goodenia ovata | 4.39 (0.62) | 124 (6) | 1.0 | 0.14 (0.07) | 0.26 (0.06) | 37 (32) | 6.48 (4.80) | 9 (9) | 0.75 (0.10) | |
| Monotoca scoparia | 11.12 (0.09) | 125 (4) | 1.0 | 0.57 (0.21) | 1.64 (3.69) | 43 (26) | 88.93 (58.04) | 44 (28) | 0.56 (0.18) | |
| Olearia argophylla | 7.10 (0.12) | 126 (6) | 1.0 | 0.53 (0.39) | 1.56 (1.56) | 44 (26) | 44.62 (27.02) | 34 (14) | 0.66 (0.16) | |
| Pteridium esculentum | 7.94 (0.10) | 131 (5) | 1.0 | 1.38 (1.31) | 4.01 (2.18) | 52 (9) | 79.03 (49.23) | 57 (25) | 0.93 (0.03) | |
| Platylobium obtusangulum | 9.91 (0.15) | 168 (86) | 0.4 | 0.09 (0.09) | 0.68 (0.03) | 10 (9) | 6.85 (6.96) | 6 (4) | 0.67 (0.12) | |
| Polystichum proliferum | 5.46 (0.56) | 123 (3) | 1.0 | 0.64 (0.13) | 1.72 (0.20) | 42 (15) | 17.63 (17.34) | 10 (3) | 0.92 (0.08) |
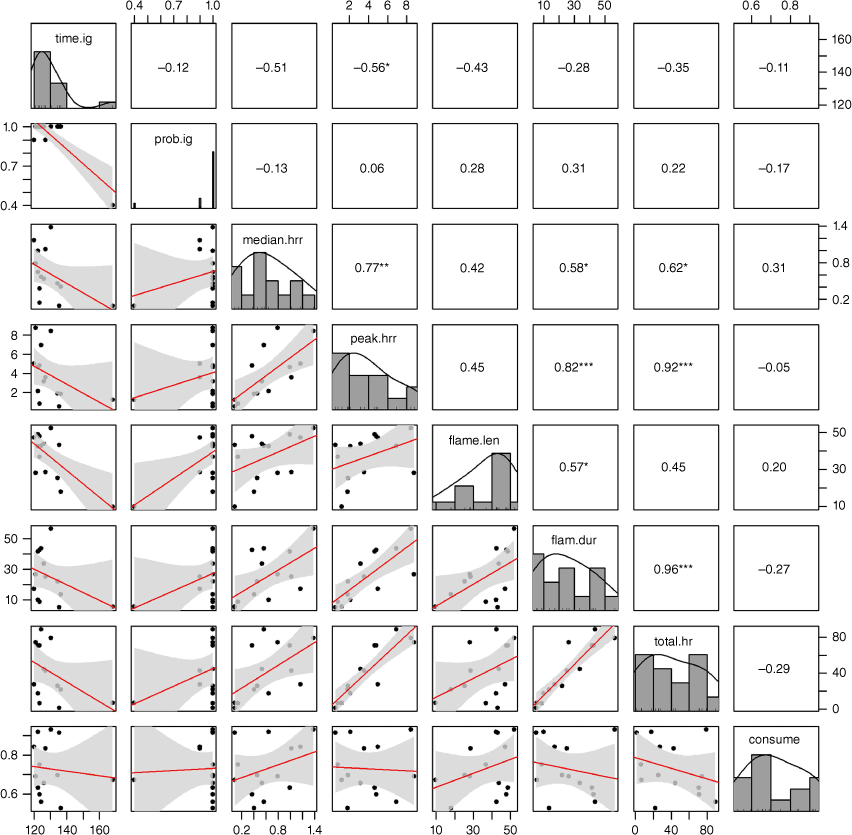
Probability of ignition was highly skewed, with only P. obtusangulum (pr(ignition) = 0.4), D. antarctica (pr(ignition) = 0.9) and A. dealbata (pr(ignition) = 0.9) having probabilities less than one (Fig. 5). This skewness made it difficult to reliably assess the strength of the relationship between probability of ignition and time to ignition; the correlation coefficient for our data suggests little correlation (r = −0.12). Given there was little species differentiation for the probability of ignition, we selected time to ignition as our preferred measure of ignitability (Table 5).
Correlation matrix depicting the Spearman’s rank correlation coefficients (r) between the flammability metrics. Number of asterisks indicates the significance of the correlation (no asterisk = non-significant). Histograms show the distribution of data for each variable. Scatterplots illustrate relationships between pairs of variables. Fitted linear regression shown in red, with 95% confidence interval in grey.
| Flammability attribute | Flammability metrics | Evaluation criteria | ||||
|---|---|---|---|---|---|---|
| Provides differentiation among species | Strongly correlates with the fundamental metric | Measurable with most experimental apparatuses | Measurable at different scales | |||
| Ignitability | time.ig A | Y | NA B | Y | Y | |
| prob.ig | N | N | Y | Y | ||
| Combustibility | peak.hrr A | Y | NA B | N | Y D | |
| median.hrr | Y | Y | N | Y D | ||
| flame.len | Y | N | Y | Y | ||
| Sustainability | total.hr A | Y | NA B | N | Y | |
| flam.dur | Y | Y C | Y | Y | ||
| Consumability | consume A | Y | NA B | Y | Y | |
The recommended subset of metrics are highlighted in grey.
Peak heat release rate was highly correlated with median heat release rate (r = 0.77), suggesting these metrics could be used interchangeably. Flame length was not strongly correlated with either (r = 0.42-0.45, respectively), suggesting it may not be a reliable proxy for heat release rate and, therefore, combustibility. We retained peak heat release rate as our preferred measure of combustibility, despite its limitations in terms of measurability (Table 5).
The two measures of sustainability – total heat release and flaming duration – were highly correlated (r = 0.96). We retained flaming duration as our preferred measure of sustainability because it is simpler to measure across a range of experimental apparatus and scales. Importantly, flaming duration was also moderately correlated with the heat release rate metrics (r = 0.58–0.82), suggesting it may also serve as an indicator of combustibility.
No selection process was required for consumability because there was only one metric: consumption (i.e. the proportion consumed). Consumption was not strongly correlated with any other flammability metrics.
Relationships between the traits of living plants
There was considerable variability among species for all vegetation traits (Table 6). Branch total surface area ranged from 236 (P. obtusangulum) to 2117 cm2 (O. argophylla). Maximum branch order ranged from one for the ferns (e.g. D. antarctica and B. nudum) to six for small shrubs (M. scoparia and A. serrulata). Branch moisture content ranged from 88% for A. acinacea to 336% for G. ovata.
| Species name | Specific leaf area (cm2/g) | Leaf area (cm2) | Bulk density (g/cm3) | Moisture content (%) | Max branch order | Total surface area (cm2) | Surface area to vol (cm2/cm3) | Packing ratio (cm3/cm3) | Biomass (g) | |
|---|---|---|---|---|---|---|---|---|---|---|
| Acacia acinacea | 32.7 (13.2) | 0.23 (0.06) | 0.00045 (0.00048) | 88 (19) | 2 (1) | 368.6 (194.8) | 66.7 (56.9) | 0.0005 (0.0009) | 4.2 (1.7) | |
| Acacia dealbata | 87.6 (24.7) | 2.50 (0.83) | 0.00066 (0.00048) | 132 (23) | 2 (1) | 1889.8 (883.3) | 64.3 (15.6) | 0.0018 (0.0006) | 12.5 (5.6) | |
| Acacia mucronata | 62.4 (10.8) | 2.57 (0.37) | 0.00031 (0.00012) | 137 (50) | 4 (1) | 1182.6 (788.3) | 65.0 (37.1) | 0.0006 (0.0004) | 9.0 (7.7) | |
| Acrotriche serrulata | 114.4 (44.9) | 0.03 (0.02) | 0.00131 (0.00090) | 105 (20) | 6 (1) | 754.3 (178.7) | 50.3 (14.1) | 0.0023 (0.0012) | 8.3 (4.6) | |
| Acacia verticillata | 76.9 (49.7) | 0.03 (0.004) | 0.00023 (0.00006) | 163 (21) | 5 (1) | 1109.0 (849.4) | 45.4 (18.8) | 0.0006 (0.0002) | 9.7 (6.5) | |
| Blechnum nudum | 155.4 (14.1) | 321.7 (30.1) | 0.00069 (0.00056) | 246 (47) | 1 (0) | 643.4 (60.2) | 204.3 (40.2) | 0.0011 (0.0007) | 2.1 (0.4) | |
| Dicksonia antarctica | 105.2 (23.2) | 609.7 (109.1) | 0.00042 (0.00020) | 148 (43) | 1 (0) | 1219.4 (218.3) | 76.0 (25.1) | 0.0010 (0.0010) | 4.9 (1.8) | |
| Daviesia leptophylla | 56.1 (10.9) | 0.94 (0.50) | 0.00055 (0.00027) | 111 (31) | 3 (2) | 654.9 (334.7) | 167.4 (133.5) | 0.0005 (0.0004) | 5.4 (2.3) | |
| Goodenia ovata | 209.6 (48.4) | 15.97 (7.7) | 0.00024 (0.00008) | 336 (74) | 1 (1) | 709.1 (340.6) | 112.0 (18.6) | 0.0009 (0.0003) | 1.5 (0.5) | |
| Monotoca scoparia | 50.6 (4.9) | 0.13 (0.03) | 0.00051 (0.00027) | 103 (19) | 6 (3) | 1240.3 (382.4) | 31.7 (8.5) | 0.0012 (0.0006) | 16.7 (7.6) | |
| Olearia argophylla | 121.2 (21.7) | 35.8 (10.8) | 0.00030 (0.00013) | 206 (42) | 3 (2) | 2116.8 (559.9) | 65.5 (12.1) | 0.0012 (0.0002) | 8.1 (2.0) | |
| Pteridium esculentum | 53.8 (28.8) | 562.1 (176.1) | 0.00023 (0.00024) | 141 (62) | 1 (1) | 1124.2 (244.3) | 42.0 (6.4) | 0.0006 (0.0002) | 12.6 (4.1) | |
| Platylobium obtusangulum | 109.4 (12.3) | 4.09 (0.26) | 0.00041 (0.00014) | 203 (47) | 1 (0) | 235.6 (30.6) | 72.8 (9.7) | 0.0017 (0.0008) | 0.9 (0.1) | |
| Polystichum proliferum | 118.1 (6.7) | 337.4 (39.9) | 0.00110 (0.00051) | 191 (12) | 1 (0) | 674.8 (79.7) | 78.7 (44.6) | 0.0033 (0.0024) | 2.9 (0.6) |
There was a strong negative correlation between leaf area and maximum branch order (r = −0.82) (Fig. 6). At opposite ends of this spectrum were prostate shrubs with small leaves and tight branching versus ground ferns with large fronds and no branching. Specific leaf area and branch moisture content were strongly positively correlated (r = 0.82); a combination of ferns and broad-leaved shrubs exhibited both high specific leaf area and high leaf moisture content. There was a strong negative correlation between branch surface area to volume ratio and total branch biomass (r = −0.84); species with the highest branch biomass tended to have smaller leaves with a higher surface area to volume ratio.
Correlation matrix depicting the Spearman’s rank correlation coefficients (r) between the plant traits. Number of asterisks indicates the significance of the correlation (no asterisk = non-significant). Linear regression shown in red, with 95% confidence interval in grey.
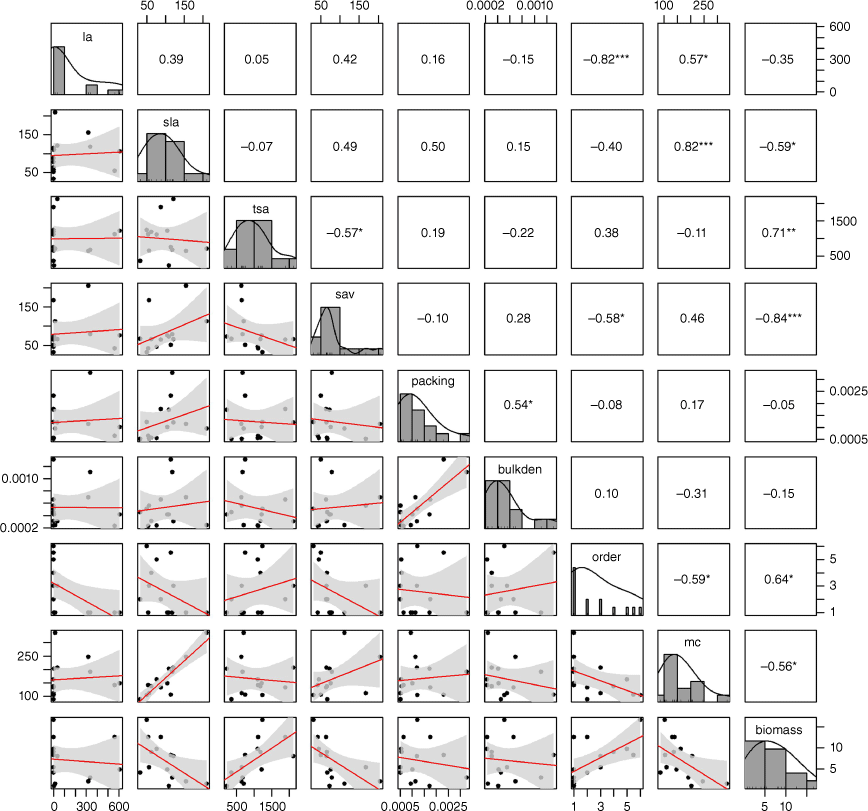
For the subsequent modelling we selected maximum branch order over leaf area, branch moisture content over specific leaf area and branch biomass over branch surface area to volume ratio. In each instance we selected the variable that is easier to measure.
Linking flammability metrics to the traits of living plants at the branch scale
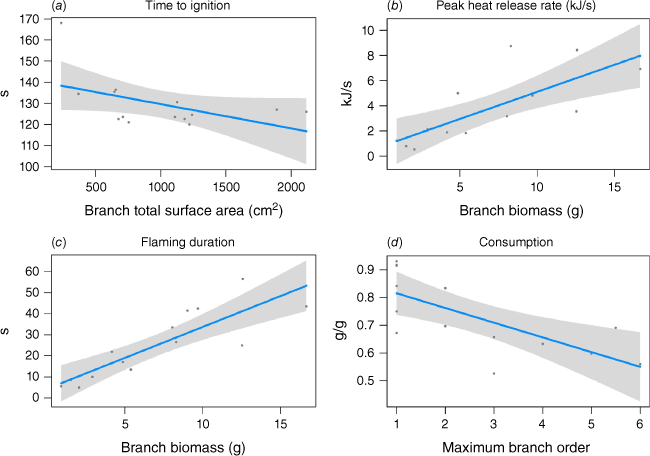
The model-selection process identified a subset of plant traits that strongly predicted flammability (Fig. 7a–d, Table 7). Branch total surface area (R2 = 0.18) was the sole predictor of time to ignition in the highest-ranked model, with time to ignition decreasing with increasing branch surface area. Branch biomass was the strongest predictor of the peak heat release rate (R2 = 0.53), with heat release rate increasing with increasing branch biomass. Branch biomass also strongly predicted flaming duration (R2 = 0.70), featuring in all the highest-ranked models. Bulk density and packing ratio were also important to flaming duration, both having a negative influence. Maximum branch order strongly predicted consumption (R2 = 0.47); the proportion of biomass that was consumed decreased within increasing branch order. Other predictors of consumption were bulk density, packing ratio and total biomass, all of which had a positive influence on consumption.
Plots depicting the modelled influence of vegetation traits on (a) Time to ignition, (b) Heat release rate, (c) Flaming duration and (d) Consumption.
| Flammability axis | Equation | R2 (adj) | logLik | AICc | ∆AICc | Weight | |
|---|---|---|---|---|---|---|---|
| Time to ignition | 141.1 − 0.01 × branch tsa | 0.18 | −52.51 | 113.4 | 0.00 | 0.22 | |
| Time to ignition | 137.1 − 1.06 × branch biomass | 0.10 | −53.23 | 114.8 | 1.40 | 0.11 | |
| Peak heat release rate | 0.81 + 0.43 × branch biomass | 0.53 | −27.47 | 63.34 | 0.00 | 0.44 | |
| Flaming duration | 4.32 + 2.94 × branch biomass | 0.70 | −49.4 | 107.1 | 0.00 | 0.35 | |
| Flaming duration | 11.74 + 2.85 × branch biomass – 12 751 × bulk density | 0.79 | −47.5 | 107.4 | 0.32 | 0.30 | |
| Flaming duration | 11.21 + 2.81 × branch biomass − 4792 × packing ratio | 0.78 | −47.8 | 108.1 | 1.01 | 0.21 | |
| Consumption | 0.87 − 0.05 × max branch order | 0.47 | 13.5 | −18.7 | 0.00 | 0.30 | |
| Consumption | 0.80 − 0.06 × max branch order + 141.74 × bulk density | 0.55 | 15.4 | −18.3 | 0.40 | 0.24 | |
| Consumption | 0.80 − 0.05 × max branch order + 53.27 × packing ratio | 0.54 | 15.1 | −17.7 | 1.00 | 0.18 | |
| Consumption | 0.84 − 0.07 × max branch order + 0.01 × branch biomass | 0.52 | 14.9 | −17.3 | 1.40 | 0.15 |
Bold indicates highest-ranked model for a particular flammability axis.
Discussion
Our analyses of multiple flammability metrics identified a subset of preferred metrics that may be suitable to use across multiple studies to promote greater consistency when quantifying the flammability of living plants. Together, the preferred metrics quantify the key flammability attributes: time to ignition for ignitability; peak heat release rate for combustibility; flaming duration for sustainability; and consumption for consumability. They can be measured using different experimental apparatus and at multiple scales. Heat release rate is not as easily measured with all apparatus, but our results suggest flaming duration could be used as a proxy for heat release rate if needed. Branch total surface area, maximum branch order and branch biomass were the strongest predictors of the flammability metrics, suggesting they could be used to predict flammability in the absence of direct measures.
Relationship between flammability metrics for live plant specimens
Our correlation analysis of a range of flammability metrics found that the difficult-to-measure, but more fundamental combustibility metrics (e.g. median heat release rate and peak heat release rate) were only moderately correlated with flame length (r = 0.42–0.45), a metric that can be measured using a range of experimental apparatus and across spatial scales (leaf to vegetation community). This led us to conclude that although flame length is easier to measure, it was not suitable as a preferred metric to represent combustibility. Instead, we retained peak heat release rate in our analysis as the preferred metric for combustibility, despite being more difficult to measure with some experimental apparatus. Flame length (or char height) is often used as an indicator of fire intensity at field scales (Fraser et al. 2016; Tumino et al. 2019; Newberry et al. 2020) and may be an effective surrogate at this scale, where it is easier to estimate the average flame length. At the plant scale, we observed that flame length was highly variable throughout the combustion process. We considered estimations of maximum flame length to be less subjective than estimations of average flame length; however, an average may have provided a better indication of the heat release rate throughout the combustion period.
Flaming duration is typically used as a measure of sustainability. It was highly correlated with total heat release (r = 0.96), but is likely to be simpler to measure across scales and with different experimental apparatuses. Therefore, we selected flaming duration as our preferred metric for sustainability. Flaming duration and total heat release were both relatively strongly correlated with the combustibility metrics (median heat release rate and peak heat release rate). This aligns with the findings of several studies that report positive correlations between flaming duration and measures of combustibility at the leaf (Blackhall and Raffaele 2019; Krix et al. 2019), branch (Jaureguiberry et al. 2011; Wyse et al. 2016; Alam et al. 2020) and plot scales (Fraser et al. 2016; Prior et al. 2018). This result suggests combustibility and sustainability may not need to be depicted separately and instead, a single measure such as flaming duration may suffice for both.
Consumption (proportion consumed), the only measure of consumability in our study, was not correlated with any of the other flammability metrics. Consumption is sometimes considered an indicator of total heat release (Pausas et al. 2017) but in our dataset, differences in biomass and gross heat of combustion between the species meant there was no correlation. This result highlights the importance of either standardising the amount of biomass prior to burning or measuring mass loss if consumability data are to be used to make inferences about heat release. That said, the proportion consumed is still likely to be a useful flammability metric for understanding the ecological response to fire of some species.
We chose ‘time to ignition’ as our preferred measure of ignitability. This was necessary for our dataset because there was little species differentiation for the other ignitability metric, the ‘probability of ignition,’ because most species eventually ignited. The weak negative correlation between time to ignition and the probability of ignition suggests that plant species requiring longer to ignite had less chance of igniting at all. The lack of species differentiation for the probability of ignition could be due to the heat flux of the radiant panel (akin to a low intensity fire) and pilot ignitor, which was sufficient to ignite almost all plant specimens (Miller et al. 2023). Ignitability depends on the heat source applied to the fuel particle and the properties of the fuel (Anderson 1970). Time to ignition appears to be the more responsive measure of ignitability, making it a more effective measure of ignitability across a range of experimental conditions, where different heat sources may be applied. Additionally, time to ignition is a widely used measure of ignitability in laboratory-based flammability studies and can be measured using a range of experimental apparatuses (Popović et al. 2021). Time to ignition has also been used at field scales to quantify plant scale flammability (Fraser et al. 2016).
Time to ignition was negatively correlated with the combustibility and sustainability variables in our study, suggesting plants that are more ignitable (i.e. less time to ignite) have higher heat release rates. These results align with other studies. Fraser et al. (2016) found at field scales that the more ignitable vegetation generates larger flames (combustibility) and burns for longer (sustainability). Wyse et al. (2018) reported a positive correlation between ignitability (speed of ignition) and combustibility (maximum temperature).
Key plant traits to predict the flammability of living plants
Branch total surface area was an important predictor of ignitability. Other studies identify leaf area as an important trait for vegetation flammability (Murray et al. 2013; Krix et al. 2019), but ours is the first to measure surface area at the branch scale. Branch total surface area constituted the surface area of all the leaves and stems within a plant specimen. Species with high branch total surface area sometimes had large leaves (or fronds), or they had numerous tiny leaves. In some instances, the stem itself may have contributed substantially to the total surface area (e.g. A. verticillata). As branch total surface area increased, there was more surface area exposed to radiant heating. This would have led to a higher rate of surface heating, higher concentration of pyrolysis gases surrounding the specimen and more efficient moisture loss, contributing to faster ignition. In contrast, plant specimens with less total surface area (e.g. sparse, small leaves) might have experienced a higher level of convective cooling, which offsets radiation heating and maintains a lower temperature at the leaf surface, leading to longer times to ignition (Finney et al. 2013).
The strong relationship between branch biomass and all the flammability metrics aligns with the broader fire literature, where the amount of biomass is known to be a fundamental determinant of fire in many vegetation communities (Meyn et al. 2007; Bradstock et al. 2010). When there is more biomass, there is more energy available, leading to more intense burning. Branch biomass was highly correlated with branch total surface area, and for both metrics the correlation with leaf size was weak. Species with high branch biomass constituted a range of growth forms from ferns to small shrubs. They had either a small number of large leaves or many small leaves. In either case, the horizontal and vertical continuity of biomass helped facilitate flame propagation throughout the specimen. Amount of biomass or fuel load is a key predictor within several fire behaviour models (McArthur 1967; Sneeuwjagt and Peet 1985; Cheney et al. 1998). It is often experimentally or statistically controlled in laboratory-based flammability studies (Popović et al. 2021). However, when biomass is considered, it often emerges as a key predictor of sustainability (Grootemaat et al. 2015; Simpson et al. 2016; Wyse et al. 2018) and combustibility (Etlinger and Beall 2004; Simpson et al. 2016).
Maximum branch order was another important predictor of flammability in our study, emerging as a key predictor of consumption in combination with either branch biomass, packing ratio or bulk density. Maximum branch order appeared to have a negative effect on consumability. This may reflect the strong negative association between maximum branch order and leaf size. Larger leaves produce larger flames, culminating in a higher heat release rate and more complete consumption. In contrast, smaller leaves produce smaller flames, which may be too small to bridge the gap between adjacent leaves for sparsely packed fuel. However, when the leaves on a branch are more tightly packed (i.e. high branch biomass, high bulk density or packing ratio), the flames spread more easily between the leaves resulting in more complete consumption.
Moisture was not a strong predictor of flammability despite large differences in the median moisture content between the species (from 88 to 336%). Moisture content is widely recognised as a key driver of the flammability of dead plant material (Varner et al. 2015) and fire behaviour (McArthur 1967; Rothermel 1972). In contrast, its influence on the flammability of living plants is poorly understood (Finney et al. 2013; McAllister and Weise 2017). The heat flux of the radiant heat panel and pilot ignitor in the VHFlux apparatus, which was designed to simulate a forest fire, likely caused the plant specimen to lose moisture quickly. This may have been further exacerbated by a higher specific leaf area for species with higher moisture contents (r = 0.82), causing these species to lose moisture more efficiently (Poorter et al. 2009). Numerous studies that focus on the relationship between live foliage moisture and flammability conclude that moisture is important (Popović et al. 2021). However, our results indicate that when multiple traits are considered, the importance of moisture may be surpassed by other traits. Similarly, others have identified a range of traits that perform better than moisture when multiple predictors of flammability are evaluated (e.g. the proportions of dead and fine fuel (Burger and Bond 2015), terpene content (Ganteaume et al. 2021), leaf area and specific leaf area (Krix and Murray 2018; Krix et al. 2019), leaf biomass (Grootemaat et al. 2015), bulk density, hydrocarbons and specific leaf area (Tumino et al. 2019)).
Implications for measuring and predicting the flammability of living plants
We sought to lay a foundation for more consistency among future flammability studies by comparing multiple flammability metrics for living plants at the branch scale. We identified a subset of four preferred metrics that quantify the key axes of flammability and are also measurable using different experimental apparatus and at multiple scales. Incorporating these metrics into future flammability studies could provide a common thread of consistency, enabling a broader understanding of plant flammability. However, our study was limited to a single experimental apparatus and scale of measurement. Therefore, we recommend further research to fully evaluate the range of flammability metrics across different experimental apparatus and scales of measurement.
Research that examines relationships between numerous plant traits and flammability (rather than focusing on very small numbers of traits) helps to identify the best plant traits for predicting flammability. An ability to predict the relative flammability of species using simple traits could be used to guide the selection of plant species for low flammability gardens and green fire breaks on the wildland–urban interface (White and Zipperer 2010; Murray et al. 2020). These species selections are often informed by flammability research at the leaf scale (Gill and Moore 1996; Dimitrakopoulos and Papaioannou 2001). Yet, leaf scale measurements of flammability are not always relevant to flammability at larger scales because plant architecture is not considered. Our measurements at the branch scale enable some of the structural attributes of the plant to be accounted for, as well as the leaf traits. Indeed, our models identify strong links between some branch scale traits and flammability, which may not have been apparent in a leaf scale study. For example, we found that some species with small leaves were highly flammable when there were many leaves on a branch, resulting in high biomass or branch total surface area.
To understand how a plant influences the flammability of a vegetation community, its contribution to the structure of the vegetation community will be important, in addition to its abundance and flammability as an individual plant (Pérez-Harguindeguy et al. 2013). P. obtusangulum is a good example of a plant whose branch scale flammability is relatively low but whose contribution to the flammability of a vegetation community may be higher. This species is a creeper, so it can increase the horizontal and vertical continuity of a vegetation community when it grows abundantly, potentially enhancing the flammability of the vegetation community despite its relatively low flammability. Another example is D. antarctica, a tree fern with relatively high branch scale flammability. Despite being flammable when exposed to an ignition source, D. antarctica may have a dampening effect on the flammability of a vegetation community because the large fronds create shade and therefore contribute to a moister microclimate. This highlights the need to consider the structural contribution of a plant within a vegetation community to fully understand its contribution to landscape flammability (Loudermilk et al. 2022). Our research provides flammability metrics that can be used across multiple scales to start understanding these relationships.
Conclusions
Our results provide a pathway towards more consistency in plant flammability research by identifying a subset of flammability metrics for live plant specimens that: quantify the key axes of flammability; are measurable using a range of experimental apparatuses; and are measurable at different scales. Future studies incorporating these flammability metrics will generate data that are more comparable, enabling a broader understanding of plant flammability. We used these flammability metrics to explore relationships between flammability and plant traits. Branch total surface area, maximum branch order and branch biomass were the strongest predictors of the flammability, suggesting they could be used to predict flammability in the absence of direct flammability measurements.
Data availability
All data are stored on a University of Melbourne shared server and are available on request from the authors.
Declaration of funding
This research received funding from the University of Melbourne Early Career Researcher grant scheme. Dr Jane Cawson is funded by the Integrated Forest Ecosystem Research program, a joint research agreement between the University of Melbourne and the Victorian Department of Environment, Land, Water and Planning. Dr Alexander Filkov is funded by an ARC Discovery grant.
References
Alam MA, Wyse SV, Buckley HL, Perry GLW, Sullivan JJ, Mason NWH, Buxton R, Richardson SJ, Curran TJ (2020) Shoot flammability is decoupled from leaf flammability, but controlled by leaf functional traits. Journal of Ecology 108, 641-653.
| Crossref | Google Scholar |
Alexander ME, Cruz MG (2012) Modelling the effects of surface and crown fire behaviour on serotinous cone opening in jack pine and lodgepole pine forests. International Journal of Wildland Fire 21, 709-721.
| Crossref | Google Scholar |
Anderson HE (1970) Forest fuel ignitibility. Fire Technology 6, 312-319.
| Crossref | Google Scholar |
Babrauskas V, Peacock RD (1992) Heat release rate: The single most important variable in fire hazard. Fire Safety Journal 18, 255-272.
| Crossref | Google Scholar |
Balde B, Vega-Garcia C, Gelabert PJ, Ameztegui A, Rodrigues M (2023) The relationship between fire severity and burning efficiency for estimating wildfire emissions in Mediterranean forests. Journal of Forestry Research 34, 1195-1206.
| Crossref | Google Scholar |
Barton K (2022) MuMln: Multi‐model inference, version 1.47.5. Available at https://CRAN.R‐project.org/package=MuMIn
Bennett LT, Aponte C, Tolhurst KG, Löw M, Baker TG (2013) Decreases in standing tree-based carbon stocks associated with repeated prescribed fires in a temperate mixed-species eucalypt forest. Forest Ecology and Management 306, 243-255.
| Crossref | Google Scholar |
Blackhall M, Raffaele E (2019) Flammability of Patagonian invaders and natives: When exotic plant species affect live fine fuel ignitability in wildland-urban interfaces. Landscape and Urban Planning 189, 1-10.
| Crossref | Google Scholar |
Bradstock RA, Hammill KA, Collins L, Price O (2010) Effects of weather, fuel and terrain on fire severity in topographically diverse landscapes of south-eastern Australia. Landscape Ecology 25, 607-619.
| Crossref | Google Scholar |
Breheny P, Burchett W (2017) Visualization of Regression Models Using visreg. The R Journal 9, 56-71.
| Crossref | Google Scholar |
Burger N, Bond WJ (2015) Flammability traits of Cape shrubland species with different post-fire recruitment strategies. South African Journal of Botany 101, 40-48.
| Crossref | Google Scholar |
Burnham KP, Anderson DR (2004) Multimodel Inference. Understanding AIC and BIC in Model Selection. Sociological Methods & Research 33, 261-304.
| Crossref | Google Scholar |
Burton JE, Penman TD, Filkov AI, Cawson JG (2023) Multi-scale investigation of factors influencing moisture thresholds for litter bed flammability. Agricultural and Forest Meteorology 337, 109514.
| Crossref | Google Scholar |
Cardoso AW, Oliveras I, Abernethy KA, Jeffery KJ, Lehmann D, Edzang Ndong J, McGregor I, Belcher CM, Bond WJ, Malhi YS (2018) Grass Species Flammability, Not Biomass, Drives Changes in Fire Behavior at Tropical Forest-Savanna Transitions. Frontiers in Forests and Global Change 1, 6.
| Crossref | Google Scholar |
Cheney NP, Gould JS, Catchpole WR (1998) Prediction of fire spread in grasslands. Internaional Journal of Wildland Fire 8, 1-13.
| Crossref | Google Scholar |
Clarke PJ, Prior LD, French BJ, Vincent B, Knox KJE, Bowman DMJS (2014) Using a rainforest-flame forest mosaic to test the hypothesis that leaf and litter fuel flammability is under natural selection. Oecologia 176, 1123-1133.
| Crossref | Google Scholar | PubMed |
Department of Environment Land Water and Planning (2016) ‘Native Vegetation - Modelled 2005 Ecological Vegetation Classes (with Bioregional Conservation Status).’ (Victorian State Goverment (data.vic.gov.au): Melbourne)
Dimitrakopoulos AP, Papaioannou KK (2001) Flammability Assessment of Mediterranean Forest Fuels. Fire Technology 37, 143-152.
| Crossref | Google Scholar |
Etlinger MG, Beall FC (2004) Development of a laboratory protocol for fire performance of landscape plants. International Journal of Wildland Fire 13, 479-488.
| Crossref | Google Scholar |
Finney MA, Cohen JD, McAllister SS, Jolly WM (2013) On the need for a theory of wildland fire spread. International Journal of Wildland Fire 22, 25-36.
| Crossref | Google Scholar |
Fraser IP, Williams RJ, Murphy BP, Camac JS, Vesk PA (2016) Fuels and landscape flammability in an Australian alpine environment. Austral Ecology 41, 657-670.
| Crossref | Google Scholar |
Ganteaume A, Romero B, Fernandez C, Ormeño E, Lecareux C (2021) Volatile and semi‑volatile terpenes impact leaf flammability: differences according to the level of terpene identification. Chemoecology 31, 259-275.
| Crossref | Google Scholar |
Gill AM, Zylstra P (2005) Flammability of Australian forests. Australian Forestry 68, 87-93.
| Crossref | Google Scholar |
Gould JS, Lachlan McCaw W, Phillip Cheney N (2011) Quantifying fine fuel dynamics and structure in dry eucalypt forest (Eucalyptus marginata) in Western Australia for fire management. Forest Ecology and Management 262, 531-546.
| Crossref | Google Scholar |
Grootemaat S, Wright IJ, van Bodegom PM, Cornelissen JHC, Cornwell WK (2015) Burn or rot: leaf traits explain why flammability and decomposability are decoupled across species. Functional Ecology 29, 1486-1497.
| Crossref | Google Scholar |
Hanley ME, Lamont BB (2000) Heat pre-treatment and the germination of soil- and canopy-stored seeds of south-western Australian species. Acta Oecologica 21, 315-321.
| Crossref | Google Scholar |
Harris S, Anderson W, Kilinc M, Fogarty L (2012) The relationship between fire behaviour measures and community loss: an exploratory analysis for developing a bushfire severity scale. Natural Hazards 63, 391-415.
| Crossref | Google Scholar |
Jaureguiberry P, Bertone G, Díaz S (2011) Device for the standard measurement of shoot flammability in the field. Austral Ecology 36, 821-829.
| Crossref | Google Scholar |
Keeley JE (2009) Fire intensity, fire severity and burn severity: a brief review and suggested usage. International Journal of Wildland Fire 18, 116-126.
| Crossref | Google Scholar |
Knorr W, Lehsten V, Arneth A (2012) Determinants and predictability of global wildfire emissions. Atmospheric Chemistry and Physics 12, 6845-6861.
| Crossref | Google Scholar |
Krix DW, Murray BR (2018) Landscape variation in plant leaf flammability is driven by leaf traits responding to environmental gradients. Ecosphere 9, e02093.
| Crossref | Google Scholar |
Krix DW, Phillips ML, Murray BR (2019) Relationships among leaf flammability attributes and identifying low-leaf-flammability species at the wildland–urban interface. International Journal of Wildland Fire 28, 295-307.
| Crossref | Google Scholar |
Krix DW, Murray ML, Murray BR (2022) Increasing radiant heat flux affects leaf flammability patterns in plant species of eastern Australian fire-prone woodlands. Plant Biology 24, 302-312.
| Crossref | Google Scholar | PubMed |
Lawes MJ, Richards A, Dathe J, Midgley JJ (2011) Bark thickness determines fire resistance of selected tree species from fire-prone tropical savanna in north Australia. Plant Ecology 212, 2057-2069.
| Crossref | Google Scholar |
Loudermilk EL, O’Brien JJ, Goodrick SL, Linn RR, Skowronski NS, Hiers JK (2022) Vegetation’s influence on fire behavior goes beyond just being fuel. Fire Ecology 18, 9.
| Crossref | Google Scholar |
Martin RE, Gordon DA, Gutierrez ME, Lee DS, Molina DM, Schroeder RA, Sapsis DB, Stephens SL, Chambers M (1993) Assessing the flammability of domestic and wildland vegetation. In 'Proceedings of the 12th Conference on Fire and Forest Meteorology’. pp. 130–137. (Society of American Foresters Publication 94-02: Bethesda, MD, USA)
McAllister S, Weise DR (2017) Effects of Season on Ignition of Live Wildland Fuels Using the Forced Ignition and Flame Spread Test Apparatus. Combustion Science and Technology 189, 231-247.
| Crossref | Google Scholar |
McArthur AG, Cheney NP (2015) The characterization of fires in relation to ecological studies. Fire Ecology 11, 3-9.
| Crossref | Google Scholar |
Meyn A, White PS, Buhk C, Jentsch A (2007) Environmental drivers of large, infrequent wildfires: the emerging conceptual model. Progress in Physical Geography: Earth and Environment 31, 287-312.
| Crossref | Google Scholar |
Mileyko Y, Edelsbrunner H, Price CA, Weitz JS (2012) Hierarchical Ordering of Reticular Networks. PLoS One 7, e36715.
| Crossref | Google Scholar | PubMed |
Miller TS, Filkov AI, Penman TD (2023) Improved laboratory method to test flammability metrics of live plants under dynamic conditions and future implications. Internaional Journal of Wildland Fire 32, 277-295.
| Crossref | Google Scholar |
Morandini F, Silvani X (2010) Experimental investigation of the physical mechanisms governing the spread of wildfires. International Journal of Wildland Fire 19, 570-582.
| Crossref | Google Scholar |
Murphy BP, Bradstock RA, Boer MM, Carter J, Cary GJ, Cochrane MA, Fensham RJ, Russell-Smith J, Williamson GJ, Bowman DMJS (2013) Fire regimes of Australia: a pyrogeographic model system. Journal of Biogeography 40, 1048-1058.
| Crossref | Google Scholar |
Murray BR, Hardstaff LK, Phillips ML (2013) Differences in Leaf Flammability, Leaf Traits and Flammability-Trait Relationships between Native and Exotic Plant Species of Dry Sclerophyll Forest. PLoS One 8, e79205.
| Crossref | Google Scholar | PubMed |
Murray BR, Brown C, Murray ML, Krix DW, Martin LJ, Hawthorne T, Wallace MI, Potvin SA, Webb JK (2020) An Integrated Approach to Identify Low-Flammability Plant Species for Green Firebreaks. Fire 3, 9.
| Crossref | Google Scholar |
Neary DG, Klopatek CC, DeBano LF, Ffolliott PF (1999) Fire effects on belowground sustainability: a review and synthesis. Forest Ecology and Management 122, 51-71.
| Crossref | Google Scholar |
Newberry BM, Power CR, Abreu RCR, Durigan G, Rossatto DR, Hoffmann WA (2020) Flammability thresholds or flammability gradients? Determinants of fire across savanna–forest transitions. New Phytologist 228, 910-921.
| Crossref | Google Scholar | PubMed |
Nyman P, Sherwin CB, Langhans C, Lane PNJ, Sheridan GJ (2014) Downscaling regional climate data to calculate the radiative index of dryness in complex terrain. Australian Meteorological and Oceanographic Journal 64, 109-122.
| Crossref | Google Scholar |
Pausas JG, Keeley JE (2014) Evolutionary ecology of resprouting and seeding in fire-prone ecosystems. New Phytologist 204, 55-65.
| Crossref | Google Scholar | PubMed |
Pausas JG, Keeley JE, Schwilk DW (2017) Flammability as an ecological and evolutionary driver. Journal of Ecology 105, 289-297.
| Crossref | Google Scholar |
Pérez-Harguindeguy N, Díaz S, Garnier E, Lavorel S, Poorter H, Jaureguiberry P, Bret-Harte MS, Cornwell WK, Craine JM, Gurvich DE, Urcelay C, Veneklaas EJ, Reich PB, Poorter L, Wright IJ, Ray P, Enrico L, Pausas JG, de Vos AC, Buchmann N, Funes G, Quétier F, Hodgson JG, Thompson K, Morgan HD, ter Steege H, Sack L, Blonder B, Poschlod P, Vaieretti MV, Conti G, Staver AC, Aquino S, Cornelissen JHC (2013) New handbook for standardised measurement of plant functional traits worldwide. Australian Journal of Botany 61, 167-234.
| Crossref | Google Scholar |
Poorter H, Niinemets Ü, Poorter L, Wright IJ, Villar R (2009) Causes and consequences of variation in leaf mass per area (LMA): a meta-analysis. New Phytologist 182, 565-588.
| Crossref | Google Scholar | PubMed |
Popović Z, Bojović S, Marković M, Cerdà A (2021) Tree species flammability based on plant traits: A synthesis. Science of the Total Environment 800, 149625.
| Crossref | Google Scholar | PubMed |
Prior LD, Murphy BP, Bowman DMJS (2018) Conceptualizing Ecological Flammability: An Experimental Test of Three Frameworks Using Various Types and Loads of Surface Fuels. Fire 1, 14.
| Crossref | Google Scholar |
Reville W (2023) psych: Procedures for Psychological, Psychometric, and Personality Research, version 2.3.6. Available at https://CRAN.R-project.org/package=psych
Santoni PA, Simeoni A, Rossi JL, Bosseur F, Morandini F, Silvani X, Balbi JH, Cancellieri D, Rossi L (2006) Instrumentation of wildland fire: Characterisation of a fire spreading through a Mediterranean shrub. Fire Safety Journal 41, 171-184.
| Crossref | Google Scholar |
Schwilk DW (2015) Dimensions of plant flammability. New Phytologist 206, 486-488.
| Crossref | Google Scholar | PubMed |
Simpson KJ, Ripley BS, Christin PA, Belcher CM, Lehmann CER, Thomas GH, Osborne CP (2016) Determinants of flammability in savanna grass species. Journal of Ecology 104, 138-148.
| Crossref | Google Scholar | PubMed |
Strahler AN (1957) Quantitative analysis of watershed geomorphology. EOS, American Geophysical Union 38, 913-920.
| Crossref | Google Scholar |
Tumino BJ, Duff TJ, Goodger JQD, Cawson JG (2019) Plant traits linked to field-scale flammability metrics in prescribed burns in Eucalyptus forest. PLoS One 14, e0221403.
| Crossref | Google Scholar | PubMed |
Urbanski SP (2013) Combustion efficiency and emission factors for wildfire-season fires in mixed conifer forests of the northern Rocky Mountains, US. Atmospheric Chemistry and Physics 13, 7241-7262.
| Crossref | Google Scholar |
Varner JM, Kane JM, Kreye JK, Engber E (2015) The Flammability of Forest and Woodland Litter: a Synthesis. Current Forestry Reports 1, 91-99.
| Crossref | Google Scholar |
Viedma O, Chico F, Fernández JJ, Madrigal C, Safford HD, Moreno JM (2020) Disentangling the role of prefire vegetation vs. burning conditions on fire severity in a large forest fire in SE Spain. Remote Sensing of Environment 247, 111891.
| Crossref | Google Scholar |
White RH, Zipperer WC (2010) Testing and classification of individual plants for fire behaviour: plant selection for the wildland-urban interface. International Journal of Wildland Fire 19, 213-227.
| Crossref | Google Scholar |
Wyse SV, Perry GLW, O’Connell DM, Holland PS, Wright MJ, Hosted CL, Whitelock SL, Geary IJ, Maurin KJL, Curran TJ (2016) A quantitative assessment of shoot flammability for 60 tree and shrub species supports rankings based on expert opinion. International Journal of Wildland Fire 25, 466-477.
| Crossref | Google Scholar |
Wyse SV, Perry GLW, Curran TJ (2018) Shoot-level flammability of species mixtures is driven by the most flammable species: Implications for vegetation-fire feedbacks favouring invasive species. Ecosystems 21, 886-900.
| Crossref | Google Scholar |