

[FeII(L•)2][TCNQF4•−]2: A Redox-Active Double Radical Salt
Ian A. Gass A B C , Jinzhen Lu A , Ruchika Ojha A , Mousa Asadi A , David W. Lupton A , Blaise L. Geoghegan B , Boujemaa Moubaraki A , Lisandra L. Martin A , Alan M. Bond A and Keith S. Murray A C
A School of Chemistry, Monash University, Clayton, Vic. 3800, Australia.
B School of Pharmacy and Biomolecular Sciences, University of Brighton, Brighton BN2 4GJ, UK.
C Corresponding authors. Email: i.gass@brighton.ac.uk; keith.murray@monash.edu
Australian Journal of Chemistry 72(10) 769-777 https://doi.org/10.1071/CH19175
Submitted: 17 April 2019 Accepted: 3 June 2019 Published: 19 July 2019
Abstract
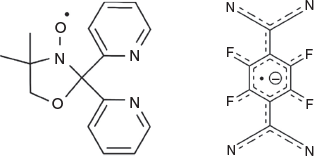
The reaction of [FeII(L•)2][BF4]2 with LiTCNQF4 results in the formation of [FeII(L•)2][TCNQF4•−]2·2CH3CN (1) (L• is the neutral aminoxyl radical ligand 4,4-dimethyl-2,2-di(2-pyridyl)oxazolidine-N-oxide; TCNQF4 is 2,3,5,6-tetrafluoro-7,7,8,8-tetracyanoquinodimethane). Single-crystal X-ray diffraction; Raman, Fourier-transform infrared (FTIR) and ultraviolet–visible spectroscopies; and electrochemical studies are all consistent with the presence of a low-spin FeII ion, the neutral radical form (L•) of the ligand, and the radical anion TCNQF4•−. 1 is largely diamagnetic and the electrochemistry shows five well-resolved, diffusion-controlled, reversible one-electron processes.
Introduction
Much of the initial interest in the interaction of metal ions and redox-active ligands stemmed from their biological relevance,[1] sparking an ongoing debate on the exact structure in the diamagnetic oxygen-binding proteins oxymyoglobin and oxyhaemoglobin. Weiss argued for a structure containing strong antiferromagnetic exchange between low-spin FeIII and a superoxide anion (FeIII/O2•−)[2] whereas Pauling advocated for a combination of low-spin FeII and singlet oxygen (FeII/O20).[3] Later studies, of course, revealed a more complex situation involving non-standard effective nuclear charges, spin polarization effects and partial metal character of ligand-based orbitals[4] but this example highlights the importance of characterizing such interactions fully and paying close attention to the electronic structure associated with the metal ion in such systems. Similarly, the active site of catechol dioxygenases, responsible for intra-diol cleavage, contains iron ions with the catecholate/o-quinone redox system[5–7] and the tyrosyl/tyrosinate redox pair is used in combination with manganese in Photosystem II,[8] copper in galactose oxidase,[9] and iron in ribonucleotide reductase.[10] The multielectron processes present in such metalloenzymes have molecular equivalents and are utilized in aerobic alcohol oxidation catalysts that are chemoselective and tolerant of the presence of other functional groups, and use atmospheric molecular oxygen as the oxidant.[11–13] Similar transition metal/redox-active ligand species can also potentially mimic the multielectron processes of the more expensive, and rarer, noble metals, offering a pathway to catalysts made out of cheaper and more abundant metals such as iron.[14] In addition to the bioinorganic perspective and catalysis work detailed above, our initial interest in these systems was spurred on by the ‘metal-radical’ approach pioneered by Gatteschi and coworkers,[15,16] with an emphasis on studying the effects of coordinated radicals on spin-crossover and single-molecule magnet behaviour.[17–22]
The recently reported redox congener pairs [MII(L•)2]2+/[MIII(L−)2]+ (M = Fe, Co and L− = reduced form of L•)[17–20] show multiple redox processes and can be easily converted between their two forms by either chemical or electrochemical means. They show a range of interesting physical behaviour including reductively induced oxidation, spin-crossover, and field-induced single-molecule magnet behaviour.[17–20] The switchable nature of these cations has led us to prepare a range of multifunctional materials using anions such as the [ReIVX6]2− anion (X = Cl, Br), which showed spin-canting behaviour in [NiII(L•)(H2O)3][ReIVCl6] and the only example to date of a single radical ligand (L•) coordinating facially around a central metal ion.[22]
Initial work on combining [FeII(L•)2](BF4)2[17] with the TCNQF42− anion resulted in the TCNQF42− anion acting as a reducing agent towards the [FeII(L•)2]2+ cation, converting it to [FeIII(L−)2]+ via a reductively induced oxidation process. The TCNQF42− dianion was subsequently oxidized to its anionic radical form, TCNQF4•−, which then crystallized as [FeIII(L−)2][TCNQF4•−].[23] To confirm our initial hypothesis that the TCNQF42− species was solely responsible for the reductively induced oxidation of [FeII(L•)2]2+, in the present work we performed a similar reaction using the monoanionic radical salt LiTCNQF4 instead of Li2TCNQF4. This should result in a simple salt metathesis replacing the two BF4− anions with two TCNQF4•− radical anions and generate a new related redox-active species. By addition of two equivalents of LiTCNQF4 in methanol to a solution of [FeII(L•)2][BF4]2,[17] predissolved in a mixture of acetonitrile and dichloromethane, crystalline product of [FeII(L•)2][TCNQF4•−]2·2CH3CN (1) was indeed obtained, in 69 % yield (Fig. 1).
|
Results and Discussion
Synthesis and Structure
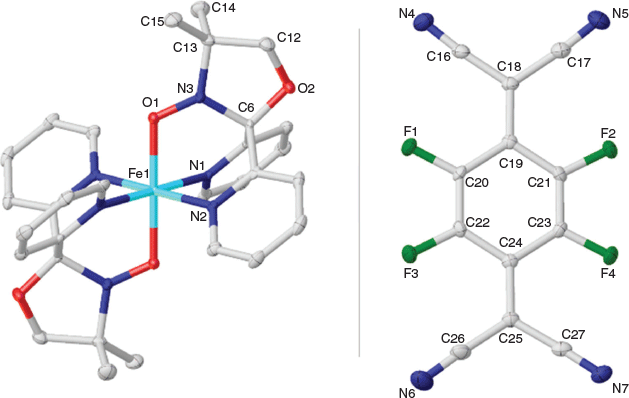
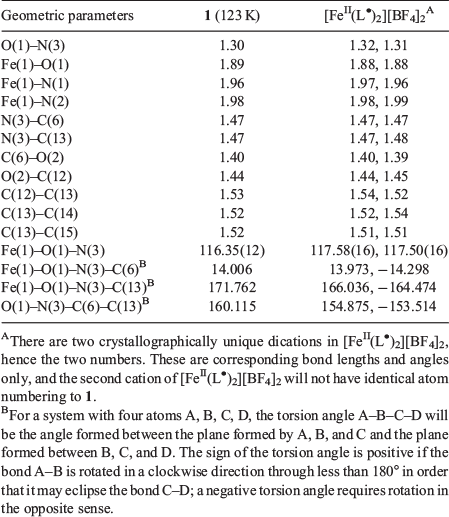
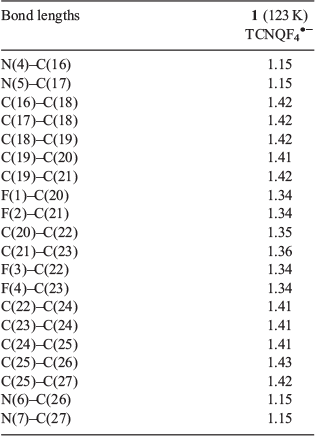
Complex 1 crystallizes in the monoclinic space group C2/c with the asymmetric unit containing half the [FeII(L•)2]2+ dication, one TCNQF4•− radical anion, and one solvate acetonitrile molecule (Figs 2 and 3). An inversion centre sits on the central iron ion in 1 that generates the [FeII(L•)2]2+ monocation, which is then charge-balanced by two TCNQF4•− radical anions and accompanied by two solvate acetonitriles as per the formula [FeII(L•)2][TCNQF4•−]2·2CH3CN (1). Relevant bond lengths and angles for the [FeII(L•)2]2+ dication, as well as a comparison with [FeII(L•)2][BF4]2 can be found in Table 1 and selected geometric parameters for the TCNQF4•− radical anions can be found in Table 2.
|
|
|
|
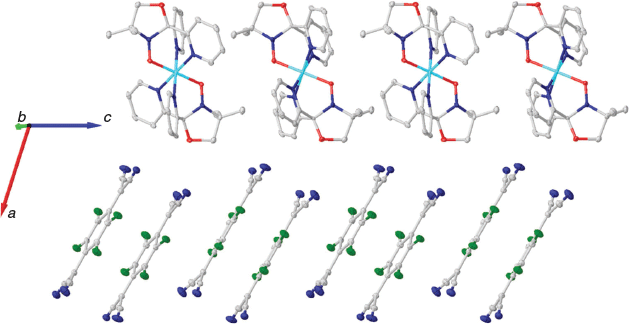
In 1, two tridentate nitroxide radical ligands coordinate to the central Fe ion axially via the oxygen and equatorially via the pyridyl nitrogen groups from each ligand, resulting in a distorted octahedral geometry with the following parameters: cis angles, 87.76(7)–92.24(7)°; trans angles, 180°; Fe–O 1.89 Å, Fe–N 1.96 and 1.98 Å (full bond lengths with errors can be found in the CIF file in the Supplementary Material). The intramolecular (L• to L•) distance in 1 is 5.20 Å. This intramolecular distance was between calculated centroids of the nitroxide N–O group. In 1, there are two TCNQF4•− radical anions present, in dimeric form, per [FeII(L•)2]2+ dication (Figs 2 and 3).
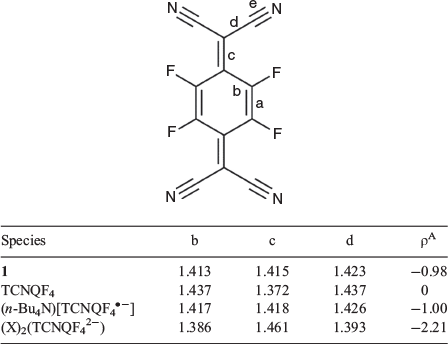
Assigning the oxidation and spin states of the [FeII(L•)2]2+ dication and confirmation of both the [TCNQF4]•− radical anion and the neutral radical form of the ligand L• are well established and rely on a rigorous examination of the bond lengths and angles in both the cation[17–23] and anion[24–26] (Tables 1–3). The nitroxide N–O (N3–O1) bond length is 1.30 Å in 1, which strongly suggests the ligand (L•) is in the neutral radical form as found previously when relating nitroxide bond lengths to the redox form of the NO group.[17–23] Equally, the Fe–O (1.89 Å) and Fe–N (1.96 and 1.98 Å) bond lengths are indicative of a central low-spin FeII ion. If we look at the geometry around N3, then this reveals a small deviation from the plane formed by O1–C6–C13 (Table 1). This is expected considering the resonance forms of the neutral radical form of the ligand (L•) where we do not have a localized lone pair on N3 and hence would expect a trigonal planar arrangement around N3. This is in comparison with the trigonal pyramidal geometry found when the ligand is in the hydroxylamino anionic form L−.[23] The cationic species in 1 are therefore assigned as [FeII(L•)2]2+ where the FeII ion is in the low-spin state. From charge balance considerations alone, then the TCNQF4 species in 1 must be the TCNQF4•− radical anion given that 1 has two TCNQF4 moieties as anions. As the charge of the TCNQF4 moiety increases, the bond length labelled c (Table 3) increases in length while b and d decrease in length. The charge transfer degree of the TCNQF4 moiety (ρ) can then be calculated by the Kistenmacher relationship (Table 3). The calculated ρ values are −0.98 for 1, suggesting that TCNQF4 moieties in 1 are TCNQF4•− radical anions. This leads to the assignment of 1 as [FeII(L•)2][TCNQF4•−]2·2CH3CN.
|
1 consists of alternating layers of [FeII(L•)2]2+ cations and pairs of eclipsed TCNQF4•− radical anions (Fig. 3) with an interplanar distance of 3.28 Å (based on the distance between calculated centroids of the planes of the six-membered ring of the TCNQF4•− radical anion). No significant intermolecular interactions were found anywhere else in the structure and the shortest intermolecular distances are 7.86 Å (Fe to Fe), 5.20 Å (L• to L•), and 6.32 Å (Fe to L•), where distances were based on calculated centroids of the nitroxide N–O group. The solvate acetonitrile groups are not involved in any significant intermolecular interactions, with the acetonitrile orientated parallel to the pyridine ring of the ligand associated with N2 (Figs S1 and S2, Supplementary Material).
Raman and FTIR Spectroscopy
Raman and infrared spectroscopic studies can be used to confirm the assignment of the TCNQF4•− radical anion in 1.[26,28] In Raman spectroscopy, the most important diagnostic stretch is the C≡N stretch, which occurs at 2226 cm−1 for neutral TCNQF40, and this occurs at 2220 cm−1 in 1 (Fig. S3, Supplementary Material). We would expect the C≡N to shift to lower energies in the TCNQF4•− radical anion compared with neutral TCNQF40, which is consistent with LiTCNQF4 whose C≡N band is at 2223 cm−1 (Fig. S4, Supplementary Material). Additional diagnostic modes in the Raman spectra are: the ring C=C stretch at 1643 cm−1, which is consistent with the TCNQF4•− radical anion, and the exocyclic C=C stretch, which is expected at ~1445 cm−1 but is either absent or significantly shifted to 1392 cm−1 in 1. The FTIR spectrum for 1 is shown in Fig. S5 (Supplementary Material), with two C≡N stretches observed at 2194 and 2173 cm−1, again shifted to lower wavenumbers than those found in neutral TCNQF40 (2225 cm−1).[26] Further diagnostic modes in the infrared spectra can be found at: 1536 cm−1, corresponding to a ring C=C stretch; 1505 cm−1, corresponding to an exocyclic C=C stretch, and 1346 cm−1, corresponding to a C–F and ring C–C stretch. Overall, the diagnostic modes detailed above are characteristic of the TCNQF4•− radical anion. A full treatment of the vibrational spectroscopy of different redox forms of TCNQF4 has been reported previously.[28]
Magnetic Studies
Direct current (DC) molar magnetic susceptibility measurements (χMT versus T plots) were performed on crystals of 1 in the 2–300 K range under an applied field of 0.1 T (Fig. S6, Supplementary Material). Complex 1 has only small residual χMT values ranging from 0.08 cm3 mol−1 K at 300 K to 0.07 cm3 mol−1 K at 2 K. The previously reported[17] [FeII(L•)2]2+ dicationic complex showed strong radical–radical antiferromagnetic interactions mediated by the Fe2+ centre resulting in a spin ground state S = 0, and stacked pairs of eclipsed TCNQF4•− radical anions are known to exhibit strong antiferromagnetic interactions.[29] A comparison of the χMT versus T plots for 1 and [FeII(L•)2][BF4]2 shows a similar profile above 150 K (Fig. S7, Supplementary Material) and the bond lengths and angles of the [FeII(L•)2]2+ dication in 1 are similar to that observed in [FeII(L•)2][BF4]2 (Table 2). It is reasonable to suggest that a similar radical–radical antiferromagnetic interaction occurs in the [FeII(L•)2]2+ dication in 1 although the shallower slope of the χMT versus T plot (Figs S7 and S8, Supplementary Material) suggests a slightly stronger antiferromagnetic interaction in 1 compared with that seen in [FeII(L•)2][BF4]2. Using the program PHI,[30] a reasonable simulation of the data in 1 from 150 to 300 K was calculated using an S = 1/2 dimer model with the isotropic spin Hamiltonian Ĥ = −2JŜ1·Ŝ2 and parameters g = 2.00 and J = −380 cm−1 where Ŝ1 and Ŝ2 are the spin operators for the two radicals in the [FeII(L•)2]2+ cation, g is the isotropic g-factor and J is the magnetic exchange between the two radicals (Fig. S8, Supplementary Material). This is slightly stronger than the equivalent interaction in [FeII(L•)2][BF4]2 (J = −315 cm−1) but is consistent with the overall expectation of a large radical–radical antiferromagnetic interaction between the two radical ligands mediated by the central and low-spin FeII ion. This seems reasonable but this analysis is dependent on the assumption that the pairs of eclipsed TCNQF4•– radical anions are so strongly coupled that their contribution to the χMT versus T plot is negligible across the temperature range studied. This appears to be the case for the data above 150 K, but there is a small increase in χMT values from 150 to 2 K resulting in a final value of 0.07 cm3 mol−1 K at 2 K (Figs S6–S8, Supplementary Material), the origin of which is clearly not from the [FeII(L•)2]2+ dication, the TCNQF4•− radical anions or any temperature-independent paramagnetism (TIP). In [FeII(L•)2][BF4]2,[17] there was evidence of the presence of 5 % of a species containing low-spin FeIII and a neutral radical ligand, likely to be the [FeIII(L•)(L−)]2+ dication. It is possible that the χMT values below 150 K are simply the result of either intramolecular or intermolecular interactions of this minor, or related, species. Overall, and noting the data below 150 K, the observed χMT versus T plot is therefore reasonable given the assignment of 1 as [FeII(L•)2][TCNQF4•−]2·2CH3CN.
Solution-Phase Studies on Dissolved Solid [FeII(L•)2][TCNQF4•−]2
UV-Vis Studies
The solid-state studies above show that the crystallography, microanalysis, and Raman and FTIR spectroscopies are consistent with the assignment of 1 as [FeII(L•)2][TCNQF4•−]2·2CH3CN where the central FeII ion is low spin, the ligands are in the neutral radical form (L•), and we have two eclipsed TCNQF4•− radical anions. Solution studies for 1 were undertaken in acetonitrile (~0.1 mM) with the UV-vis spectra shown in Fig. S9 (Supplementary Material) showing two intense absorption bands with λmax at 411 and 753 nm, which are characteristic for the TCNQF4•− radical anion,[26] and a minor absorption band at 247 nm was observed corresponding to the neutral radical form (L•) of the ligand (Fig. S10, Supplementary Material). This confirms that the solid-state structure and subsequent redox levels of the cation and anion remain intact in solution.
Electrochemistry
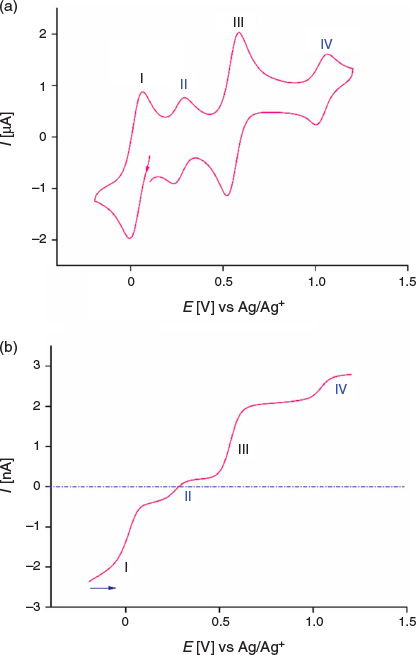
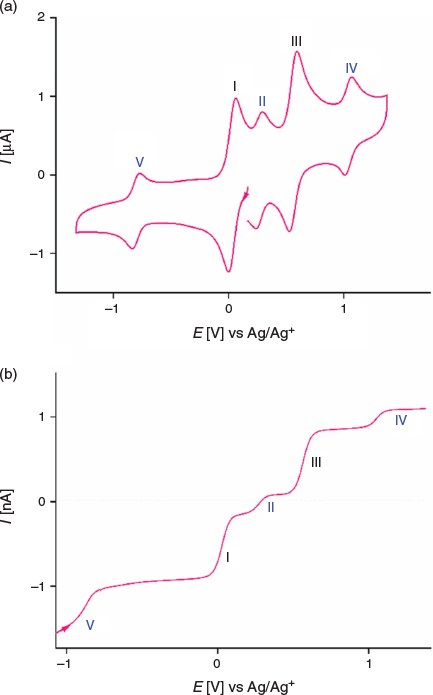
The dissolution of 1 in acetonitrile gives an emerald green solution. A transient cyclic voltammogram of a 0.35 mM solution of 1 at a glassy carbon (GC) macrodisc electrode (area 0.00787 cm2) in acetonitrile (0.1 M Bu4NPF6) at a scan rate of 100 mV s−1 over the potential range of −0.2 to 1.2 V versus Ag/AgCl exhibits four well-resolved, diffusion-controlled one-electron processes labelled I to IV in Fig. 4a. The magnitudes of the peak currents for processes I and III are similar and approximately double those observed for processes II and IV. The cyclic voltammetric data for processes I–IV as a function of scan rate are presented in Table S1 and Fig. S11 (Supplementary Material).
|
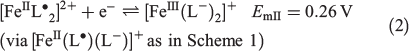
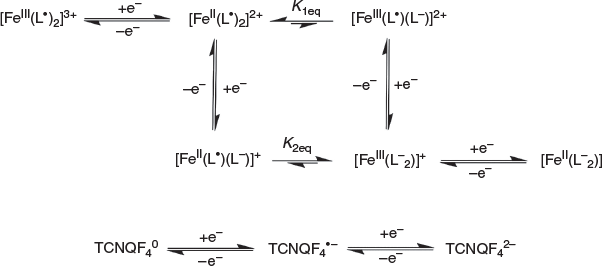
Cyclic voltammetric data have been reported for [FeIII(L−)2][TCNQF4•−][23] and [FeII(L•)2](BF4)[17] and on this basis, processes I and III are assigned to reduction of the TCNQF4•− anion to TCNQF42− and its oxidation to TCNQF40 respectively. Processes II and IV arise from the oxidation and reduction reactions respectively of the nitroxide-based cation [FeII(L•)2]2+. The midpoint potentials (Em = (Epox + Epred)/2) for each process I to IV are EmI = 0.03 V, EmII = 0.26 V, EmIII = 0.55 V, and EmIV = 1.03 V versus Ag/Ag+. The peak-to-peak separation ΔEp (ΔEp = Epox − Epred) values are close to theoretically predicted values of 56 mV anticipated for one-electron electrochemically reversible couple at 23°C.[31] A steady-state voltammogram of 1 obtained at a Pt microdisc electrode over the potential range of −0.3 to +1.5 V versus Ag/Ag+ is shown in Fig. 4b. The current for each process relative to the zero current value is highlighted in this figure. The magnitudes of the currents for processes I and III are similar to each other and close to twice those of processes II and III. The half-wave potential (E1/2) values for the processes I to IV are identical to the midpoint potential values within experimental uncertainty. As the current for process I is negative, this is assigned to the reduction of TCNQF4•− to TCNQF42− as shown in Eqn 1. The zero current passes through process II, but the latter is predominantly a reduction current. Thus, this process corresponds to the reduction of [FeII(L•)2]2+ to the mixed-valence [FeII(L•)(L−)]+ species, which can undergo metal–ligand charge transfer to give the thermodynamically more stable [FeIII(L−)2]+ species.[17,23] The positive component of the process II current


suggests that a small amount of this reduced species [FeIII(L−)2]+ is present in the solution, which gives rise to an oxidation current to give [FeII(L•)2]2+. The origin of [FeIII(L−)2]+ present in the bulk solution is possibly due to reaction of [FeII(L•)2]2+ with water, light or an unknown reductant, but the solution can be fully reduced to [FeIII(L−)2]+ by bulk electrolysis at the appropriate potential (see below). The redox reactions associated with process II are consistent with the square scheme shown in Scheme 1. Process III exhibits a positive current that corresponds to the one-electron oxidation of TCNQF4•− to TCNQF40 as shown in Eqn 3. On the basis of the previous studies, process IV is assigned to the metal-based oxidation of [FeII(L•)2]2+ to [FeIII(L•)2]3+ as shown in Eqn 4.
|
An investigation of the more negative potential region revealed a further reduction process V with EmV = −0.81 V versus Ag/Ag+ as shown in the transient cyclic voltammogram in Fig. 5a and the steady-state voltammogram in Fig. 5b. Process V is an electrochemically reversible one-electron reduction corresponding to the reduction of the [FeIII(L−)2]+ cation to neutral [FeII(L−)2], as shown in Eqn 5. This process is consistent with the one reported at a similar potential in the electrochemical study of [FeII(L•)2][BF4]2.[17]
|

Complete removal of dissolved oxygen is required for the detection of process V. In a previous study, two other reduction processes, labelled VI and VII were reported in the Supplementary Material for [FeIII(L−)2][TCNQF4•−];[23] however, these have now been shown to arise from the presence of dissolved oxygen.
After taking all the redox processes into account, the overall reaction pathway associated with the electrochemical behaviour of 1 can be summarized in Scheme 1.
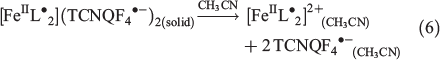
The ratio of close to 2 : 1 for the magnitudes of the peak and steady-state limiting currents for processes (I and II) : (II, IV, and V) in the voltammetry of 1 is consistent with dissociation of the complex on dissolution in CH3CN as shown in Eqn 6.
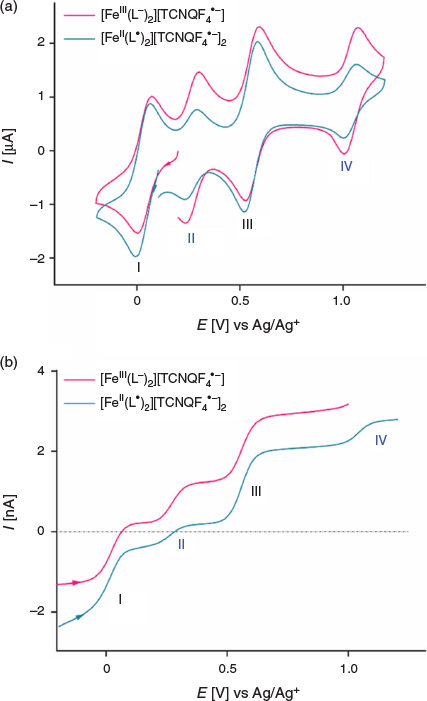
A Comparison of the Voltammetry of [FeIII(L−)2][TCNQF4•−][23] and [FeII(L•)2][TCNQF4•−]2 (1)
A comparison of transient and steady-state voltammograms of [FeIII(L−)2][TCNQF4•−] and [FeII(L•)2][TCNQF4•−]2 is shown in Fig. 6a, b. Clearly, in [FeII(L•)2][TCNQF4•−]2 the relative concentration of TCNQF4•− is twice that found in [FeIII(L−)2][TCNQF4•−] and this is reflected in the relative peak magnitudes of the processes I and III versus II and IV. Except for this feature, the transient cyclic voltammograms are very similar for the dissolved forms of each compound. However, interestingly, the position of process II relative to the zero current differs in the steady-state voltammograms for each compound and this reflects the difference in their redox states, as shown in Fig. 6b. Chemical synthesis gave a mixture of both cations as identified by the location of the zero current with respect to process II. Thus, as anticipated depending on the relative concentrations of [FeII(L•)2]2+ and [FeIII(L−)2]+, a slight deviation in the position of zero current is observed with respect to process II (see Fig. 6b). If we had pure [FeIII(L−)2]+, it would be predicted to give only oxidation current and, similarly, pure [FeII(L•)2]2+ would only show a reduction current. This situation can be achieved by applying an appropriate potential under bulk electrolysis conditions (0.157 and 0.437 V versus Ag/Ag+ respectively) to the emerald green-coloured solution of [FeII(L•)2][TCNQF4•−]2 as shown in Fig. S12 (Supplementary Material). No change in the solution colour was observed after either bulk electrolysis experiment. Indeed, a solution of only [FeIII(L−)2]+ generates fully oxidation current with regard to process II to give [FeII(L•)2]2+. Conversely, after bulk reductive electrolysis to give only [FeII(L•)2]2+ cation in solution, the small oxidation current component seen in process II and attributed to the presence of some [FeIII(L−)2]+ in the bulk solution, as shown in Fig. 4b, is now removed. As expected, processes I, III, IV, and V remain intact after such oxidative or reductive bulk electrolysis experiments.
|
Nevertheless, during these bulk electrolysis experiments, it was noted that the position where zero current passes through process II is slightly dependent on the direction of the scan and also the initial potential. This is attributed to the influence of the thermodynamically favoured cross redox reactions that can occur. For example, when the initial potential is set at −0.2 V versus Ag/Ag+, TCNQF42− is generated.
Conclusion
Previous work on reacting [FeII(L•)2][BF4]2 with Li2TCNQF4 resulted in [FeIII(L−)2][TCNQF4•−] where TCNQF42− was oxidized to the TCNQF4•− radical anion and in the process converted [FeII(L•)2]2+ to [FeIII(L−)2]+ via a reductively induced oxidation process.[23] In the present work, we have sought confirmation of the hypothesis that the TCNQF42− anion is solely responsible for the above redox process by investigating the related reaction involving LiTCQNF4 instead of Li2TCNQF4. The central idea is that by using LiTCNQF4 in a similar reaction to that used above, the two BF4 anions in [FeII(L•)2][BF4]2 should simply be replaced by two TCNQF4•− radical anions in a metathesis reaction resulting in a new but related material. Single-crystal X-ray diffraction measurements, Raman, FTIR, and UV-vis spectroscopy studies, and solution-based electrochemistry confirmed that the metathesis had taken place, resulting in the formation of [FeII(L•)2][TCNQF4•−]2·2CH3CN (1). The data above are self-consistent and appropriate for the assignment of a central low-spin FeII ion, the neutral radical form (L•) of the ligand, and the presence of the radical anion TCNQF4•−. The strong antiferromagnetic exchange between the two radical ligands and between stacked pairs of eclipsed TCNQF4•− radical anions results in a largely diamagnetic material but one that shows rich electrochemistry with five one-electron, reversible, well-resolved, diffusion-controlled processes. This highlights the utility of the different redox forms of TCNQF4 in inorganic synthesis and in the preparation of redox-active multifunctional materials.
Experimental
General Considerations
[FeII(L•)2][BF4]2 and 4,4-dimethyl-2,2-di(2-pyridyl) oxazolidine N-oxide (L•) were synthesized as described previously.[17] LiTCNQF4 was prepared according to a literature method.[32] All other reagents and solvents were of reagent grade and used as received. Microanalysis was performed by Medac Ltd.
Synthesis
[FeII(L•)2][TCNQF4•−]2·2CH3CN (1)
[FeII(L•)2][BF4]2 (10 mg, 0.013 mmol) was dissolved in a mixture of 2.5 mL acetonitrile and 0.5 mL dichloromethane. Then, 1.0 mL of a methanolic solution containing 7.3 mg (0.026 mmol) of LiTCNQF4 was added and this mixture left open to the air to crystallize. X-ray-quality dark green crystals formed after 5 days in reasonable yield. Yield: 11 mg (69.0 %). Anal. Calc. (%) for 1, C58H38N16O4F8Fe ([FeII(L•)2][TCNQF4•−]2·2CH3CN): C 56.6, H 3.11, N 18.21. Found: C 56.01, H 3.22, N 18.10 %. νmax (IR)/cm−1 2194s, 2173s, 1640w, 1611s, 1536m, 1505w, 1487s, 1470m, 1446w, 1390s, 1346w, 1335w, 1317w, 1302w, 1280w, 1240s, 1200w, 1159w, 1141w, 1084s, 1031w, 1009w, 999w, 980m, 968s, 928w, 908w, 881w, 831w, 771s, 713w, 674w, 654m (Fig. S1, Supplementary Material). For Raman spectra, see Fig. S2 (Supplementary Material).
X-Ray Crystallography
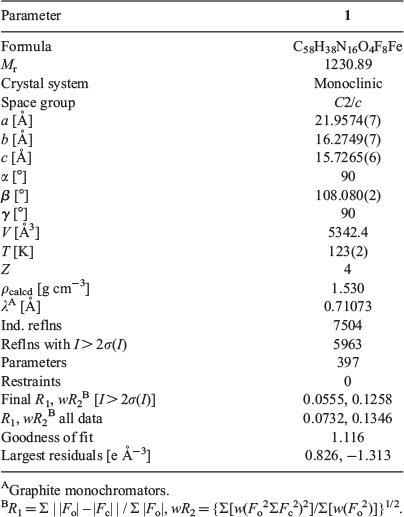
X-ray crystallographic measurements were performed on 1 at 123(2) K using a Bruker Smart Apex X8 diffractometer with Mo-Kα radiation (λ 0.7107 Å). Single crystals were mounted on a glass fibre with refinement parameters and crystallographic data found in Table 4. The solution was obtained by direct methods (SHELXS-97), and refined (SHELXL-97) by full least-squares on all F2 data.[33] In 1, the asymmetric unit contains half the iron monomer, one TCNQF4•− monoanion, and one solvate acetonitrile molecule. All non-hydrogen atoms were refined anisotropically and all hydrogens placed in calculated positions. Full crystallographic data and selected bond lengths and angles can be found in Table 4 and Table 1 (the Cambridge Crystallographic Data Centre (CCDC) deposition number is 1508568).
|
Electrochemistry
A three-electrode electrochemical cell was used to perform the electrochemical experiments at ambient temperatures of 23 ± 2°C with a Bioanalytical Systems BASi Epsilon-EC electrochemical workstation. A GC macrodisc electrode (area 0.00787 cm2) or a platinum (Pt) microelectrode (10 µm diameter) were employed as the working electrodes, along with Ag/Ag+ (Ag wire in contact with acetonitrile containing 0.1 M AgNO3 and 0.1 M Bu4NPF6) as the standard reference electrode and platinum wire as the counter-electrode in voltammetric studies. The Ag/Ag+ (0.1 M AgNO3) reference electrode had a potential of 0.366 V versus Fc0/+ (Fc = Ferrocene). Bulk electrolysis experiments were performed with a three-electrode cell with a large-area Pt mesh working electrode, Pt gauze as the counter electrode, and an Ag/Ag+ reference electrode (as described above) with each compartment separated by a glass frit. All solutions were degassed with nitrogen for 10 min before undertaking electrochemical experiments.
Infrared and Raman Spectroscopy
FTIR spectra were recorded using a Spectrac Diamond attenuated total reflection (ATR) instrument. Raman spectra were acquired with a Renishaw Raman RM2000 spectrometer and microscope using a laser strength of 18 mW at a wavelength of 514 nm.
Magnetic Susceptibility Measurements
Variable-temperature magnetic susceptibility measurements were performed on a Quantum Design MPMS 7T SQUID magnetometer over the temperature range 2–300 K for 1 in an applied DC field of 0.1 T. The SQUID magnetometer was calibrated by use of a standard palladium sample (Quantum Design) of accurately known magnetization or by use of magnetochemical calibrants such as CuSO4·5H2O. Crystals of 1 were collected and these were dispersed in Vaseline in order to avoid torqueing. The sample mulls were contained in a calibrated capsule held at the centre of a drinking straw that was fixed at the end of the sample rod.
Supplementary Material
Molecular structure (Fig. S1) and packing figures (Fig. S2); Raman (Figs S3 and S4) and FTIR spectra (Fig. S5); χMT versus T plots (Figs S6–S8); UV-vis spectra (Figs S9 and S10); cyclic voltammetric data at various scan rates (Table S1 and Fig. S11); and steady-state voltammetric data (Fig. S12) are available on the Journal’s website.
Conflicts of Interest
The authors declare no conflicts of interest.
Acknowledgements
K.S.M. thanks the Australian Research Council for a Discovery grant DP 140101013. L.L.M. and A.M.B. thank the Australian Research Council for Discovery grants DP120101066 and DP170103477. I.A.G. thanks the University of Brighton for the Output Enhancement Fund.
References
[1] W. Kaim, B. Schwederski, Coord. Chem. Rev. 2010, 254, 1580.| Crossref | GoogleScholarGoogle Scholar |
[2] J. J. Weiss, Nature 1964, 202, 83.
| Crossref | GoogleScholarGoogle Scholar | 14166723PubMed |
[3] L. Pauling, Nature 1964, 203, 182.
| Crossref | GoogleScholarGoogle Scholar |
[4] K. L. Bren, R. Eisenberg, H. B. Gray, Proc. Natl. Acad. Sci. USA 2015, 112, 13123.
| Crossref | GoogleScholarGoogle Scholar | 26508205PubMed |
[5] T. Borowski, P. E. M. Siegbahn, J. Am. Chem. Soc. 2006, 128, 12941.
| Crossref | GoogleScholarGoogle Scholar | 17002391PubMed |
[6] M. Y. M. Pau, M. I. Davis, A. M. Orville, J. D. Lipscomb, E. I. Solomon, J. Am. Chem. Soc. 2007, 129, 1944.
| Crossref | GoogleScholarGoogle Scholar |
[7] K. D. Sutherlin, Y. Wasada-Tsutsui, M. M. Mbughuni, M. S. Rogers, K. Park, L. V. Liu, Y. Kwak, M. Srnec, L. H. Böttger, M. Frenette, Y. Yoda, Y. Kobayashi, M. Kurokuzu, M. Saito, M. Seto, M. Hu, J. Zhao, E. E. Alp, J. D. Lipscomb, E. I. Solomon, J. Am. Chem. Soc. 2018, 140, 16495.
| Crossref | GoogleScholarGoogle Scholar | 30418018PubMed |
[8] A. W. Rutherford, A. Boussac, P. Faller, Biochim. Biophys. Acta 2004, 1655, 222.
| Crossref | GoogleScholarGoogle Scholar | 15100035PubMed |
[9] R. E. Cowley, J. Cirera, M. F. Qayyum, D. Rokhsana, B. Hedman, K. O. Hodgson, D. M. Dooley, E. I. Solomon, J. Am. Chem. Soc. 2016, 138, 13219.
| Crossref | GoogleScholarGoogle Scholar | 27626829PubMed |
[10] B. L. Greene, A. T. Taguchi, J. Stubbe, D. G. Nocera, J. Am. Chem. Soc. 2017, 139, 16657.
| Crossref | GoogleScholarGoogle Scholar | 29037038PubMed |
[11] C. J. Gartshore, D. W. Lupton, Adv. Synth. Catal. 2010, 352, 3321.
| Crossref | GoogleScholarGoogle Scholar |
[12] Q. Cao, L. M. Dornan, L. Rogan, N. L. Hughes, M. J. Muldoon, Chem. Commun. 2014, 4524.
| Crossref | GoogleScholarGoogle Scholar |
[13] B. L. Ryland, S. S. Stahl, Angew. Chem. Int. Ed. 2014, 53, 8824.
| Crossref | GoogleScholarGoogle Scholar |
[14] P. J. Chirik, K. Wieghardt, Science 2010, 327, 794.
| Crossref | GoogleScholarGoogle Scholar | 20150476PubMed |
[15] A. Caneschi, D. Gatteschi, R. Sessoli, P. Rey, Acc. Chem. Res. 1989, 22, 392.
| Crossref | GoogleScholarGoogle Scholar |
[16] A. Caneschi, D. Gatteschi, P. Rey, Prog. Inorg. Chem. 1991, 39, 331.
| Crossref | GoogleScholarGoogle Scholar |
[17] I. A. Gass, C. J. Gartshore, D. W. Lupton, B. Moubaraki, A. Nafady, A. M. Bond, J. F. Boas, J. D. Cashion, C. Milsmann, K. Wieghardt, K. S. Murray, Inorg. Chem. 2011, 50, 3052.
| Crossref | GoogleScholarGoogle Scholar | 21384832PubMed |
[18] I. A. Gass, S. Tewary, A. Nafady, N. F. Chilton, C. J. Gartshore, M. Asadi, D. W. Lupton, B. Moubaraki, A. M. Bond, J. F. Boas, S. X. Guo, G. Rajaraman, K. S. Murray, Inorg. Chem. 2013, 52, 7557.
| Crossref | GoogleScholarGoogle Scholar | 23777336PubMed |
[19] S. Tewary, I. A. Gass, K. S. Murray, G. Rajaraman, Eur. J. Inorg. Chem. 2013, 1024.
| Crossref | GoogleScholarGoogle Scholar |
[20] I. A. Gass, S. Tewary, G. Rajaraman, M. Asadi, D. W. Lupton, B. Moubaraki, G. Chastanet, J.-F. Létard, K. S. Murray, Inorg. Chem. 2014, 53, 5055.
| Crossref | GoogleScholarGoogle Scholar | 24805925PubMed |
[21] I. A. Gass, M. Asadi, D. W. Lupton, B. Moubaraki, A. M. Bond, S.-X. Guo, K. S. Murray, Aust. J. Chem. 2014, 67, 1618.
| Crossref | GoogleScholarGoogle Scholar |
[22] A. H. Pedersen, B. L. Geoghegan, G. S. Nichol, D. W. Lupton, K. S. Murray, J. Martínez-Lillo, I. A. Gass, E. K. Brechin, Dalton Trans. 2017, 5250.
| Crossref | GoogleScholarGoogle Scholar | 28374882PubMed |
[23] I. A. Gass, J. Lu, M. Asadi, D. W. Lupton, C. M. Forsyth, B. L. Geoghegan, B. Moubaraki, J. D. Cashion, L. L. Martin, A. M. Bond, K. S. Murray, ChemPlusChem 2018, 83, 658.
| Crossref | GoogleScholarGoogle Scholar |
[24] T. J. Emge, M. Maxfield, D. O. Cowan, T. J. Kistenmacher, Mol. Cryst. Liq. Cryst. 1981, 65, 161.
| Crossref | GoogleScholarGoogle Scholar |
[25] S. A. O’Kane, R. Clérac, H. Zhao, X. Ouyang, J. R. Galán-Mascarós, R. Heintz, K. R. Dunbar, J. Solid State Chem. 2000, 152, 159.
| Crossref | GoogleScholarGoogle Scholar |
[26] T. H. Le, J. Lu, A. M. Bond, L. L. Martin, Inorg. Chim. Acta 2013, 395, 252.
| Crossref | GoogleScholarGoogle Scholar |
[27] A. L. Sutton, B. F. Abrahams, D. M. D’Alessandro, R. W. Elliott, T. A. Hudson, R. Robson, P. M. Usov, CrystEngComm 2014, 16, 5234.
| Crossref | GoogleScholarGoogle Scholar |
[28] N. L. Haworth, J. Lu, N. Vo, T. H. Le, C. D. Thompson, A. M. Bond, L. L. Martin, ChemPlusChem 2014, 79, 962.
| Crossref | GoogleScholarGoogle Scholar |
[29] P. J. Kunkeler, P. J. van Koningsbruggen, J. P. Cornelissen, A. N. van der Horst, A. M. van der Kraan, A. L. Spek, J. G. Haasnoot, J. Reedijk, J. Am. Chem. Soc. 1996, 118, 2190.
| Crossref | GoogleScholarGoogle Scholar |
[30] N. F. Chilton, R. P. Anderson, L. D. Turner, A. Soncini, K. S. Murray, J. Comput. Chem. 2013, 34, 1164.
| Crossref | GoogleScholarGoogle Scholar | 23386394PubMed |
[31] A. J. Bard, R. L. Faulkner, Electrochemical Methods: Fundamentals and Applications (2nd edn) 2001 (John Wiley & Sons: New York, NY).
[32] J. Lu, T. H. Le, D. A. K. Traore, M. Wilce, A. M. Bond, L. L. Martin, J. Org. Chem. 2012, 77, 10568.
| Crossref | GoogleScholarGoogle Scholar | 23153174PubMed |
[33] G. M. Sheldrick, SHELX-97, Program for the Solution and Refinement of Crystal Structures 1997 (University of Göttingen: Göttingen, Germany).