
Classic and innovative trend analysis of long term annual precipitation in Argentina
María Paula Llano A B *
A B *
A
B
Abstract
Studying rainfall trends is essential for anticipating the effects of climate change, as rainfall behaviour has a direct impact on many sectors and aspects of human and environmental life. This study presents the results of an investigation into precipitation variability in Argentina, using data from 49 stations across the country. Long-term rainfall trends were analysed using the Mann–Kendall (MK) test and the innovative trend analysis (ITA) method for annual rainfall series from 1959 to 2020. The ITA method demonstrated superior visual capabilities for identifying trends through graphical representations. The findings indicate an overall increase in precipitation during this period, with a mean of 2 mm year–1 and a maximum of 6 mm year–1. Specifically, the ITA method revealed more stations with significant trends otherwise obscured when using one of the traditional methods. The ITA method allows the analysis of changes in precipitation by separating them according to percentiles. The highest precipitation values (fourth quartile) show a significant, mainly positive trend at half of the stations studied, with changes of 12% on average. However, the most extreme cases of increase or decrease are found at the lowest levels (first quartile), with changes of up to 50%. In conclusion, the graphical method provides a complementary perspective for easily identifying trends alongside traditional methods.
Keywords: Argentina, climate change, graphical methods, innovative trend analysis, Mann–Kendall test, monotonic trend, non-monotonic trend, precipitation.
1.Introduction
Investigating temporal variations in observed precipitation is critical for making reliable predictions of future climate changes (Zhang et al. 2019). Therefore, any study of precipitation variability has both scientific and social significance. Precipitation variability is closely linked to extreme events like droughts and floods, and directly affects the economy, water resource management and other critical sectors (Zamani et al. 2018). Argentina spans a vast territory with diverse climates and significant variability in precipitation patterns. Many regional economies, including agriculture, livestock and tourism, rely heavily on these precipitation patterns, either directly or indirectly, making them particularly vulnerable to changes in precipitation variability.
According to the Intergovernmental Panel on Climate Change (IPCC) report (Arias et al. 2021), most regions with good observational coverage have experienced an increase in both the intensity and frequency of extreme precipitation events since 1950.
Many scientific studies focus on analysing trends in precipitation at various temporal scales (annual, seasonal, monthly) using parametric or non-parametric methodologies. Among the parametric methods, linear regression is commonly used (Guo et al. 2020), whereas the most widely employed non-parametric method is the Mann–Kendall (MK) test (Mann 1945; Kendall 1962). For example, Peña-Angulo et al. (2020) applied the MK test to a long precipitation series in south-western Europe. Yetik et al. (2024) utilised MK tests to detect possible trends in precipitation in Turkey. Recently, new methods have been employed to analyse trends. Among these, the innovative trend analysis (ITA) method stands out for its straightforward and intuitive approach (Şen 2012), can be implemented irrespective of distribution assumptions, and effectively identifies trends within different sub-categories (Birpinar et al. 2023). One of the main advantages of this methodology is the identification of non-monotonic trends (low and high values that have different positive or negative trend directions in a time series) (Alashan 2024).
The ITA method has been applied worldwide. For example, Caloiero et al. (2018) studied temporal rainfall variability in southern Italy, whereas Gedefaw et al. (2018) and Kavwenje et al. (2023) examined precipitation trends in different African regions. Alashan (2020) adapted the ITA method with a logarithmic scale to analyse monthly temperature series in England. Benzater et al. (2024) observed an increase in the frequency of monthly maximum rainfall in Vietnam’s Vu Gia-Thu Bon River Basin. In an analogous study, Ashraf et al. (2023) employed the ITA method to analyse hydrological droughts, finding that it effectively visualised trends for low, medium and high values of the Standard Drought Index (SDI). In a recent study, Hallouz et al. (2024) employed these methodologies to examine hydro-meteorological variables in the Wadi Mina Basin, located in the north-western region of Algeria.
Some studies use several different methodologies, including the ones used in the present study: MK and ITA. Dong et al. (2020) conducted a comparative analysis of temperature and precipitation trends in China’s Jinsha River Basin, employing the ITA and MK methods and contrasting their findings with those derived from Pearson’s correlation. In India, studies in Assam (Birpinar et al. 2023) and Punjab (Madane and Waghaye 2023) used traditional and innovative trend methodologies to analyse precipitation data. Similarly, Caloiero (2019) observed disparate results when employing different methodologies in the South Island of New Zealand. The majority of these studies concluded that the ITA method is advantageous because of its simple structure and the assumptions made in trend research.
In Argentina, several studies have analysed precipitation trends using traditional methods. Penalba and Robledo (2010) identified positive trends through the non-parametric Kendall–Tau test in extreme daily rainfall in the northern regions. Doyle et al. (2012) observed positive trends using a linear regression model in annual rainfall over the last four decades of the 20th Century, particularly in the La Plata Basin. Saurral et al. (2017) used a centennial series and found significant increases at several stations through the MK test. Scardilli et al. (2017) identified significant trends with MK in stations across Argentina, attributing them to possible climate shifts. Llano (2021) observed varied behaviour in the trends of daily precipitation concentration across the country using the MK test.
The present study applies the ITA method and a percentile-based approach to a network of stations distributed across the entire Argentine territory. This combination allows a more detailed and spatially comprehensive characterisation of precipitation trends than previous works focused on specific regions or using only traditional methods. Based on this framework, this study aims to assess trends in long-term annual precipitation series across Argentina by comparing the results of the Mann–Kendall test and the ITA method.
2.Materials and Methods
2.1. Data
The long-term meteorological data (1959–2020) from 60 stations in Argentina were obtained from National Meteorological Service (Servicio Meteorológico Nacional, SMN).
2.2. Methodology
The non-parametric rank test known as the Pettitt test was used to detect significant changes in precipitation data for each meteorological station (Pettitt 1979):
A changing point occurs at the kth observation when U(k) is a maximum or minimum and exceeds the critical value, which depends on the confidence level (α = 95%):
2.2.2. The standard normal homogeneity test (SNHT)
The standard normal homogeneity test (SNHT) (Tk) was used to determine the homogeneity of the long-term precipitation data of each station. The test was applied at the 95% significance level (Alexandersson 1986):
where n is the number of total observations and z1 and z2 calculations are given by:
and
where x̅ is the mean, σ is the standard deviation and n is the total number of observations. The year k is considered a change point if the value of T is maximum. To reject the null hypothesis, the test statistic coefficient (in Eqn 6) must be greater than the critical value, which depends on the sample size (Vezzoli et al. 2012).
The coefficient of variation (CV) expresses the ratio between the standard deviation (sd) and the mean (x̅); it is a useful statistical measure to assess the stability of the data (von Storch and Zwiers 1999). This index was calculated for all the stations following Eqn 7:
The MK statistical test (Mann 1945; Kendall 1962) is a ranked non-parametric test widely used to detect monotonic trends in hydro-meteorological time series. An advantage of the MK test is that it is not significantly affected by outliers that occurr in the data series.
An annual data series is used for trend analysis in this study. The MK statistic S is calculated as follows from Eqn 8:
where n is the number of observations, xi and xj are the ith and jth (j > i) observations and sgn(xj − xi) is the sign function defined as:
When the number of data series is greater than or equal to 10 (n ≥ 10), the MK test is then characterised by a normal distribution with mean E(S) = 0 and variance Var(S):
where n is the sample size, m is the number of tied groups (a tied group is a set of sample data having the same value) and tk is the number of ties in extent k.
The standardised test statistic (Z) of the MK test is given by:
The null hypothesis of ‘no trend’ is rejected with a significance level of 5% when |Z| > Z critic; this Z critic is obtained from the standard normal cumulative table. A positive (negative) value of Z indicates an upward (downward) trend.
Sen’s slope test is used to determine the magnitude of a trend (Sen 1968). This non-parametric test, which is independent of distributions, determines the slope m like the median of all slopes given by two consecutive data points (Eqn 12):
where βij denotes the slopes of the lines connecting the pair of points (i, Yi) and (j, Yj), 1 ≤ i ≤ j ≤ n.
The slope m is an unbiased estimate of the trend and exhibits improved accuracy compared with regression statistics, as it mitigates the influence of outliers and missing data.
MK test and Sen’s slope were calculated using the package trend (ver. 1.1.6, T. Pohlert, see https://cran.r-project.org/package=trend) for R (ver. 4.4.1, R Foundation for Statistical Computing, Vienna, Austria, see https://www.r-project.org/).
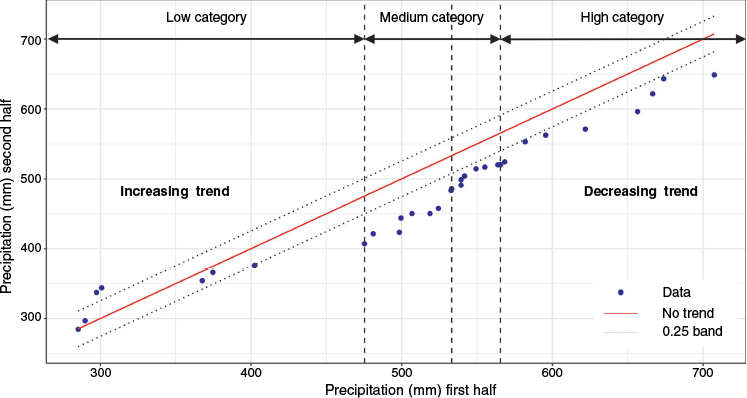
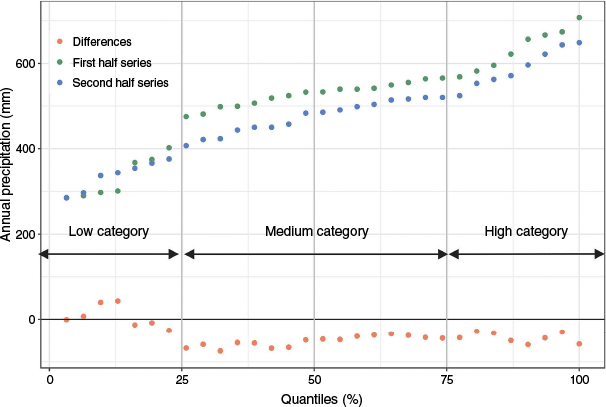
The ITA method was first proposed by Şen (2012). First, the time series must be divided into two equal parts (t1: 1959–1989 and t2: 1990–2020), which are separately sorted in ascending order. In the Cartesian coordinate graphic, the x-axis represents the first half series (t1) and the y-axis represents the second half series (t2) (Fig. 1). If the data lie along the 1:1 ideal line (45° line), there is no trend in the time series. If data are located on the upper (lower) triangular area of the ideal line, an increasing (decreasing) trend in the time series exists. The confidence limits of the trend slope are calculated following Şen (2017). Further, trend detection is supported by the ITA Güçlü graph (Güçlü 2020), which displays the two sub-series and their differences across quartiles, allowing a visual assessment of trend presence. The quantile values added to the ITA graphs are interpreted in terms of reference intervals, such as low (less than the 25th quantile), medium (between the 25th and 75th quantiles) and high (greater than the 75th quantile) (Birpinar et al. 2023) (Fig. 2).
The ITA methodology’s representation of areas with increasing, decreasing or no trend by percentile ranges: low (25%), medium (50%), high (25%) categories.
Another property of the ITA method is that it allows the slope to be calculated as the difference between the means of two periods relative to the number of years in each period. The ITA method was calculated using the trendchange package (ver. 1.2, S. K. Patakamuri, see https://cran.r-project.org/package=trendchange) for R.
3.Results
3.1. Homogeneity testing of precipitation series
Before conducting the trend analysis, the annual precipitation series were subjected to a homogeneity assessment using the SNHT and breakpoint detection using the Pettitt test. Data from 11 stations were found to be non-homogeneous, with breakpoints identified by the Pettitt test. Consequently, these stations were excluded from the trend analysis.
Table 1 summarises the 49 stations used, specifying their longitude and latitude coordinates.
| Number on map | Station | Latitude (°S) | Longitude (°W) | p (mm) | CV | |
|---|---|---|---|---|---|---|
| 1 | La Quiaca Observatorio | 22.06 | 65.36 | 336 | 29.0 | |
| 2 | Las Lomitas | 24.42 | 60.35 | 919 | 22.8 | |
| 3 | Salta Aero | 24.51 | 65.29 | 744 | 20.2 | |
| 4 | Iguazú Aero | 25.44 | 54.28 | 1866 | 23.0 | |
| 5 | Formosa Aero | 26.12 | 58.14 | 1402 | 18.9 | |
| 6 | Posadas Aero | 27.22 | 55.58 | 1796 | 22.3 | |
| 7 | Santiago del Estero | 27.46 | 64.18 | 618 | 28.7 | |
| 8 | Reconquista Aero | 29.11 | 59.42 | 1253 | 22.3 | |
| 9 | Ceres Aero | 29.53 | 61.57 | 933 | 22.3 | |
| 10 | Monte Caseros Aero | 30.16 | 57.39 | 1474 | 20.8 | |
| 11 | Concordia Aero | 31.18 | 58.01 | 1394 | 21.3 | |
| 12 | Córdoba Aero | 31.19 | 64.13 | 841 | 21.8 | |
| 13 | Córdoba Observatorio | 31.24 | 64.11 | 736 | 23.0 | |
| 14 | Pilar Observatorio | 31.4 | 63.53 | 781 | 25.1 | |
| 15 | Sauce Viejo Aero | 31.42 | 60.49 | 1022 | 22.6 | |
| 16 | Paraná Aero | 31.47 | 60.29 | 1113 | 21.1 | |
| 17 | Marcos Juárez Aero | 32.42 | 62.09 | 914 | 21.4 | |
| 18 | Mendoza Observatorio | 32.53 | 68.51 | 252 | 35.1 | |
| 19 | Rosario Aero | 32.55 | 60.47 | 1027 | 20.9 | |
| 20 | San Martín (Mendoza) | 33.05 | 68.25 | 225 | 46.7 | |
| 21 | Río Cuarto Aero | 33.07 | 64.14 | 837 | 17.4 | |
| 22 | San Luis Aero | 33.16 | 66.21 | 665 | 35.3 | |
| 23 | Villa Reynolds Aero | 33.44 | 65.23 | 698 | 24.7 | |
| 24 | Laboulaye Aero | 34.08 | 63.22 | 882 | 22.5 | |
| 25 | Junín Aero | 34.33 | 60.55 | 1043 | 22.3 | |
| 26 | San Miguel | 34.33 | 58.44 | 1188 | 28.2 | |
| 27 | Aeroparque Buenos Aires | 34.34 | 58.25 | 1067 | 22.7 | |
| 28 | San Rafael Aero | 34.35 | 68.24 | 377 | 52.1 | |
| 29 | Buenos Aires Observatorio | 34.35 | 58.29 | 1209 | 23.7 | |
| 30 | El Palomar Aero | 34.36 | 58.36 | 1073 | 22.8 | |
| 31 | Ezeiza Aero | 34.49 | 58.32 | 1000 | 20.1 | |
| 32 | Punta Indio | 35.22 | 57.17 | 990 | 25.5 | |
| 33 | Nueve de Julio | 35.27 | 60.53 | l041 | 19.7 | |
| 34 | Pehuajó Aero | 35.52 | 61.54 | 936 | 22.7 | |
| 35 | Las Flores | 36.02 | 59.08 | 960 | 21.3 | |
| 36 | Dolores Aero | 36.21 | 57.44 | 936 | 20.8 | |
| 37 | Santa Rosa Aero | 36.34 | 64.16 | 706 | 29.4 | |
| 38 | Tandil Aero | 37.14 | 59.15 | 913 | 21.1 | |
| 39 | Coronel Suárez Aero | 37.26 | 61.53 | 794 | 30.0 | |
| 40 | Pigüé Aero | 37.36 | 62.23 | 791 | 22.8 | |
| 41 | Mar del Plata Aero | 37.56 | 57.35 | 930 | 19.2 | |
| 42 | Bahía Blanca Aero | 38.44 | 62.1 | 636 | 24.1 | |
| 43 | Neuquén Aero | 38.57 | 68.08 | 208 | 54.7 | |
| 44 | San Antonio Oeste Aero | 40.47 | 65.06 | 263 | 34.7 | |
| 45 | Bariloche Aero | 41.09 | 71.1 | 803 | 21.6 | |
| 46 | Maquinchao | 41.15 | 68.44 | 198 | 37.2 | |
| 47 | Comodoro Rivadavia Aero | 45.47 | 67.3 | 246 | 37.4 | |
| 48 | Puerto Deseado Aero | 47.44 | 65.55 | 216 | 31.4 | |
| 49 | San Julián Aero | 49.19 | 67.47 | 256 | 34.3 |
3.2. Observed characteristics of annual precipitation
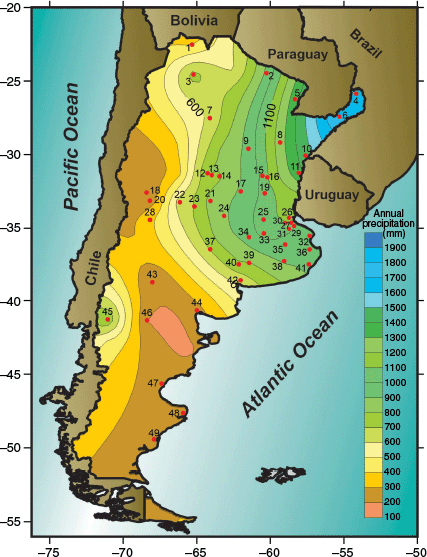
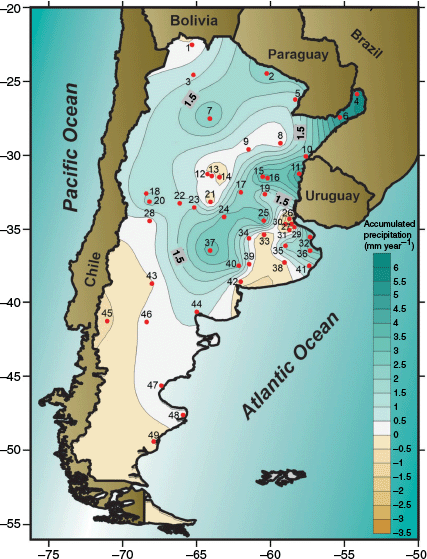
Accumulated precipitation is one of the variables that characterise the climatic conditions of a given region. The distribution of isohyets displays an east–west-oriented gradient (Fig. 3). In the north, the distribution of annual precipitation presents a marked east–west gradient. In the east, annual accumulations exceed 1800 mm, but in the central-west, there is a minimum of 200 mm. In the south of the country, the gradient changes, and the relative maximum (700 mm) is in the west, whereas the coast has values below 300 mm.
Annual accumulated precipitation (mm) based on the 49 reference stations (Table 1 shows their name and geographic coordinates).
Understanding inter-annual variability in precipitation is critical for calculating irrigation water requirements and planning water resource management for various purposes (Yetik et al. 2024). There are different coefficients to analyse the variations, one of which is the CV. A low CV suggests that the annual accumulated precipitation varies only slightly from year to year. By contrast, a high CV indicates greater variability in the annual accumulated precipitation over time. This could imply years of abundant rainfall followed by years of drought, posing challenges for agricultural planning, water management and other activities that depend on a stable water supply.
Table 1 shows this coefficient. Values range from 16 to 30% across most of Argentina. However, values above 30% (with some stations exceeding 50%) are found in a region known as the arid diagonal (Bruniard 1982), which extends from the central west to the southern coast (shown in yellow–brown tones in Fig. 3). In this region, where water is already a scarce resource, precipitation variability becomes particularly pronounced.
3.3. Classic trend analysis
In Fig. 4, the results of the MK test indicate whether the variations in annual accumulated precipitation are due to a systematic change or are random. Positive trends prevail: 38 stations show an increase in annual precipitation, although only 9 of these increases are statistically significant (95%). Some of these stations are located in the central part of the country and have the highest Sen’s slopes (Fig. 5). For example, Concordia (number 11 in Fig. 3) shows an increase of 4.85 mm year–1, Sauce Viejo (number 15) a rise of 4 mm year–1, and Junín (number 25) an increase of 3.7 mm year–1. Another group is located in the central west, where two stations (numbers 18 and 20 in Fig. 3) show increases of 1.4 and 1.89 mm year–1.
Mann–Kendall test results. Triangles pointing up (pointing down) show positive (negative) trends. Solid triangles show trends significant at 95%.
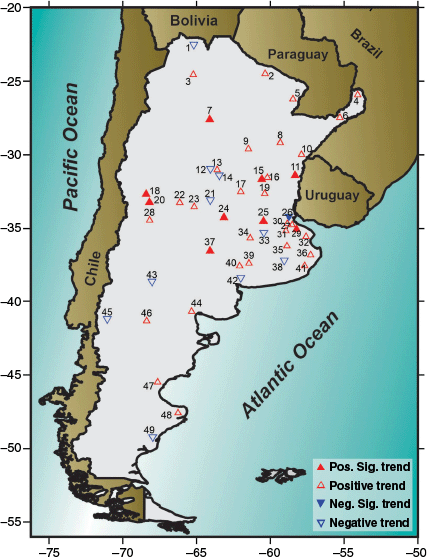
Another metric to evaluate precipitation variation is percentage change, which relates the slope to the mean value. In the analysis of the increase in precipitation, there are several cases worthy of mention: San Martin station (number 20) shows the highest relative increase, with a change of 52%, but it is worth noting that its average annual accumulation is 220 mm. Santa Rosa (number 37) has a percentage change of 30%, with an annual accumulation of 700 mm.
By contrast, 11 stations show a decrease in precipitation, but only one of these has a significant negative trend (95%). San Miguel (number 26), located in the centre of the country, shows a decrease of 3 mm year–1 and a percentage change of 15% (its average annual accumulation over the entire period is 1200 mm year–1).
3.4. Innovative trend analysis
This study uses the ITA method to analyse trends. When this technique is applied, the quantity of positive and negative cases is similar to that obtained with the MK test. However, there is an increase in the number of cases considered significant compared with the MK test (Fig. 6).
ITA test results. Triangles pointing up (pointing down) show positive (negative) trends. Solid triangles show trends significant at 95%.
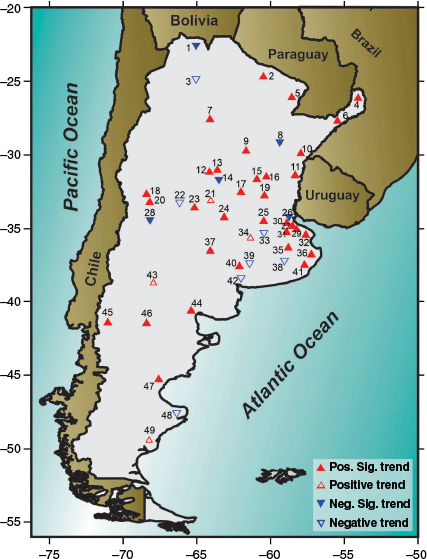
The five stations with a significant negative slope show an average decrease of 1.68 mm year–1. The station with the strongest negative slope is San Miguel (number 26, −5.4 mm year–1). Conversely, the 33 stations with a significant positive slope show an average increase of 2.11 mm year–1. Iguazú (number 4) presents the highest slope (8.2 mm year–1), followed by Posadas (number 6, 5.9 mm year–1). Both stations are in the north-east, where rainfall is more abundant.
Along with the ITA slope calculations, the percentage change rate (difference in means between periods based on the mean of the first period) can be analysed (Güçlü 2020) for the low, medium and high precipitation categories, as well as for the overall data set (Table 2). This analysis highlights significant variability within each category.
| Number on map | Station | ITA (%) | ITA low (%) | ITA medium (%) | ITA high (%) | |
|---|---|---|---|---|---|---|
| 1 | La Quiaca Observatorio | −1.42 | 13.22 | −0.10 | −10.45 | |
| 2 | Las Lomitas | 8.47 | 0.71 | 7.74 | 15.13 | |
| 3 | Salta Aero | −1.22 | −3.11 | −2.53 | 2.47 | |
| 4 | Iguazú Aero | 14.76 | 15.22 | 16.15 | 12.10 | |
| 5 | Formosa Aero | 1.02 | −0.65 | 1.15 | 1.99 | |
| 6 | Posadas Aero | 10.80 | 11.67 | 7.29 | 16.68 | |
| 7 | Santiago del Estero | 10.68 | 28.43 | 11.03 | 1.50 | |
| 8 | Reconquista Aero | −2.60 | −2.99 | −3.71 | −0.33 | |
| 9 | Ceres Aero | 3.80 | 1.61 | 2.87 | 6.94 | |
| 10 | Monte Caseros Aero | 8.18 | 3.96 | 6.04 | 15.12 | |
| 11 | Concordia Aero | 11.89 | −6.15 | 16.05 | 18.34 | |
| 12 | Córdoba Aero | 2.67 | 2.74 | −0.19 | 7.64 | |
| 13 | Córdoba Observatorio | 6.73 | 7.40 | 2.46 | 13.92 | |
| 14 | Pilar Observatorio | −5.56 | −6.89 | −1.23 | −11.53 | |
| 15 | Sauce Viejo Aero | 13.02 | 9.52 | 13.86 | 13.90 | |
| 16 | Paraná Aero | 8.65 | 13.25 | 13.53 | −2.33 | |
| 17 | Marcos Juárez Aero | 8.31 | 9.35 | 11.57 | 2.27 | |
| 18 | Mendoza Observatorio | 15.37 | 8.06 | 23.02 | 7.25 | |
| 19 | Rosario Aero | 6.63 | 6.90 | 3.46 | 12.18 | |
| 20 | San Martín (Mendoza) | 38.22 | 50.96 | 49.68 | 20.11 | |
| 21 | Río Cuarto Aero | 0.34 | −4.31 | 2.47 | −0.13 | |
| 22 | San Luis Aero | −0.77 | 9.61 | 9.79 | −19.55 | |
| 23 | Villa Reynolds Aero | 8.31 | 12.00 | 6.27 | 9.73 | |
| 24 | Laboulaye Aero | 12.70 | 2.22 | 13.58 | 18.52 | |
| 25 | Junín Aero | 15.91 | 9.68 | 11.78 | 28.35 | |
| 26 | San Miguel | −13.29 | −12.73 | −9.71 | −19.25 | |
| 27 | Aeroparque Buenos Aires | 9.76 | 2.11 | 10.33 | 14.02 | |
| 28 | San Rafael Aero | −7.90 | 8.04 | 1.86 | −24.39 | |
| 29 | Buenos Aires Observatorio | 10.33 | 1.07 | 14.01 | 10.60 | |
| 30 | El Palomar Aero | 5.98 | −4.37 | 6.61 | 12.19 | |
| 31 | Ezeiza Aero | 3.96 | 4.82 | 2.04 | 6.89 | |
| 32 | Punta Indio | 12.79 | 23.81 | 10.47 | 10.48 | |
| 33 | Nueve de Julio | −0.36 | −3.89 | −3.54 | 8.10 | |
| 34 | Pehuajó Aero | 0.24 | 2.86 | 1.08 | −2.77 | |
| 35 | Las Flores | 5.48 | 11.90 | 1.78 | 8.24 | |
| 36 | Dolores Aero | 12.93 | 11.13 | 12.83 | 14.38 | |
| 37 | Santa Rosa Aero | 13.32 | 8.93 | 13.15 | 16.07 | |
| 38 | Tandil Aero | −0.07 | −9.49 | −0.92 | 8.42 | |
| 39 | Coronel Suárez Aero | −3.88 | −7.54 | 3.43 | −12.72 | |
| 40 | Pigüé Aero | 9.47 | 4.80 | 11.58 | 8.84 | |
| 41 | Mar del Plata Aero | 4.62 | 2.46 | 3.69 | 7.83 | |
| 42 | Bahía Blanca Aero | −0.10 | 2.03 | −4.85 | 6.98 | |
| 43 | Neuquén Aero | 0.20 | 6.62 | −0.56 | −0.89 | |
| 44 | San Antonio Oeste Aero | 18.57 | 11.70 | 9.97 | 36.79 | |
| 45 | Bariloche Aero | 1.54 | −2.13 | 0.98 | 5.05 | |
| 46 | Maquinchao | 5.32 | −6.93 | 5.38 | 10.97 | |
| 47 | Comodoro Rivadavia Aero | 6.83 | 3.98 | −2.35 | 23.15 | |
| 48 | Puerto Deseado Aero | −0.99 | 14.11 | −4.73 | −2.07 | |
| 49 | San Julián Aero | 1.17 | 16.46 | 3.35 | −8.40 |
In most cases, when the overall trend is positive (negative) for the entire period, all three categories show an increase (decrease) in the percentage change rate. Analysing the different categories reveals that 60% of the stations exhibit the largest variation for the extreme precipitation values (fourth quartile). For example, the maximum changes are a 36% increase in San Antonio Oeste (station number 44) and a 24% decrease in San Rafael (number 28). Additionally, 26% of the stations show the highest variability in the lowest precipitation values, with high variation rates. For instance, the largest decrease (12%) is observed at the San Miguel station, whereas San Martín shows an increase of 50%.
3.5. Comparative evaluation of MK and ITA in detecting precipitation trends
This section compares the two techniques used to study trends in annual precipitation series by analysing specific cases of positive and negative trends.
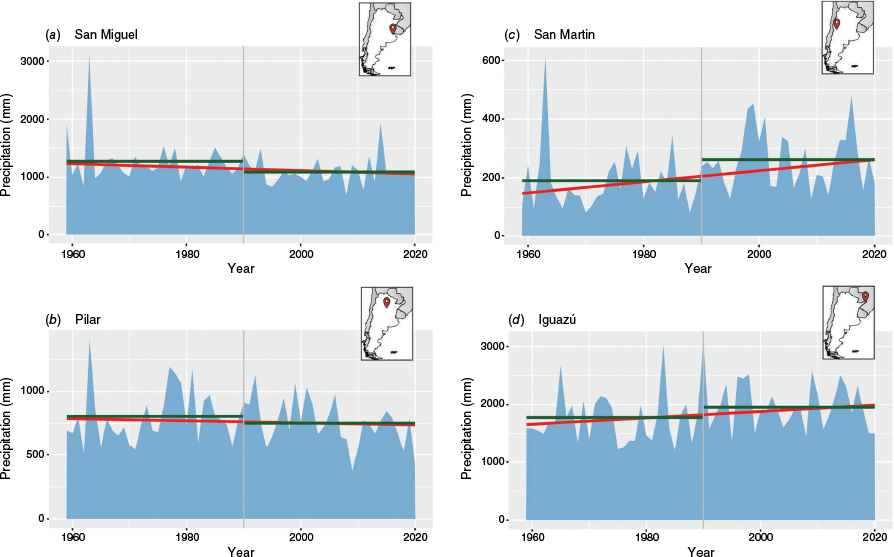
San Miguel (number 26) and Pilar (number 14) are the two stations selected for this discussion because of the magnitude of the negative trend, and Pilar represents a special case where the MK test fails to detect a significant trend whereas ITA identifies one. These stations are located in the central part of the country. In San Miguel, annual precipitation accumulation is 1200 mm. Comparing the two sub-periods (1959–1989 and 1990–2020), accumulation decreased from 1270 to 1100 mm. Pilar shows an average of 780 mm over the entire 62-year period, and a change from 800 to 760 mm when comparing the periods. Fig. 7 shows the inter-annual variability of rainfall, the mean of each sub-period and the slope calculated using the Sen method (−2.92 for San Miguel and −0.80 for Pilar).
Annual precipitation (blue area), Sen’s slope (red line), mean value for first (1959–1989) and second (1990–2020) half period (green line). (a) San Miguel, (b) Pilar, (c) San Martín, and (d) Iguazú.
The analysis of the two study periods (1959–1989 and 1990–2020) used for the ITA methodology in Fig. 8 (this figure shows a new representation of ITA by Güçlü 2020) ranks the two sub-series in ascending order and shows the difference between them based on the distribution quartiles. In the two locations, as expected given the negative trend, the values of the first sub-series are higher than those of the second. Some specific details are: in San Miguel, the greatest difference between series is observed in the high category; this is due to the peak of 3100 mm in 1963 (Fig. 7a). Pilar shows differences between the two sub-periods for the low and high categories (Fig. 8b and 9b). In the medium category, the rainfall values are very similar, which may be the reason why the MK test is not significant.
ITA Güçlü representation of data: annual precipitation for first period (1959–1989) (green); annual precipitation for second period (1990–2020) (blue), and difference between them (red). (a) San Miguel, (b) Pilar, (c) San Martín, and (d) Iguazú.
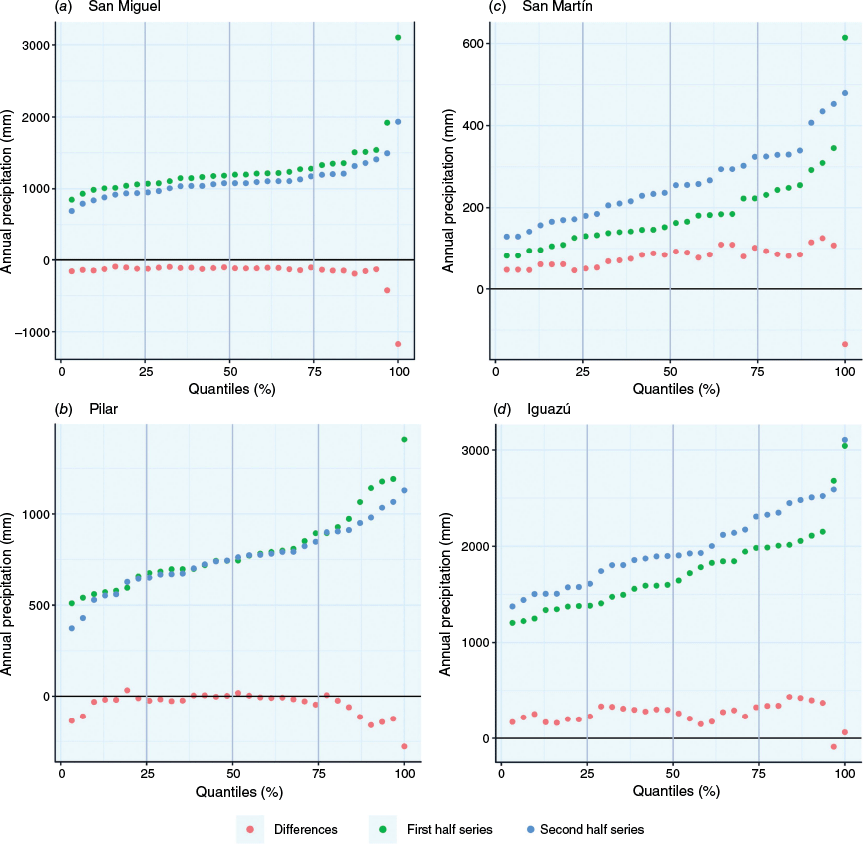
ITA methodology’s representation of data: no trend, red line; significance 5%, dotted line; vertical dashed lines divided into low, medium and high categories of precipitation. (a) San Miguel, (b) Pilar, (c) San Martín, and (d) Iguazú.
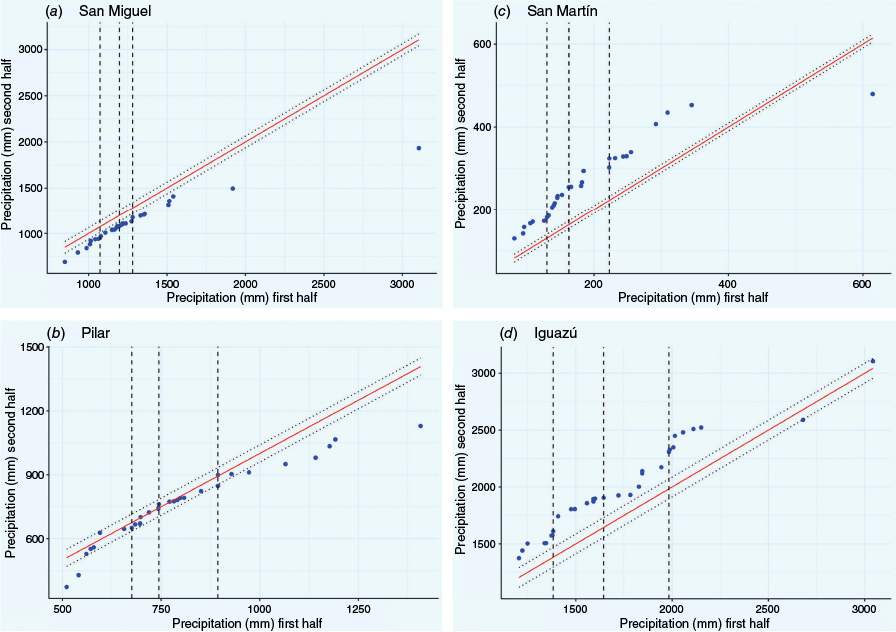
For the case of positive trends, the stations selected to detail their behaviour are San Martín (number 20) and Iguazú (number 4), located in the central-west region and the north-east of the country respectively. San Martín shows particular behaviour due to the absolute maximum of 614 mm recorded in 1963, almost three times the mean value of the first period (189 mm) (this atypical situation is documented by Pérez de Scaraffia 1964); in Fig. 9c, this year is represented by the isolated point below the line in the ITA graph. Given the low magnitude of the annual precipitation values, the slope (1.89 mm year–1) represents a rate of change of more than 50% in value. Unlike the other two stations, Iguazú shows an average annual accumulation of more than 1800 mm over the total period, changing from 1700 to 2000 mm between the sub-periods. These changes do not represent a significant trend for MK, unlike ITA. Fig. 8d and 9d show that the values of the second period are greater than those of the first (area of increase in the trend), except for the most extreme values in the non-rejection H0 zone (area between dotted lines in Fig. 9).
The cases of Pilar and Iguazú are two clear examples of how the MK test can hide the presence of a trend.
4.Conclusions
This study investigated the long-term variability of annual precipitation in Argentina during the 1959–2020 period, using the MK and ITA methods. Both approaches revealed predominantly positive trends; however, only a few were statistically significant according to the MK test. By contrast, ITA detected a greater number of significant changes, particularly in the highest and lowest precipitation categories.
The ITA method proved especially valuable for identifying trends across different parts of the distribution. It revealed that nearly 50% of stations exhibited stronger trends in high precipitation values. Nevertheless, the most pronounced relative increases and decreases were found in the lowest quartile. On average, all categories showed increases of up to 11% and decreases of ~8%.
Although both methods indicated similar overall trend directions, ITA provides a graphical interpretation that facilitates clearer understanding of precipitation trends across categories.
These findings have important implications for water resource management, agriculture and climate adaptation in Argentina. Changes in the intensity and distribution of precipitation events may affect crop planning, infrastructure resilience and long-term strategies under climate variability. Continued monitoring using multiple analytical approaches is essential to support informed decision-making in the face of ongoing climate change.
Data availability
Meteorological information was provided by the National Meteorological Service (SMN, see https://smn.gob.ar/).
Declaration of funding
The following grants provided support for this research: Universidad de Buenos Aires, 20020190100090BA; CONICET, 11220210100282CO.
Acknowledgements
I sincerely thank the reviewers for their insightful comments and constructive suggestions, which have significantly improved the quality of this work. I thank Pablo Leal, Marianela Groppa and Sergio González for their technical assistance and to Servicio Meteorológico Nacional and Data Storage of DCAO.
References
Alashan S (2020) Innovative trend analysis methodology in logarithmic axis. Konya Journal of Engineering Sciences 8(3), 573-585.
| Crossref | Google Scholar |
Alashan S (2024) Non‑monotonic trend analysis using Mann–Kendall with self‑quantiles. Theoretical and Applied Climatology 155, 901-910.
| Crossref | Google Scholar |
Alexandersson H (1986) A homogeneity test applied to precipitation data. Journal of Climate 6, 661-675.
| Crossref | Google Scholar |
Arias PA, Bellouin N, Coppola C et al. (2021) Technical Summary. In ‘Climate Change 2021: The Physical Science Basis. Contribution of Working Group I to the Sixth Assessment Report of the Intergovernmental Panel on Climate Change’. (Eds V Masson-Delmotte, P Zhai, A Pirani, SL Connors, C Péan, S Berger, N Caud, Y Chen, L Goldfarb, MI Gomis, M Huang, K Leitzell, E Lonnoy, JBR Matthews, TK Maycock, T Waterfield, O Yelekçi, R Yu, B Zhou) pp. 33−144. (Cambridge University Press: Cambridge, UK, and New York, NY, USA) 10.1017/9781009157896.002
Ashraf M, Shahid M, Waseem M, Azam M, Rahman K (2023) Assessment of variability in hydrological droughts using the improved innovative trend analysis method. Sustainability 15, 9065.
| Crossref | Google Scholar |
Benzater B, Elouissi A, Lupikasza E, Pham Q, Harizia A, Fellah S (2024) Application of the ITA approach to analyze spatio‑temporal trends in monthly maximum rainfall categories in the Vu Gia‑Thu Bon, Vietnam. Theoretical and Applied Climatology 155, 1467-1491.
| Crossref | Google Scholar |
Birpinar M, Kizilöz B, Sisman E (2023) Classic trend analysis methods’ paradoxical results and innovative trend analysis methodology with percentile ranges. Theoretical and Applied Climatology 153, 1-18.
| Crossref | Google Scholar |
Bruniard E (1982) La diagonal árida argentina: un límite climático real. Revista Geográfica 95, 5-20 [In Spanish].
| Google Scholar |
Caloiero T (2019) Evaluation of rainfall trends in the South Island of New Zealand through the innovative trend analysis (ITA). Theoretical and Applied Climatology 139, 493-504.
| Crossref | Google Scholar |
Caloiero T, Coscarelli R, Ferrari E (2018) Application of the innovative trend analysis method for the trend analysis of rainfall anomalies in southern Italy. Water Resources Management 32, 4971-4983.
| Crossref | Google Scholar |
Dong Z, Jia W, Sarukkalige R, Fu G, Meng Q, Wang Q (2020) Innovative trend analysis of air temperature and precipitation in the Jinsha River Basin, China. Water 12, 3293.
| Crossref | Google Scholar |
Doyle M, Saurral R, Barros V (2012) Trends in the distributions of aggregated monthly precipitation over the La Plata Basin. International Journal of Climatology 32, 2149-2162.
| Crossref | Google Scholar |
Gedefaw M, Yan D, Wang H, Qin T, Girma A, Abiyu A, Batsuren D (2018) Innovative trend analysis of annual and seasonal rainfall variability in Amhara Regional State, Ethiopia. Atmosphere 9, 326.
| Crossref | Google Scholar |
Güçlü Y (2020) Improved visualization for trend analysis by comparing with classical Mann–Kendall test and ITA. Journal of Hydrology 584, 124674.
| Crossref | Google Scholar |
Guo B, Zhang J, Meng X, Xu T, Song Y (2020) Long-term spatio-temporal precipitation variations in China with precipitation surface interpolated by ANUSPLIN. Scientific Reports 10(1), 81.
| Crossref | Google Scholar | PubMed |
Hallouz F, Meddi M, Ali Rahmani SE, Abdi I (2024) Innovative versus traditional statistical methods in hydropluviometric: a detailed analysis of trends in the Wadi Mina Basin (northwest of Algeria). Theoretical and Applied Climatology 155, 8263-8286.
| Crossref | Google Scholar |
Kavwenje S, Zhao L, Chen L, Ngongondo C, Chaima E, Akintayo Aborisade M, Tafa Oba B, Kumambala P (2023) Integrated statistical and graphical non‑parametric trend analysis of annual and seasonal rainfall in the Shire River Basin, Malawi. Theoretical and Applied Climatology 155, 2053-2069.
| Crossref | Google Scholar |
Llano M (2021) Variabilidad temporal de la concentración diaria de precipitación en la Argentina. Temporal variability of daily concentration of precipitation in Argentina. Meteorologica 46(2), e005 [In Spanish with title, abstract and keywords in Spanish and English].
| Crossref | Google Scholar |
Madane D, Waghaye A (2023) Spatio‑temporal variations of rainfall using innovative trend analysis during 1951–2021 in Punjab State, India. Theoretical and Applied Climatology 153, 923-945.
| Crossref | Google Scholar |
Mann HB (1945) Non-parametric tests against trend. Econometrica 13, 245-259.
| Crossref | Google Scholar |
Penalba O, Robledo F (2010) Spatial and temporal variability of the frequency of extreme daily rainfall regime in the La Plata Basin during the 20th Century. Climatic Change 98, 531-550.
| Crossref | Google Scholar |
Peña-Angulo D, Vicente-Serrano S, Domínguez-Castro F, Murphy C, Reig F, Tramblay Y, Trigo R, Luna M, Noguera I, Aznárez-Balta M, García-Herrera R, Tomas-Burguera M, El Kenawy A (2020) Long-term precipitation in southwestern Europe reveals no clear trend attributable to anthropogenic forcing. Environmental Research Letters 15, 094070.
| Crossref | Google Scholar |
Pérez de Scaraffia A (1964) Las variaciones del tiempo en Mendoza en la primavera-verano 1963–64. Boletín de Estudios Geográficos 42, 61-64 [In Spanish].
| Google Scholar |
Pettitt A (1979) A non-parametric approach to the change point problem. Journal of the Royal Statistical Society – C. Applied Statistics 28, 126-135.
| Google Scholar |
Saurral R, Camilloni I, Barros V (2017) Low-frequency variability and trends in centennial precipitation stations in southern South America. International Journal of Climatology 37, 1774-1793.
| Crossref | Google Scholar |
Scardilli A, Llano M, Vargas W (2017) Temporal analysis of precipitation and rain spells in Argentinian centenary reference stations. Theoretical and Applied Climatology 127, 339-360.
| Crossref | Google Scholar |
Sen P (1968) Estimates of the regression coefficient based on Kendall’s tau. Journal of the American Statistical Association 63(324), 1379-1389.
| Crossref | Google Scholar |
Şen Z (2012) Innovative trend analysis methodology. Journal of Hydrologic Engineering 17(9), 1042-1046.
| Crossref | Google Scholar |
Şen Z (2017) Innovative trend significance test and applications. Theoretical and Applied Climatology 127, 939-947.
| Crossref | Google Scholar |
Vezzoli R, Pecora S, Zenoni E, Tonelli F (2012) Data analysis to detect inhomogeneity, change points, trends in observations: an application to Po River discharge extremes. CMCC Research Paper 1:138. SSRN 2013. [Preprint, published 2 January 2013] 10.2139/ssrn.2195345
Yetik A, Arslan B, Sen B (2024) Trends and variability in precipitation across Turkey: a multimethod statistical analysis. Theoretical and Applied Climatology 155, 473-488.
| Crossref | Google Scholar |
Zamani R, Mirabbasi R, Nazeri M, Meshram S, Ahmadi F (2018) Spatio-temporal analysis of daily, seasonal and annual precipitation concentration in Jharkhand state, India. Stochastic Environmental Research and Risk Assessment 32, 1085-1097.
| Crossref | Google Scholar |
Zhang K, Yao Y, Qian X, Wang J (2019) Various characteristics of precipitation concentration index and its cause analysis in China between 1960 and 2016. International Journal of Climatology 39, 4648-4658.
| Crossref | Google Scholar |