

Effects of temperature on tissue–diet isotopic spacing of nitrogen and carbon in otolith organic matter
Jane A. Godiksen A D , Ming-Tsung Chung B , Arild Folkvord A C and Peter Grønkjær B
A Institute of Marine Research, Postbox 1870 Nordnes, N-5817 Bergen, Norway.
B University of Aarhus, Department of Bioscience, Ole Worms Allé 1, DK-8000 Aarhus C, Denmark.
C University of Bergen, Department of Biological Sciences, Postbox 7803, N-5020 Bergen, Norway.
D Corresponding author. Email: jane.godiksen@hi.no
Marine and Freshwater Research 70(12) 1757-1767 https://doi.org/10.1071/MF19054
Submitted: 14 February 2018 Accepted: 1 August 2019 Published: 28 October 2019
Journal Compilation © CSIRO 2019 Open Access CC BY-NC-ND
Abstract
Reconstruction of the trophic position of a fish can be performed by analysing stable nitrogen and carbon isotopes in otolith protein. However, ambient temperature may affect the tissue–diet isotopic spacing of stable isotopes from diet to predator tissue and bias estimates of trophic position. To test this, otolith protein, heart and muscle tissue from a rearing experiment with juvenile cod held at different temperatures (4, 7, 10 and 14°C) were analysed. There was no significant effect of temperature on otolith δ15N, whereas muscle and heart exhibited a slight decrease in δ15N values with increasing temperature corresponding to maximum of 0.6‰ over the 10°C range. By contrast, the otolith protein δ13C values at 4 and 7°C were significantly higher than for 10 and 14°C, suggesting an approximate 1‰ increased tissue–diet enrichment at the lower temperatures. Temperature had no significant effect on muscle and heart δ13C values. Considering the annual mean variation in ocean temperatures, our results indicate that the trophic signals recorded in the otoliths will reflect changes in diet isotope values with little bias from the ambient temperature experienced by the fish.
Additional keywords: fish, food web, otolith, marine, stable isotopes.
Introduction
Stable isotopes of nitrogen and carbon retrieved from soft tissue amino acids are well-established indicators of trophic interactions in marine systems. The nitrogen isotopic ratio (δ15N) is a proxy for trophic level, with an approximate increase in δ15N of 3.2‰ (the tissue–diet isotopic spacing, Δδ15N) for each increase in trophic level in fishes (Sweeting et al. 2007a). The stable carbon isotopic ratio δ13C shows less tissue–diet isotopic spacing (0.4‰; Post 2002), with a mean value in fish of 1.8‰ (ranging from –0.8 to 4‰; Caut et al. 2009), but can reveal important insights into the source of primary production at the base of the food chain; δ13C has been shown to vary with the type of primary producer (e.g. C3, C4 plants), depth (e.g. pelagic and benthic) and region (e.g. inshore and offshore; Fischer and Wiencke 1992; Hobson 1999). Although the stable isotope approach does not provide the same specific knowledge of species composition in the diet as does stomach analysis, the former approach can be used to model the likely species composition of the diet if isotope values of the prey species are known and if there are measurable differences between the isotope values of the prey species (Moore and Semmens 2008). However, this modelling requires further knowledge of the tissue–diet isotopic spacing (Δ) between trophic levels, and therefore the factors that may cause variation in the enrichment of the heavier isotope.
The tissue–diet spacing of carbon and nitrogen isotopes during trophic interactions is not fixed and varies across species as well as across individuals within the same species. The isotopic differences between consumer diet and tissues result from relative rates of isotope exchange through all assimilation and catabolic reactions. Fractionation of nitrogen takes place during transamination and is therefore related to the transformation of amino acids and excretion of excess nitrogen. In the catabolism of amino acids, discrimination against 13C occurs during formation of CO2, when acetyl groups are oxidised (Galimov 1985). Variation may occur in different tissues from the same animal, as well as between individuals, because of variations in amino acid composition, temperature, feeding level, type of consumer (detritivore, carnivore or herbivore) and habitat type (marine, freshwater or terrestrial; Vander Zanden et al. 1997; Vanderklift and Ponsard 2003; Trueman et al. 2005; Barnes et al. 2007; McMahon et al. 2010). In addition, differences in lipid content of the analysed tissue may introduce variations in δ13C among individuals (Post et al. 2007).
Since the mid-2000s, ambient temperature has received attention as a potential modifier of tissue–diet enrichment values because of its effects on rates of biochemical processes, tissue turnover and, ultimately, growth in ectotherms such as fish, all of which affect the dynamics of stable isotopes in fish tissues (Colborne et al. 2017). A few studies have tested this thoroughly (Barnes et al. 2007; Sweeting et al. 2007a, 2007b) and found that temperature significantly affects both nitrogen and carbon tissue–diet isotopic spacing. The lack of systematic investigations into the drivers of variation in diet–tissue fractionation limits our understanding of the mechanisms behind the observed temperature effect. Thus, it is necessary to gain a more physiology-based understanding of the factors that influence tissue–diet isotopic spacing.
The relationship between ambient temperature and tissue–diet enrichment is likely related to the effect of temperature on tissue turnover rates relative to growth rates and modified by feeding level. Power et al. (2003) suggested that δ13C variation in Daphnia magna across a temperature range is controlled by the relative rates of change in the amounts of assimilated and respired carbon. Consequently, temperatures above the optimal range for growth of D. magna would lead to decreased food assimilation relative to metabolic rate, and hence result in increased loss of isotopically light CO2 and a concurrent increase in tissue δ13C. The effects of temperature and growth on δ15N variation may be more complex. If fast growth is achieved through increased nitrogen-use efficiency, as documented in fishes (Carter et al. 1998), such as through direct routeing of amino acids to protein synthesis, the loss of depleted nitrogen in urea and ammonia will decrease relative to the assimilation of nitrogen into the tissues, leading to decreased tissue–diet enrichment (Olive et al. 2003; Trueman et al. 2005; Sweeting et al. 2007a). By contrast, the apparent tissue–diet enrichment is increased in starving individuals with high tissue turnover, such as fish fed below maintenance at high temperatures (Olive et al. 2003; Doi et al. 2017). If food intake is below maintenance, then energy for maintenance and activity is increasingly obtained by turning over already-incorporated energy sources, especially lipids and proteins. The use of δ13C-depleted lipid as metabolic fuel and breakdown and deamination of protein is likely to increase tissue δ13C and δ15N values. A consequence of the importance of tissue turnover relative to growth is that isotope values of metabolically active and labile tissues may be more influenced by variations in temperature and food availability than more inert tissue.
Traditionally, stable isotope analyses of fishes have been performed on protein-rich, metabolically active tissue such as muscle, heart and liver. Recently, metabolically inert biominerals, such as otoliths, have provided the protein source for stable isotope analysis (Vandermyde and Whitledge 2008; McMahon et al. 2011; Sirot et al. 2017), raising the question as to whether temperature also affects tissue–diet isotopic spacing in these materials. Although metabolically inert biominerals are not affected by turnover, their growth is still fuelled by organic materials with isotope values largely reflecting the isotope values of the whole organism, with potential differences due to routeing and tissue-specific enrichment factors (McMahon et al. 2011; Grønkjær et al. 2013). Shiao et al. (2018) found strong indications of direct routeing of amino acids from the diet to the otolith, thereby bypassing the normal biochemical transamination that causes fractionation of nitrogen. Because of potentially different pathways of amino acids in soft tissues and otoliths, it is relevant to investigate the temperature-dependent tissue–diet isotopic spacing of stable carbon and nitrogen isotopes.
The question of variable tissue–diet enrichment is especially pertinent for otoliths, because otolith archives are a unique source of historical material (Morrongiello et al. 2012). Thus, otoliths may be used to create long-term chronologies of variations in stable isotope ratios, and consequently chronologies of food web changes, provided that among-individual mean tissue–diet enrichment values are constant or known over the time period covered by a chronology.
Given the importance of ensuring that the isotope signals recorded in the otoliths reflect changes in diet and not temperature-dependent enrichment of the isotopes, the aim of this study was to test for temperature-dependent isotope enrichment of nitrogen and carbon recovered from otolith organic matter. This was accomplished by conducting stable isotope analyses of otolith, muscle and heart tissue obtained from a controlled single-diet experiment with juvenile cod (Gadus morhua) reared at four different temperatures.
Materials and methods
Cod rearing and experiment procedure
Parental cod used in the experiment were held at Parisvatnet Research Station (Institute of Marine Research (IMR), Tjeldstø, Norway). All individuals were from a second-generation cultured strain. The eggs hatched in March 2014, after which the larvae were transferred to initial feeding tanks at 6°C and fed live zooplankton. In May, the juveniles were transferred to an outdoor pond, where they were reared in a large net cage and fed pellets (Skretting GEMMA Micro 300, Stavanger, Norway). The temperature in the pond followed the natural cycle, reaching its maximum of 17°C at a depth of 2 m. The juveniles were transported to the Matre Research Station (IMR, Matre, Norway) in October, at a wet weight of between 40 and 80 g. At the Matre Research Station, the fish were held in an outdoor tank for acclimation and stress reduction until the beginning of the experiment a few weeks later.
The experiment started when the cod had reached an average weight of 65 g. To avoid cannibalism, the smallest and largest individuals were discarded and only fish between 50 and 80 g were included in the experiment. All fish were sedated with benzocaine before being tagged with a 12-mm SMARTRAC smart glass tag (Smartrac N.V., Amsterdam, Netherlands), and length and weight were measured before fish were randomly (5–10 fish at a time) transferred to 12 1.5-m3 experimental tanks. The cod were reared in triplicate groups at four different temperatures (4, 7, 10 and 14°C; Fig. 1) and the temperature in the tanks was gradually lowered or raised by 2°C per day until the experimental temperature was reached. Water from the fjord was cooled or heated in a pipeline system and premixed individually for each temperature group to ensure the assigned temperature before entering the tanks.

|
The temperature of the water was logged electronically at the entrance of each of the temperature groups. Temperature for the four temperature groups of 4, 7, 10 and 14°C varied with a s.d. of 0.51, 0.18, 0.16 and 0.37 respectively over the entire experiment, except for during three periods of 2–3 days when the heat exchanger was broken and temperatures reached as high as 11°C in the 4°C tanks.
During the experiment, fish were fed in excess with commercial food pellets (Amber Neptun; Skretting) using automats. According to information from the manufacturer, the pellets contained 54–57% protein, 15% lipid, 10–11% nitrogen-free extracts, 0.6–4.5% fibre and 10–12% ash. The raw materials were fishmeal, fish oil, soy protein concentrate, wheat and wheat gluten. All dead fish were immediately removed, measured for length and weight and then frozen.
Before starting the experiment, 25 fish were killed to determine δ13C and δ15N isotope values of the muscle, heart and otolith material laid down before the experiment. The results of the analyses from these fish are described as the ‘starting point’ throughout this paper. Fish from each tank were sampled two or three times for the duration of the experiment. The experiment for each tank ended when the average size of the fish reached ~300 g, which occurred on different dates between August and November 2015, largely determined by rearing temperature. At the end of the experiment, fish were killed with an overdose of benzocaine and individual length (mm) and body mass (g) were recorded. Samples of dorsal muscle tissue and heart were taken from each fish and frozen immediately after sampling. Otoliths were removed, cleaned and stored in paper otolith bags for later analysis. In the laboratory at the IMR in Bergen, otoliths were photographed and lengths were measured before being sent to Aarhus University for analysis. Fourteen samples of three to five food pellets were taken out at regular intervals and analysed to test for changes in diet isotope values. The pellets were dried in aluminium foil trays at 45°C for 2–3 days. After drying, the samples were crushed in a mortar. Seven samples intended for δ13C analysis were lipid extracted using three rounds of chloroform–methanol (2 : 1)-based extraction according to Bligh and Dyer (1959), whereas the remaining seven samples intended for δ15N analysis were not. Pellet samples (~0.4 mg) were placed in tin (Sn) cups for stable isotope analysis.
The fish, primarily in the lower temperature groups, experienced wounds and exhibited air gulping behaviour, and two rounds of antibiotics were given to these fish. The first treatment was given to Tanks 1, 5 and 7 during the last 2 weeks of February, and a second treatment was given to Tanks 2, 6 and 7 in the last 2 weeks of March. The antibiotics were coated onto the normal feeding pellets so that the intake would contain the same food during the whole experiment. Despite the treatment, there was higher mortality in the low temperature groups compared to the high temperature groups during the experiment (357 of 985 fish were removed from the experiment). Most were sampled out because of wounds and the risk of spreading disease. The high mortality in Tank 5 resulted in an early termination. Owing to the high mortality in the 4°C tanks, the planned sampling procedure at ~220 g was cancelled to ensure that enough fish survived until the end of the experiment. No sign of cannibalism was seen in any of the tanks. Between 4 and 16 fish were sampled from each of the remaining 11 tanks.
Otolith and tissue preparation and analyses
Otolith soluble organic matter (SOM) was extracted from 13 fish collected before the start of the experiment and 112 fish sampled during the experiment. The extraction followed the protocol developed by Grønkjær et al. (2013). Briefly, sagittal otoliths were cleaned, weighed and ground using a Retsch MM 2000 oscillating mill (Retsch GmbH, Haan, Germany) before demineralisation. For analysis, 50 mg of otolith powder was used from each fish. In case individual otoliths weighed less than 50 mg, both otoliths were used. This sample was placed in a 5-mL microtube and demineralised by first adding 100 µL of Milli-Q water and 1.5 mL of 0.1 M HCl (5°C). The sample tubes were then kept at room temperature for 2 h. After the initial demineralisation, 1.60 mL of 0.6 M HCl (5°C) was added to each sample and kept at room temperature for another 2 h. Another 1.70 mL of 0.6 M HCl (5°C) was added and the samples were kept at room temperature for 1–2, after which the tubes were moved to 30°C for 3–4 days (i.e. until the demineralisation process was complete). After complete demineralisation, the microtube contained a supernatant, which contained the SOM, and a precipitate, consisting of insoluble organic material (ISOM). To separate the SOM and ISOM, the microtubes were centrifuged at 20 160g for 15 min at 20°C, after which the supernatant (SOM) was transferred to an Amicon Ultra 10-kDa centrifugal filters (Sigma–Aldrich Denmark ApS, Brøndby, Denmark). The filters were then centrifuged at 5400g for 10 min at 20°C. To avoid SOM loss, the microtubes were cleaned using Milli-Q water and were centrifuged again and the supernatants were transferred to filters, as described above. To remove excess chloride ions from the SOM samples, 3.5 mL of Milli-Q water was added to each filter, and the filters were centrifuged at 5400g at 20°C until ~80 µL remained in each. This remaining supernatant was pipetted to preweighed Sn cups. The samples were then freeze dried for 24 h, after which the Sn cups were packed and sent for analysis.
In total, 103 muscle and 103 heart tissue samples of ~0.5 g were dried in aluminium foil trays at 45°C for 2–3 days. After drying, the samples were crushed and tissue samples (mean ± s.d., 0.53 ± 0.07 mg) were packed in Sn cups for stable isotope analysis.
The δ15N and δ13C values were standardised using a gelatine A (Gel-A) standard with known isotope values of δ15N = 5.4‰ and δ13C = –21.8‰. Three internal standards consisting of 0.3 mg of Gel-A were run for each of the 17 tissue samples. For each 9 or 10 otolith samples, 3 or 2 internal 0.2- to 0.7-mg Gel-A standards were run. The standards were used to correct for daily offsets and drift. Low sample size bias was also assessed using the standards. C : N ratios were used to arithmetically correct for lipid content in heart tissue following Barnes et al. (2007). Muscle tissue had C : N ratios similar to pure protein (mean = 3.70; range 3.58–3.81) and were therefore not lipid corrected.
All samples were analysed at the Department of Bioscience, Center for Geomicrobiology, University of Aarhus (Aarhus, Denmark). The samples were measured by isotope ratio mass spectrometry (IRMS) in combination with an element analyser (EA) and an operational interface (Flash EA 1112 series, ThermoFisher Scientific, Waltham, MA, USA; and Delta V Plus Isotope Ratio MS, ThermoFisher Scientific).
Owing to technical issues, data from the continuous flow (CF)-IRMS-analysed otoliths are not from the same fish as those subject to muscle and heart tissue analysis.
Statistical analyses
Analysis of variance (ANOVA) was used to examine variation among tanks at the start of the experiment.
Otolith weight was examined in relation to fish final weight using linear regression, and the relationship among four temperature groups was tested by analysis of covariance (ANCOVA). Linear mixed-effects models were used to evaluate whether isotope values (δ15N and δ13C) in otolith, muscle and heart tissues varied among treatments. Temperature and fish growth were treated as fixed effects and tank was used as a random effect. Fish growth was calculated based on measurements of individual bodyweight increase during the temperature-controlled experiment. The interaction between temperature and fish growth was evaluated, and non-significant interaction terms were removed from the model. The analyses were conducted using the packages lmr4 (ver. 1.1-21, see https://cran.r-project.org/web/packages/lme4/index.html, accessed 3 September 2019; Bates et al. 2015) and lmerTest (ver. 3.1-0, see https://cran.r-project.org/web/packages/lmerTest/index.html, accessed 3 September 2019; Kuznetsova et al. 2017) in R (ver. 3.6.1, R Foundation for Statistical Computing, Vienna, Austria, see http://www.r-project.org). All analyses were performed in R, and figures were produced using the packages ggplot2 (ver. 3.2.1, see /https://cran.r-project.org/web/packages/ggplot2/index.html, accessed 3 September 2019) and ggpubr (ver. 0.2.3, https://cran.r-project.org/web/packages/ggpubr/index.html, accessed 3 September 2019).
Unless indicated otherwise, data are given as the mean ± s.d.
Results
In all, 685 cod were introduced to the tanks at the beginning of the experiment. There was variation in size among the fish in each tank, but there were no differences in length (ANOVA, F11,673 = 0.774, P = 0.666) or weight (ANOVA, F11,673 = 0.908, P = 0.533) among the tanks at the start of the experiment.
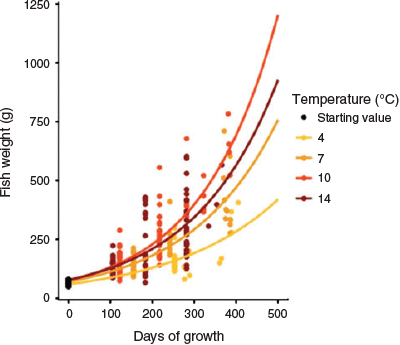
During the experiment, the variation in size increased (Fig. 2), both within tanks and within temperature groups. The lowest growth rate was found for the fish kept at 4°C, whereas the highest growth rate was found for the fish kept at 10°C.
|
The mean δ13C value of the lipid-extracted feed pellets was –21.6 ± 0.4‰ (n = 7) and the mean δ15N value of non-lipid extracted pellets was 9.2 ± 0.2‰ (n = 7).
Otolith nitrogen and carbon analysis
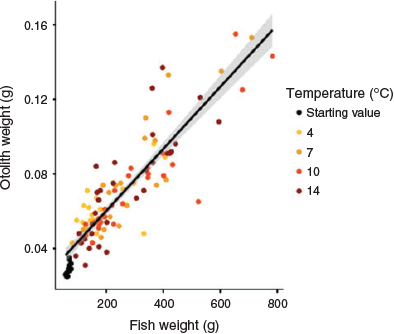
In all, 125 fish were included in the isotope analysis of the otoliths, of which 13 individuals were collected before the temperature-controlled experiment. Otolith weight was significantly related to fish bodyweight (linear regression model, n = 118, t = 20.6, P < 0.001; Fig. 3), and slopes did not differ significantly among temperature groups (ANCOVA: fish weight, F1,100 = 304, P < 0.01; temperature, F3,100 = 1.41, P = 0.245).
|
The values of the otolith SOM δ15N from individual fish sampled before the start of the experiment varied 1.9‰, from 6.7 to 8.6‰. Otolith SOM δ15N values from fish sampled during the experiment ranged from 6.7 to 9.1‰ (Table 1), with most values between the average starting point value of 7.6‰ and the diet value of 9.1‰. Temperature-specific mean values varied between 7.9 and 8.4‰ and, as expected, had shifted towards the diet isotope value. Neither temperature, fish growth nor their interaction significantly affected otolith SOM δ15N values (linear mixed-effects model: temperature, F3,7 = 1.28, P = 0.353; fish growth, F1,103 = 1.11, P = 0.295; Fig. 4; Table 2). However, the tank effect was significant (P < 0.01), indicating that the variation in otolith SOM δ15N values was due to random tank effects. For example, the lower δ15N values shown at 7°C resulted from fish inhabiting the same rearing tank (Tank 7).

|

|
|
The otolith SOM δ13C starting point values ranged from –21.5 to –20.1‰, whereas the δ13C values of fish otoliths sampled during the experiment ranged from –22.7 to –18.6‰ (Table 1). Surprisingly, the values for the 4 and 7°C groups tended to be more positive than the starting values and not to approach the diet isotope value. By contrast, the values for 10 and 14°C were slightly shifted from the starting values towards the diet value. Otolith SOM δ13C values decreased with temperature increases, but increased with fish growth (Fig. 5). A significant random effect was also found in otolith SOM δ13C values (P = 0.015), but it did not mask significant effects of temperature and fish growth on δ13C values (linear mixed-effects model: temperature, F3,7 = 5.61, P = 0.028; fish growth, F1,100 = 9.83, P < 0.01; Fig. 5; Table 2). The δ13C values for the 4 and 7°C groups had significantly higher intercepts (–20.0 and –20.3‰ respectively) than did the other two groups (–21.2 for 10°C and –21.1 for 14°C), suggesting an approximate 1‰ tissue–diet enrichment at the lower temperatures.

|
Muscle and heart isotope analysis
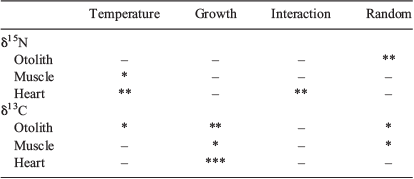
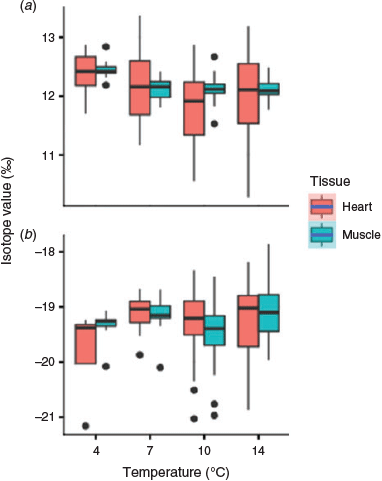
No significant random effect was found for tissue δ15N values (muscle, P = 0.648; heart, P = 0.916). A significant temperature effect, but no fish growth effect, was found for δ15N values in muscle, with values 0.4‰ higher at 4°C than for the other three temperatures (linear mixed-effects model: muscle, temperature, F3,6 = 8.78, P = 0.011; fish growth, F1,98 = 0.113, P = 0.738; Fig. 6; Table 2). An interaction between the two fixed effects was observed in heart tissue (heart, temperature, F3,30 = 4.85, P < 0.01; fish growth, F1,67 = 0.845, P = 0.361; temperature × fish growth, F3,80 = 4.07, P < 0.01), but mean values showed a pattern similar to muscle δ15N, with highest values at 4°C (Fig. 6; Table 2).
|
Fish growth and tanks significantly affected muscle δ13C values (linear mixed-effects model: temperature, F3,9 = 1.76, P = 0.228; fish growth, F1,95 = 4.04, P = 0.047; tanks, P = 0.023), but a significant growth effect was only found for heart δ13C values (linear mixed-effects model: temperature, F3,6 = 3.33, P = 0.094; fish growth, F1,97 = 21.8, P < 0.01; tanks, P = 0.605; Fig. 6; Table 2), hence there is little support for an effect of temperature on δ13C in these tissues.
Discussion
The present study adds to a small body of literature on the effects of temperature on tissue–diet spacing of stable isotopes in fishes, and is the first to evaluate the effect on fish otolith isotope values. In experiments such as this one, there are several drivers potentially affecting the observed tissue isotope values. These can be divided into: (1) drivers that do not affect diet–tissue spacing, including differential contribution of pre-experiment SOM in the otoliths among the individuals and differential assimilation of diet components due to, for example, temperature and growth effects on metabolic demand; and (2) drivers that affect tissue-diet spacing, including differences in amino acid composition between diet and tissues, isotope routeing of amino acids and effects of growth rate and temperature on nitrogen- and carbon-use efficiency. All these drivers may cause variability among individuals, which limits our ability to determine the effect of temperature on tissue–diet isotopic spacing.
Differential contribution of pre-experiment SOM
A caveat in this respect is that our approach did not allow for distinction between otolith material laid down before and during the experiment. It was not possible to estimate the otolith mass at the start of the experiment at the level of the individual fish; hence, a mass balance calculation was not performed. Instead, we assumed that the mean starting otolith mass and isotope values across temperatures were the same, an assumption based on the non-significant differences in mean fish mass across tanks before the experiment. We then used fish growth as a proxy for otolith growth during the experiment in a mixed-model set-up. This approach allowed us to evaluate growth and temperature effects on final isotope values, but did not allow us to reconstruct absolute tissue–diet spacing of the otoliths.
Differential assimilation of diet components
The components of the diet used in the experiment are expected to differ in digestibility and isotope values. Therefore, variations in the incorporation of carbon and nitrogen from the different sources introduce variability in the otolith and tissue isotope values. Heart and muscle values exhibited δ15N values approximately 3‰ higher than those of the bulk diet, implying that bulk diet δ15N values reasonably approximate values of the assimilated protein. By contrast, heart and muscle δ13C values were also nearly 3‰ higher than dietary values, suggesting that a component of the diet, such as wheat, which has low δ13C (Kusche et al. 2018), is not assimilated and thus not incorporated into fish tissue to the same degree as the other ingredients. The extent to which our experimental temperatures influenced the utilisation of the different diet components is unknown, but an increasing energy demand in fast-growing fishes (i.e. those at 10 and 14°C) could lead to increased use of, for example, wheat and explain the low otolith δ13C values in these fish in our experiment.
Differences in tissue amino acid composition
Differences in amino acid composition between the diet and the different consumer tissues may also affect the observed tissue–diet spacing, because individual amino acids exhibit large differences in isotope values (e.g. McMahon et al. 2010). Hüssy et al. (2004) found differences in the amino acid composition of otoliths of fish reared at 10 and 16°C. These differences were explained by differences in the proportion of soluble and insoluble protein fractions between the two groups of fish. In the present study we only analysed the soluble protein fraction; therefore, amino acid differences are not expected to have affected our results.
Isotope routeing of amino acids
Some studies have shown that consumer tissue isotope values fail to conform to the values expected from bulk diet isotope values (Elsdon et al. 2010; McMahon et al. 2010). Differences in the extent of de novo synthesis and direct routeing of dietary amino acids to the different tissues may explain this. The balance between these two sources of amino acids is likely explained by an interaction between metabolic demands and the quality of the diet (Newsome et al. 2014). The diet used in the present experiments was formulated and optimised for the rearing of Atlantic cod; hence, we do not expect that the range of growth rates in this study led to large differences between temperature groups in the balance between de novo synthesis and direct routeing.
Effects of growth rate and temperature on nitrogen- and carbon-use efficiency
The potential effect of temperature on tissue–diet spacing is intricately related to the effects of temperature on growth rates, and hence the efficiency with which nitrogen and carbon are used. High growth rates have been found to require high nitrogen-use efficiency (Carter et al. 1998), which leads to decreased tissue–diet isotopic spacing (Trueman et al. 2005). However, these effects may be affected by actual feeding levels (Focken 2001).
Interpretation of isotope shifts in factorial experiments is difficult because of the above suite of confounding factors. Below, we relate our observations on tissue–diet isotopic spacing to the experienced temperatures while acknowledging the confounding effects of growth.
Trends of otolith isotope values in relation to temperature
We found no evidence of an effect of temperature on the δ15N values of otolith organic matter, but did find support for a weak negative effect of temperature on δ13C values. For muscle and heart tissue, temperature significantly affected δ15N, but not δ13C values, although the absolute differences in the values were <0.6‰ and primarily related to differences between the fish kept at 4°C and those from higher temperature groups.
There are two fundamental differences between the metabolically active tissues, muscle and heart, and the otoliths with regard to the isotope values they record. First, δ15N and δ13C values in cod appear to show very little enrichment from diet to otolith organic matter (Grønkjær et al. 2013; Lueders-Dumont et al. 2018). Second, the otolith material analysed includes the protein deposited both during the experiment and before the experiment. Therefore, the isotope values of heart and muscle are expected to reach equilibrium with the diet over time, whereas in the otoliths the trend of isotope values is expected to: (1) lie between the start point and diet; and (2) be close to the starting isotope values for the fish sampled early in the experiment and then asymptotically move towards diet isotope values in fish sampled later (i.e. fish with greater contributions from otolith material laid down during the experiment).
For otolith δ15N values, most of the values were distributed between the starting and diet values for all temperatures, except for random effects that caused lower values in one tank of the 7°C group. The otolith δ15N values did not show an obvious trend of approaching the dietary value as fish grew. This pattern may result from individual variations and the difference in nitrogen values between the dietary value and values for fish at the beginning of the experiment. Even within a temperature group we found higher variation than among temperatures. Moreover, we were not able to evaluate the actual otolith growth and to what extent this may have been decoupled from the growth of the fish (Mosegaard et al. 1988), causing the lack of relationship. Finally, δ15N starting and diet values were close, which means that otoliths would not change much, and the approach of otolith δ15N values towards dietary values would have been less noticeable.
For δ13C, otolith isotope values from the fish kept at 10 and 14°C remained close to the starting values throughout the experiment. The main reason for this is likely the closeness of the starting and diet values, which differed by 0.9‰ and were only slightly larger than the mean otolith–diet δ13C enrichment of 0.09–0.23‰ observed by Grønkjær et al. (2013). The isotope values of the 4 and 7°C groups are more surprising because the average values shifted ~1.8‰ from the diet values towards the values recorded in the muscle. A plausible mechanism for this is that the faster-growing fish at 10 and 14°C used a larger proportion of the wheat contained in the diet to sustain their higher growth, and therefore better reflected the bulk isotope value of the diet. This has some support in the observation that there was a weak negative relationship (r2 = 0.19) between δ13C and instantaneous growth rate in length across all fish analysed (data not shown). We also speculate that a proportion of amino acids in the otoliths may have originated from turned over tissue (e.g. muscle) instead of being routed directly from the diet. There was significant mortality among the fish in the two low-temperature groups. The fish showed signs of stress, grew more slowly than expected and ate little. Other studies have found that starvation can cause enrichment in both δ13C and δ15N concentrations due to self-catabolism (Doucett et al. 1999; Olive et al. 2003; Martínez del Rio et al. 2009; Doi et al. 2017), but Grønkjær et al. (2013) suggested that the effect may be minimised by the low otolith growth in time of little food intake. Moreover, this effect is expected to also increase δ15N, which was not observed in the present study, which leads us to suggest that differential use of the wheat diet component caused this difference.
Variation among individuals in otolith isotope values complicates the interpretation of the data in relation to temperature effects. This variation may be related to the significant individual-level differences in metabolic performance indicated by the variation in growth rates observed during the experiment, because such differences have been shown to influence tissue–diet isotopic spacing factors. However, for the δ15N data, the standard deviations of the data from the treatments and from the fish sampled before the experiment are similar (Table 1). Hence, there does not appear to have been additional variation introduced during the temperature experiment. Furthermore, the standard deviations are within the range of values obtained from other rearing experiments: for example, muscle values of 0.3 (Trueman et al. 2005), 0.27–0.46 (Barnes et al. 2007), 0.29–0.37 (Sweeting et al. 2007a) and 0.28–1.05 (Sacramento et al. 2016); heart values of 0.37–0.52 (Sweeting et al. 2007a); and otolith values of 0.15–0.31 (Grønkjær et al. 2013).
The standard deviation of δ13C values increased in response to the temperature manipulation (Table 1). For all tissues, there was an effect of growth on the obtained δ13C values (Table 2), indicating that a significant proportion of isotope variation was caused by variation in the absolute growth of the fish. Because our experimental data were obtained during a period of isotopic change v. an equilibrium state (the ‘before’ data), our experimental data had a higher standard deviation. However, in our comparison of δ13C values across temperatures, we used absolute growth as a covariate to tease out the effect of growth. Again we refer to similar experiments and observe that our standard deviations are within the higher range of published values; for example, muscle values of 0.3 (Trueman et al. 2005), 0.47–0.60 (Barnes et al. 2007), 0.25–0.34 (Sweeting et al. 2007b) and 0.03–1.15 (Sacramento et al. 2016); heart values of 0.91–1.02 (Sweeting et al. 2007b); and otolith values of 0.19–0.30 (Grønkjær et al. 2013).
In this study we were not able to separate otolith material laid down before and during the experiment. Recently, a highly sensitive method based on peroxodisulfate oxidation–bacterial conversion of organic material has been used to examine the δ15N values of fish otoliths (Cheng et al. 2018; Lueders-Dumont et al. 2018). This method requires 1/200th the amount needed for traditional combustion-based methods and provides a promising approach to analyse δ15N in the tiny amounts of otolith material laid down after a temperature or diet shift, for example. However, a comparable method is not available for analysing similar small amounts of carbon.
Soft tissue stable isotope enrichment
Soft tissues are widely used in dietary studies of nitrogen and carbon isotope analyses and can provide a good indication of the diet at a given time (Verweij et al. 2008; Elsdon et al. 2010). However, tissue enrichment factors and turnover rates differ among species (Sweeting et al. 2007a, 2007b), environmental temperatures (Bosley et al. 2002; Barnes et al. 2007; Britton and Busst 2018), diets (Ankjærø et al. 2012) and trophic levels of fish (Hussey et al. 2014). For example, muscles isotope values, the most commonly used in diet studies of fish, exhibit a wide range of enrichment factors, ranging from 0.8 to 5.6‰ in δ15N and from –0.39 to 3.7‰ in δ13C, depending on species (Sweeting et al. 2007a, 2007b).
Temperature has been found to have a significant effect on both nitrogen and carbon tissue–diet isotopic spacing in several species (Barnes et al. 2007; Sweeting et al. 2007a, 2007b; Britton and Busst 2018). The effects of temperature on nitrogen fractionation are likely related to: (1) higher metabolic rates at high temperature affecting energy demands and potentially nitrogen-use efficiency; (2) changing metabolic rates affecting nitrogen excretion rates; and (3) self-catabolism in chronically nutritionally stressed fish. Barnes et al. (2007) found a negative relationship between Δδ15N values and temperature (4.41‰ at 11°C and 3.78‰ at 16°C) in white muscles of European sea bass. However, Britton and Busst (2018) found a positive relationship between tissue–diet isotopic spacing and temperature (18 v. 23°C). Britton and Busst (2018) experimented with three species of Cyprinidae, and found significantly higher tissue–diet isotopic spacing at the highest temperature for all tissues analysed (muscle, fin and scale). Sweeting et al. (2007a) tested muscle, heart and liver across temperatures and similarly found an effect of temperature on the incorporation of nitrogen. An apparent effect of temperature on muscle and heart δ15N values was also found in the present study. There was more enrichment in the soft tissues than in otoliths, which is consistent with observations reported by others (Vandermyde and Whitledge 2008; Grønkjær et al. 2013; Lueders-Dumont et al. 2018), and both tissues showed less enrichment in a warmer environment. Muscle tissue–diet isotopic spacing was lower in the warmer environment at 7–14°C (2.9‰) than at 4°C (3.3‰), and heart Δδ15N values were the lowest at 10°C (2.6‰) compared with the other temperature groups (4°C, 3.2‰; 7°C, 2.8‰; 14°C, 2.8‰). Hence, in this study the effect of temperature was limited to the fish kept at 4°C, but the pattern is seen in both tissues and otolith organic material, indicating a real difference between these fish and those kept at higher temperatures with regard to nitrogen dynamics. The fish kept at 4°C grew poorly, and it is likely that the increased nitrogen tissue–diet isotopic spacing is related to nitrogen utilisation efficiency, as suggested by Trueman et al. (2005) in their study of growth and diet–tissue enrichment in Atlantic salmon (Salmo salar).
A consistent effect of temperature on carbon tissue–diet isotopic spacing has been observed in previous studies, in which isotopic spacing increases with increasing temperature (Barnes et al. 2007; Britton and Busst 2018). Although we found differences in δ13C in muscle and heart tissues among temperature groups, the pattern did not represent a systematic change and was not significant. Barnes et al. (2007) suggested that the effect of temperature was due to condition-related variations in lipid content because the effect of temperature disappeared after mathematical lipid correction. A meta-analysis of fasting animals concluded that the starvation effects on soft tissue δ13C were complex and likely involved individual and species-specific differences in lipid content and utilisation (Doi et al. 2017). Similar processes may affect the soft tissue δ13C values observed in this study.
The data from isotope studies examining temperature, food availability and growth rates suggest that the patterns we observed may be more related to temperature effects on growth and physiological conditions than to temperature per se (Trueman et al. 2005, Doi et al. 2017). This also indicates that the effect of temperature is modulated by external factors, such as food availability, and internal factors, such as maturity stage, lipid accumulation and intrinsic growth patterns. The complexity of these interactions, and the fact that the responses are likely to be species specific, does not suggest that a single temperature-enrichment correction factor can be applied. To what extent the inability to correct for temperature effects observed in laboratory settings will affect conclusions drawn from isotope data on wild fishes is uncertain. It will obviously depend on the range of temperatures and the duration of the exposure to different temperatures relative to the turnover rate of the tissue and isotope in question.
The overall aim of the present study was to determine whether there is temperature-dependent variation in the tissue–diet isotopic spacing of nitrogen and carbon in the otolith organic matter, which may bias studies of trophic interactions based on archived otolith samples. The temperature-dependent variation in nitrogen tissue–diet isotopic spacing was not significant. By contrast, the effect of temperature on carbon incorporation into cod otolith organic matter was significant, but the mechanisms underlying this are not clear. Interactions of fish growth, diet use, self-catabolism and other physiological processes likely affected the results we observed. Between- and within-year temperature variations experienced by most cod populations are small compared with the range used in this experiment. The Barents Sea cod population will usually experience a variation in mean temperature of no more than 2°C (Righton et al. 2010), and therefore we do not expect temperature-dependent variation in tissue–diet isotopic spacing to significantly bias observed otolith isotope values and their interpretation with regard to trophic position.
Conflicts of interest
The authors declare that they have no conflicts of interest.
Declaration of funding
This project was financed by the Institution of Marine Research and the European Regional Development Fund (Interreg IVa, ‘MarGen’ Project).
Acknowledgements
The authors thank the staff at Parisvatnet and Matre research stations for expertise and help both before and during the experiment. Thanks to Susanne Vase Petersen, Inge Buss la Cour and Karina Bomholt Oest, Department of Bioscience, Aarhus, Denmark, for help with isotope analyses.
References
Ankjærø, T., Christensen, J. T., and Grønkjær, P. (2012). Tissue-specific turnover rates and trophic enrichment of stable N and C isotopes in juvenile Atlantic cod Gadus morhua fed three different diets. Marine Ecology Progress Series 461, 197–209.| Tissue-specific turnover rates and trophic enrichment of stable N and C isotopes in juvenile Atlantic cod Gadus morhua fed three different diets.Crossref | GoogleScholarGoogle Scholar |
Barnes, C., Sweeting, C. J., Jennings, S., Barry, J. T., and Polunin, N. V. C. (2007). Effect of temperature and ration size on carbon and nitrogen stable isotope trophic fractionation. Functional Ecology 21, 356–362.
| Effect of temperature and ration size on carbon and nitrogen stable isotope trophic fractionation.Crossref | GoogleScholarGoogle Scholar |
Bates, D., Mächler, M., Bolker, B. M., and Walker, S. C. (2015). Fitting linear mixed-effects models using lme4. Journal of Statistical Software 67, 1–48.
| Fitting linear mixed-effects models using lme4.Crossref | GoogleScholarGoogle Scholar |
Bligh, E. G., and Dyer, W. J. (1959). A rapid method of total lipid extraction and purification. Canadian Journal of Biochemistry and Physiology 37, 911–917.
| A rapid method of total lipid extraction and purification.Crossref | GoogleScholarGoogle Scholar | 13671378PubMed |
Bosley, K. L., Witting, D. A., Chambers, R. C., and Wainright, S. C. (2002). Estimating turnover rates of carbon and nitrogen in recently metamorphosed winter flounder Pseudopleuronectes americanus with stable isotopes. Marine Ecology Progress Series 236, 233–240.
| Estimating turnover rates of carbon and nitrogen in recently metamorphosed winter flounder Pseudopleuronectes americanus with stable isotopes.Crossref | GoogleScholarGoogle Scholar |
Britton, J. R., and Busst, G. M. A. (2018). Stable isotope discrimination factors of omnivorous fishes: influence of tissue type, temperature, diet composition and formulated feeds. Hydrobiologia 808, 219–234.
| Stable isotope discrimination factors of omnivorous fishes: influence of tissue type, temperature, diet composition and formulated feeds.Crossref | GoogleScholarGoogle Scholar |
Carter, C. G., Houlihan, D. F., and Owen, S. F. (1998). Protein synthesis, nitrogen excretion and long-term growth of juvenile Pleuronectes flesus. Journal of Fish Biology 53, 272–284.
| Protein synthesis, nitrogen excretion and long-term growth of juvenile Pleuronectes flesus.Crossref | GoogleScholarGoogle Scholar |
Caut, S., Angulo, E., and Courchamp, F. (2009). Variation in discrimination factors (Δ15N and Δ13C): the effect of diet isotopic values and applications for diet reconstruction. Journal of Applied Ecology 46, 443–453.
| Variation in discrimination factors (Δ15N and Δ13C): the effect of diet isotopic values and applications for diet reconstruction.Crossref | GoogleScholarGoogle Scholar |
Cheng, L. C., Shiao, J. C., Hsiao, S. S. Y., and Wang, P. L. (2018). Fractionation of otolith nitrogen stable isotopes measured by peroxodisulfate oxidation–bacterial conversion and isotope ratio mass spectrometry. Rapid Communications in Mass Spectrometry 32, 1905–1910.
| Fractionation of otolith nitrogen stable isotopes measured by peroxodisulfate oxidation–bacterial conversion and isotope ratio mass spectrometry.Crossref | GoogleScholarGoogle Scholar | 30085368PubMed |
Colborne, S. F., Fisk, A. T., and Johnson, T. B. (2017). Tissue-specific turnover and diet–tissue discrimination factors of carbon and nitrogen isotopes of a common forage fish held at two temperatures. Rapid Communications in Mass Spectrometry 31, 1405–1414.
| Tissue-specific turnover and diet–tissue discrimination factors of carbon and nitrogen isotopes of a common forage fish held at two temperatures.Crossref | GoogleScholarGoogle Scholar | 28590512PubMed |
Doi, H., Akamatsu, F., and Gonzalez, A. L. (2017). Starvation effects on nitrogen and carbon stable isotopes of animals: an insight from meta-analysis of fasting experiments. Royal Society Open Science 4, 170633.
| Starvation effects on nitrogen and carbon stable isotopes of animals: an insight from meta-analysis of fasting experiments.Crossref | GoogleScholarGoogle Scholar | 29291128PubMed |
Doucett, R. R., Hooper, W., and Power, G. (1999). Identification of anadromous and nonanadromous adult brook trout and their progeny in the Tabusintac River, New Brunswick, by means of multiple-stable-isotope analysis. Transactions of the American Fisheries Society 128, 278–288.
| Identification of anadromous and nonanadromous adult brook trout and their progeny in the Tabusintac River, New Brunswick, by means of multiple-stable-isotope analysis.Crossref | GoogleScholarGoogle Scholar |
Elsdon, T. S., Ayvazian, S., McMahon, K. W., and Thorrold, S. R. (2010). Experimental evaluation of stable isotope fractionation in fish muscle and otoliths. Marine Ecology Progress Series 408, 195–205.
| Experimental evaluation of stable isotope fractionation in fish muscle and otoliths.Crossref | GoogleScholarGoogle Scholar |
Fischer, G., and Wiencke, C. (1992). Stable carbon isotope composition, depth distribution and fate of macroalgae from the Antarctic Peninsula region. Polar Biology 12, 341–348.
| Stable carbon isotope composition, depth distribution and fate of macroalgae from the Antarctic Peninsula region.Crossref | GoogleScholarGoogle Scholar |
Focken, U. (2001). Stable isotopes in animal ecology: the effect of ration size on the trophic shift of C and N isotopes between feed and carcass. Isotopes in Environmental and Health Studies 37, 199–211.
| Stable isotopes in animal ecology: the effect of ration size on the trophic shift of C and N isotopes between feed and carcass.Crossref | GoogleScholarGoogle Scholar | 11924851PubMed |
Galimov, E. M. (1985). ‘The Biological Fractionation of Isotopes.’ (Academic Press: Orlando, FL, USA.)
Grønkjær, P., Pedersen, J. B., Ankjærø, T., Kjeldsen, H., Heinemeier, J., Steingrund, P., Nilsen, J. M., and Christensen, J. T. (2013). Stable N and C isotopes in the organic matrix of fish otoliths: validation of a new approach for studying spatial and temporal changes in the trophic structure of aquatic ecosystems. Canadian Journal of Fisheries and Aquatic Sciences 70, 143–146.
| Stable N and C isotopes in the organic matrix of fish otoliths: validation of a new approach for studying spatial and temporal changes in the trophic structure of aquatic ecosystems.Crossref | GoogleScholarGoogle Scholar |
Hobson, K. A. (1999). Tracing origins and migration of wildlife using stable isotopes: a review. Oecologia 120, 314–326.
| Tracing origins and migration of wildlife using stable isotopes: a review.Crossref | GoogleScholarGoogle Scholar | 28308009PubMed |
Hussey, N. E., MacNeil, M. A., McMeans, B. C., Olin, J. A., Dudley, S. F. J., Cliff, G., Wintner, S. P., Fennessy, S. T., and Fisk, A. T. (2014). Rescaling the trophic structure of marine food webs. Ecology Letters 17, 239–250.
| Rescaling the trophic structure of marine food webs.Crossref | GoogleScholarGoogle Scholar | 24308860PubMed |
Hüssy, K., Mosegaard, H., and Jessen, F. (2004). Effect of age and temperature on amino acid composition and the content of different protein types of juvenile Atlantic cod (Gadus morhua) otoliths. Canadian Journal of Fisheries and Aquatic Sciences 61, 1012–1020.
| Effect of age and temperature on amino acid composition and the content of different protein types of juvenile Atlantic cod (Gadus morhua) otoliths.Crossref | GoogleScholarGoogle Scholar |
Kusche, H., Hillgruber, N., Rößner, Y., and Focken, U. (2018). The effect of different fish feed compositions on δ13C and δ15N signatures of sea bass and its potential value for tracking mariculture-derived nutrients. Isotopes in Environmental and Health Studies 54, 28–40.
| The effect of different fish feed compositions on δ13C and δ15N signatures of sea bass and its potential value for tracking mariculture-derived nutrients.Crossref | GoogleScholarGoogle Scholar | 28819995PubMed |
Kuznetsova, A., Brockhoff, P. B., and Christensen, R. H. B. (2017). lmerTest package: tests in linear mixed effects models. Journal of Statistical Software 82, 1–26.
| lmerTest package: tests in linear mixed effects models.Crossref | GoogleScholarGoogle Scholar |
Lueders-Dumont, J. A., Wang, X. T., Jensen, O. P., Sigman, D. M., and Ward, B. B. (2018). Nitrogen isotopic analysis of carbonate-bound organic matter in modern and fossil fish otoliths. Geochimica et Cosmochimica Acta 224, 200–222.
| Nitrogen isotopic analysis of carbonate-bound organic matter in modern and fossil fish otoliths.Crossref | GoogleScholarGoogle Scholar |
Martínez del Rio, C., Wolf, N., Carleton, S. A., and Gannes, L. Z. (2009). Isotopic ecology ten years after a call for more laboratory experiments. Biological Reviews of the Cambridge Philosophical Society 84, 91–111.
| Isotopic ecology ten years after a call for more laboratory experiments.Crossref | GoogleScholarGoogle Scholar |
McMahon, K. W., Fogel, M. L., Elsdon, T. S., and Thorrold, S. R. (2010). Carbon isotope fractionation of amino acids in fish muscle reflects biosynthesis and isotopic routing from dietary protein. Journal of Animal Ecology 79, 1132–1141.
| Carbon isotope fractionation of amino acids in fish muscle reflects biosynthesis and isotopic routing from dietary protein.Crossref | GoogleScholarGoogle Scholar | 20629794PubMed |
McMahon, K. W., Fogel, M. L., Johnson, B. J., Houghton, L. A., and Thorrold, S. R. (2011). A new method to reconstruct fish diet and movement patterns from δ13C values in otolith amino acids. Canadian Journal of Fisheries and Aquatic Sciences 68, 1330–1340.
| A new method to reconstruct fish diet and movement patterns from δ13C values in otolith amino acids.Crossref | GoogleScholarGoogle Scholar |
Moore, J. W., and Semmens, B. X. (2008). Incorporating uncertainty and prior information into stable isotope mixing models. Ecology Letters 11, 470–480.
| Incorporating uncertainty and prior information into stable isotope mixing models.Crossref | GoogleScholarGoogle Scholar | 18294213PubMed |
Morrongiello, J. R., Thresher, R. E., and Smith, D. C. (2012). Aquatic biochronologies and climate change. Nature Climate Change 2, 849–857.
| Aquatic biochronologies and climate change.Crossref | GoogleScholarGoogle Scholar |
Mosegaard, H., Svedang, H., and Taberman, K. (1988). Uncoupling of somatic and otolith growth-rates in Arctic char (Salvelinus alpinus) as an effect of differences in temperature response. Canadian Journal of Fisheries and Aquatic Sciences 45, 1514–1524.
| Uncoupling of somatic and otolith growth-rates in Arctic char (Salvelinus alpinus) as an effect of differences in temperature response.Crossref | GoogleScholarGoogle Scholar |
Newsome, S. D., Wolf, N., Peters, J., and Fogel, M. L. (2014). Amino acid δ13C analysis shows flexibility in the routing of dietary protein and lipids to the tissue of an omnivore. Integrative and Comparative Biology 54, 890–902.
| Amino acid δ13C analysis shows flexibility in the routing of dietary protein and lipids to the tissue of an omnivore.Crossref | GoogleScholarGoogle Scholar | 25104856PubMed |
Olive, P. J. W., Pinnegar, J. K., Polunin, N. V. C., Richards, G., and Welch, R. (2003). Isotope trophic-step fractionation: a dynamic equilibrium model. Journal of Animal Ecology 72, 608–617.
| Isotope trophic-step fractionation: a dynamic equilibrium model.Crossref | GoogleScholarGoogle Scholar |
Post, D. M. (2002). Using stable isotopes to estimate trophic position: models, methods, and assumptions. Ecology 83, 703–718.
| Using stable isotopes to estimate trophic position: models, methods, and assumptions.Crossref | GoogleScholarGoogle Scholar |
Post, D. M., Layman, C. A., Arrington, D. A., Takimoto, G., Quattrochi, J., and Montana, C. G. (2007). Getting to the fat of the matter: models, methods and assumptions for dealing with lipids in stable isotope analyses. Oecologia 152, 179–189.
| Getting to the fat of the matter: models, methods and assumptions for dealing with lipids in stable isotope analyses.Crossref | GoogleScholarGoogle Scholar | 17225157PubMed |
Power, M., Guiguer, K. R. R. A., and Barton, D. R. (2003). Effects of temperature on isotopic enrichment in Daphnia magna: implications for aquatic food-web studies. Rapid Communications in Mass Spectrometry 17, 1619–1625.
| Effects of temperature on isotopic enrichment in Daphnia magna: implications for aquatic food-web studies.Crossref | GoogleScholarGoogle Scholar | 12845588PubMed |
Righton, D. A., Andersen, K. H., Neat, F., Thorsteinsson, V., Steingrund, P., Svedang, H., Michalsen, K., Hinrichsen, H. H., Bendall, V., Neuenfeldt, S., Wright, P., Jonsson, P., Huse, G., van der Kooij, J., Mosegaard, H., Hussy, K., and Metcalfe, J. (2010). Thermal niche of Atlantic cod Gadus morhua: limits, tolerance and optima. Marine Ecology Progress Series 420, 1–13.
| Thermal niche of Atlantic cod Gadus morhua: limits, tolerance and optima.Crossref | GoogleScholarGoogle Scholar |
Sacramento, P. A., Manetta, G. I., and Benedito, E. (2016). Diet-tissue discrimination factors (Δ13C and Δ15N) and turnover rate in somatic tissues of a neotropical detritivorous fish on C3 and C4 diets. Journal of Fish Biology 89, 213–219.
| Diet-tissue discrimination factors (Δ13C and Δ15N) and turnover rate in somatic tissues of a neotropical detritivorous fish on C3 and C4 diets.Crossref | GoogleScholarGoogle Scholar | 26728338PubMed |
Shiao, J.-C., Shirai, K., Tanaka, K., Takahata, N., Sano, Y., Hsiao, S. S.-Y., Lee, D.-C., and Tseng, Y.-C. (2018). Assimilation of nitrogen and carbon isotopes from fish diets to otoliths as measured by nanoscale secondary ion mass spectrometry. Rapid Communications in Mass Spectrometry 32, 1250–1256.
| Assimilation of nitrogen and carbon isotopes from fish diets to otoliths as measured by nanoscale secondary ion mass spectrometry.Crossref | GoogleScholarGoogle Scholar | 29781092PubMed |
Sirot, C., Grønkjær, P., Pedersen, J. B., Panfili, J., Zetina-Rejon, M., Tripp-Valdez, A., Ramos-Miranda, J., Flores-Hernandez, D., Sosa-Lopez, A., and Darnaude, A. M. (2017). Using otolith organic matter to detect diet shifts in Bardiella chrysoura, during a period of environmental changes. Marine Ecology Progress Series 575, 137–152.
| Using otolith organic matter to detect diet shifts in Bardiella chrysoura, during a period of environmental changes.Crossref | GoogleScholarGoogle Scholar |
Sweeting, C. J., Barry, J., Barnes, C., Polunin, N. V. C., and Jennings, S. (2007a). Effects of body size and environment on diet–tissue δ15N fractionation in fishes. Journal of Experimental Marine Biology and Ecology 340, 1–10.
| Effects of body size and environment on diet–tissue δ15N fractionation in fishes.Crossref | GoogleScholarGoogle Scholar |
Sweeting, C. J., Barry, J. T., Polunin, N. V. C., and Jennings, S. (2007b). Effects of body size and environment on diet–tissue δ13C fractionation in fishes. Journal of Experimental Marine Biology and Ecology 352, 165–176.
| Effects of body size and environment on diet–tissue δ13C fractionation in fishes.Crossref | GoogleScholarGoogle Scholar |
Trueman, C. N., McGill, R. A. R., and Guyard, P. H. (2005). The effect of growth rate on tissue–diet isotopic spacing in rapidly growing animals. An experimental study with Atlantic salmon (Salmo salar). Rapid Communications in Mass Spectrometry 19, 3239–3247.
| The effect of growth rate on tissue–diet isotopic spacing in rapidly growing animals. An experimental study with Atlantic salmon (Salmo salar).Crossref | GoogleScholarGoogle Scholar | 16220502PubMed |
Vander Zanden, M. J., Cabana, G., and Rasmussen, J. B. (1997). Comparing trophic position of freshwater fish calculated using stable nitrogen isotope ratios (δ15N) and literature dietary data. Canadian Journal of Fisheries and Aquatic Sciences 54, 1142–1158.
| Comparing trophic position of freshwater fish calculated using stable nitrogen isotope ratios (δ15N) and literature dietary data.Crossref | GoogleScholarGoogle Scholar |
Vanderklift, M., and Ponsard, S. (2003). Sources of variation in consumer-diet δ15N enrichment: a meta-analysis. Oecologia 136, 169–182.
| Sources of variation in consumer-diet δ15N enrichment: a meta-analysis.Crossref | GoogleScholarGoogle Scholar | 12802678PubMed |
Vandermyde, J. M., and Whitledge, G. W. (2008). Otolith δ15N distinguishes fish from forested and agricultural streams in southern Illinois. Journal of Freshwater Ecology 23, 333–336.
| Otolith δ15N distinguishes fish from forested and agricultural streams in southern Illinois.Crossref | GoogleScholarGoogle Scholar |
Verweij, M. C., Nagelkerken, I., Hans, I., Ruseler, S. M., and Mason, P. R. D. (2008). Seagrass nurseries contribute to coral reef fish populations. Limnology and Oceanography 53, 1540–1547.
| Seagrass nurseries contribute to coral reef fish populations.Crossref | GoogleScholarGoogle Scholar |