

Assessing the contributions of hunting tourism to the South African economy: a post-covid analysis
Peet van der Merwe A * and Andrea Saayman B
A
B
Abstract
Previous research has acknowledged that hunting tourism significantly contributes to South Africa’s economy. The literature review revealed that most of the research in South Africa was conducted before the advent of COVID-19.
This research endeavour, pioneering in its scope, sought to ascertain the collective economic significance of both international and local hunters in South Africa and, consequently, to delineate the economic impact of the hunting industry in South Africa by examining the post-COVID expenditure patterns of both international and domestic hunting tourists within the country.
A quantitative research approach involving surveys amongst both national and international hunting tourists was adopted. The South African Social Accounting Matrix (SAM) was used in the multiplier analysis.
The result revealed that hunting tourism’s total impact on the South African economy is USD2.5 billion. Hunting represents a production multiplier of 2.97, indicating that for every USD1 spent by hunting tourists, production increases by an additional USD1.97. Agriculture, trade, accommodation, and personal services are the industry sectors most dependent on hunting tourism.
In conclusion, this research determined the collective economic significance of hunting tourism in South Africa.
The implication is that hunting tourism directly and indirectly supports and expands job creation in rural areas; indirectly, it contributes to conservation initiatives and facilitates job creation in South Africa.
Keywords: consumptive tourism, economic impact, economy, hunting tourism, post-covid, rural areas, South Africa, wildlife tourism.
Introduction
Nature is one of the most prevalent drawcards worldwide for millions of tourists. From a theoretical perspective, tourism that is conducted in nature forms part of natural area tourism (Newsome et al. 2005, p. 14), which consists of four pillars: ecotourism, wildlife tourism, geotourism, and adventure tourism. Ecotourism consists of key aspects such as responsible travel, natural areas, conserving of the environment, sustainability and well-being of local communities, interpretation, and education (staff and guests) (TIES 2015). Wildlife tourism is a component of nature-based tourism that is based on non-domesticated animals, whether in captivity or their natural habitats (Higginbottom 2004). Dowling (2011) defines geotourism as natural area tourism focusing on geology and landscape. McKay (2014, p. 53) defines adventure tourism as the ‘sale of a guided adventurous trip or activity where there is some risk, uncertainty and challenge involved’. In adventure tourism, the tourists are actively and physically involved, and most people experience strong emotions, such as fear and excitement, whilst participating in adventure activities. Each of these pillars offers a truly unique experience to the tourists who engage in it. One similarity of the four pillars is that all tourism activities occur in the natural environment (Fennell 2015). The current research focuses on the wildlife tourism pillar of natural area tourism.
According to Higginbottom (2004), wildlife tourism involves activities centred on encounters with non-domesticated animals. Within the South African context, this implies encounters with South African wild animals such as springbok (Antidorcas marsupialis), kudu (Tragelaphus strepsiceros), African elephant (Loxodonta africana), and lion (Panthera leo).
These encounters can occur in the animals’ natural environments, for example in game reserves, game farms/game ranches, provincial and national parks, or in captivity, such as in the Pretoria and Johannesburg zoos. Wildlife tourism activities can be broadly categorised as non-consumptive and consumptive. Non-consumptive activities refer to those that do not involve the direct use of animals, such as photographic safaris where tourists engage in wildlife photography. Conversely, hunting and fishing activities, do use natural resources in a consumptive way (Higginbottom 2004).
In South Africa, wildlife tourism is facilitated by two leading players: (1) government-owned conservation areas, for example, South African National Parks or Provincial Parks, and (2) privately-owned conservation areas, known as game farms/ranches/and or game reserves (for the purpose of this research they will be referred to as private game reserves) (Suich et al. 2009; Child et al. 2012). Unlike most other African countries where the government manages all wildlife, the constitution of South Africa allows for private ownership and management of wildlife through the Game Theft Act 105 of 1991 (Government of South Africa 1991; Suich et al. 2009, p. 189; Child et al. 2012). Ownership of specific species is only granted for properties that are adequately fenced to contain specific species. Thus, ownership is linked to adequate enclosure of the property, and not all species can be owned and not on just any property. This legislation results in people possessing land with their own wildlife on it. This legislation contributes to the diverse wildlife tourism offerings in South Africa, ranging from photographic safaris and ecotourism to hunting and adventure tourism.
The private wildlife industry established itself in South Africa as early as in the 1950s (Carruthers 2008, p. 165) and became more widespread during the 1970s (Beinart 2003, p. 386; Brink et al. 2011). During the 1990s, the private wildlife industry experienced extraordinary growth mainly due to landowners discovering the value and potential gains from wildlife. Most of the land owned by the private wildlife industry today is located on former agricultural land that previously required the active eradication of wild animals to the benefit of domesticated animals such as cattle, sheep and goats; some of this land is now actively used to (re)introduce wild animals to create new wilderness areas (rewilding) that cater for both the international and local wildlife tourism markets (Pasmans and Hebinck 2017).
According to a report by ABSA (Amalgamated Banks of South Africa), one of the leading banks in South Africa, the land surface utilised by the private wildlife industry in South Africa grew at an average annual rate of 5.6% between 1991 and the mid-2000s (ABSA 2015). In 2003, it was estimated that South Africa had approximately 5000 privately-owned game reserves and more than 4000 mixed game and livestock farms (meaning that the farmers engage with wildlife and domesticated animals or crop farming on the same land) (ABSA 2003). In 2005, the number of farms converted to private game reserves increased to an estimated 9000 game reserves (Patterson and Khosa 2005), with a total service area of 20.5 million hectares (NAMC 2006). This is larger than the eight million hectares of state-owned conservation areas, including national parks (19 national parks, with Kruger National Park covering 2 million hectares of land alone) and provincial parks (100 provincial parks) (ABSA 2003, 2015). The number of animals, an estimated 20 million plus, owned by the private wildlife industry is about three to four times greater than the number of animals found in government-protected areas (six to eight million animals) (NAMC 2006; Dry 2015).
In their research conducted on South Africa’s private wildlife ranches (game farms, game reserves, private protected areas), Taylor et al. (2021) indicated that these private lands have, on average, 40 herbivore species. In comparison to 54 state-owned protected areas, private land had significantly higher species richness, with more threatened species. Their research indicated that private land has an estimated 4.66–7.25 million head of game, representing one of the few examples on Earth where indigenous wildlife is thriving and demonstrating how sustainable use (hunting) can lead to rewilding.
According to Cloete et al. (2015) and Von Solms (2019), the private wildlife industry in South Africa is built upon four specified pillars. These pillars include (1) live game trade, which involves buying and selling live wild animals; (2) hunting, encompassing international and domestic hunting tourists; (3) ecotourism, which refers to wildlife-related tourism experiences or photographic safaris; and (4) processed game products, which involves utilising game meat and other derived products. Of the four pillars, hunting is considered to be the pillar that generates the most income for the owners (Von Solms 2019). In South Africa, the hunting market consists of two market segments: international and domestic hunting tourists (van der Merwe et al. 2013).
Matilainen and Keskinarkaus (2009) define hunting tourism ‘as a form of tourism, where a person travels outside his/her municipality of residence for the purpose of hunting’. This definition encapsulates both domestic and international hunting tourists. Hunting does not have to be the only purpose of the trip; though it should be a central element thereof. Matilainen and Keskinarkaus (2009) further add that hunting is typically a rural activity, and therefore, utilising its resources potentially provides business opportunities and external income for rural communities. Van der Merwe and Du Plessis (2014) define the domestic hunting market, also referred to as biltong hunters, or sometimes also referred to as meat hunters, as a cultural activity during which wildlife is hunted. This can be done by rifle, bow, or similar weapon to produce a variety of products such as meat (venison) products, biltong, droëwors (dry sausages) and salami. This is mainly for personal consumption.
The international hunting market is defined as the hunting of wildlife. This can be done with a rifle, bow, or a similar weapon. Hunting is done primarily for horns [measured according to Rowland Ward (longest horn) and Safari Club International (a combination of the two horns and circumference)] and skin, which are subsequently displayed as trophies (van der Merwe and Du Plessis 2014). Lindsey et al. (2007, p. 456) add to this and define international hunting tourists as paying tourists who typically select animals with exceptional physical attributes (large horns, tusks, body size or scull length), usually in the company of a professional hunting guide (PH – Professional Hunter).
Fischer et al. (2013) divides the functions of hunting into three categories: ecological, economic, and socio-cultural. They define the functions as the provision of goods and services, regardless of whether these are commodities or non-commodities. Fischer et al. (2013) also state that the economic functions of hunting include, for example, both hunting for subsistence and hunting to obtain income from selling game and trophies, as well as the sale of hunting opportunities, i.e. hunting tourism. The term socio-cultural is used in a broader context and includes non-market values, social capital, social status and impacts on quality of life. Ecological impacts refer to the relationship of hunting to the ecology of a system, such as population management. Previous research acknowledged that hunting is a significant economic activity that contributes to the South African economy (van der Merwe and Saayman 2005; Lindsey et al. 2007; van der Merwe et al. 2013, 2014; Safari Club International Foundation (SCI) 2015; Saayman et al. 2018). However, a closer look at the existing research reveals that these studies were conducted before the advent of COVID-19. van der Merwe et al. (2021a) showed that COVID-19 substantially impacted South Africa’s private wildlife industry, with losses amounting to approximately ZAR6.7 billion (USD347 million). Clements et al. (2022) researched lessons learned from COVID-19 in wildlife ranching. They found that land with more diverse activities and exceptionally mixed wildlife–agriculture systems lost less revenue, shifting their activities. Game ranches focusing on international ecotourism and trophy hunting were heavily impacted and lost more income. COVID-19 had a transformative impact on the tourism industry, particularly in South Africa, where visitation to natural areas has increased since the pandemic. This research aims to evaluate whether hunting tourism in South Africa has rebounded and regained its economic significance as a meaningful contributor to the country’s green economy in the post-COVID-19 period (Baldus and Cauldwell 2004; Pack et al. 2017).
This pioneering research aims to simultaneously assess the economic significance of both international and local hunting tourists in South Africa—a first of its kind. Consequently, the study seeks to delineate the economic impact of the hunting industry in South Africa by examining the post-COVID expenditure patterns of both international and domestic hunting tourists within the country. The findings of this study are anticipated to underscore the economic importance of hunting in South Africa, providing a valuable perspective on the contribution of the industry to the economic landscape of the region after COVID-19.
Literature review
Since the United Nations Tourism Organisation (UNWTO) defines tourism as any activity that involves a person spending more than 24 h outside of their home location, hunting also falls within this definition. Hunting tourists travel to areas outside of their usual location, and in doing so, they spend money within a new location. This increase in money within an area because of tourism is a stimulus for economic activity in the area. The seminal work carried out by Archer (1977) on tourism multipliers has led to increased research on the impact of tourism on the economy. The application of economic impact studies in tourism, in the case of this study of wildlife tourism, is especially useful in informing decisions regarding tourism development (Kottke 1988; Saayman and Saayman 2014).
The term ‘economic impact’ has sometimes been misinterpreted and is often used as a synonym for economic value, and economic significance. For clarity, this study will briefly distinguish between these concepts. Economic value pertains to the ‘total societal benefit’ of a tourism attraction or event (Moore et al. 1994, p. 63). According to Barget and Gouguet (2007), the complete economic value of a natural tourism attraction (for example, Kruger National Park) comprises both use and non-use values, with the latter introduced by Krutilla (1967). The non-use value, also termed intrinsic or existence value, is defined as ‘the utility a person derives from knowing that the park exists’ (Barget and Gouguet 2007, p. 170). The use value encompasses both the direct benefits gained from utilizing the resource, such as the enjoyment experienced by visitors to the natural area, and its broader significance, including the potential for future use and its preservation for future generations. The option value represents the utility derived from potential future benefits associated with using the resource and the legacy value. Non-use values are also referred to as passive use or existence values. In other circumstances, these values are referred to as intrinsic values because they are embedded in the resource itself. There is no straightforward consensus on which categories of non-use values should be included in an economic assessment (Andersson et al. 2004).
Secondly, economic impact analysis estimates changes in regional spending, output, income, and employment due to tourism (Tyrrell and Johnston 2006, p. 3). The impact originates from increased spending by tourists in a region; therefore, only non-local tourist spending is included in an economic impact analysis. It is an ex-post analysis, as Saayman and Saayman (2014) highlighted, that the total impact is the sum of the direct, indirect and induced effects that eminate from the expenditure of ‘real visitors’ (Stynes 1999).
Conversely, economic significance measures ‘the direct economic expenditures by all types of visitors and estimates the economic contribution … in the local community’ due to the tourism activity (Warnick et al. 2012). The economic significance of hunting or any other tourism activity quantifies the loss in economic activity if that activity did not occur. This perspective provides valuable information for decision-making in situations involving trade-offs, as Crompton (2006) emphasised. The relevance of this approach becomes particularly apparent when considering the spending of local hunters in the analysis.
In both economic impact and significance analysis, the initial expenditure by tourists (in this case hunting tourists) represents the initial stimulus that leads to an increase in economic activity. As the money circulates through the economy, it generates additional production and income. The multiplier is the ratio of the total change in economic activity relative to the initial change in spending.
Various authors have estimated the economic impact, value, contribution, and significance of hunting tourists within the hunting tourism sphere. The ensuing tables categorise these studies into three distinct groups: those conducted outside Africa, within Africa, and specifically within South Africa. In the realm outside of Africa, our analysis uncovered seven pertinent studies conducted in renowned hunting tourism destinations such as the United States of America, Finland, Sweden, Iceland, Scotland, Serbia, and Canada. These studies, including works by Grado et al. (2001), Matilainen and Keskinarkaus (2009), Munn et al. (2010), Arnett and Southwick (2015), Matilainen et al. (2016), Pešić (2021), and Kupren and Hakuć-Błażowska (2021), underscored the pivotal role of hunting tourism in contributing to the economy, job creation, and infrastructure development in their respective countries (Table 1).
| Author and year | Title | Summary | |
|---|---|---|---|
| Grado et al. (2001) | Economic impacts of waterfowl hunting on public lands and at private lodges in the Mississippi Delta | The economic impacts derived from waterfowl hunting expenditures reached $719,016 for the 1998–99 waterfowl hunting season. Extrapolating these findings to the entire state, the estimated total economic impact of waterfowl hunting would be $27.4 million. | |
| Matilainen and Keskinarkaus (2009) | The economic role of hunting tourism: examples from Northern areas | The objective of this report was to present information through case studies from five northern countries: Finland, Sweden, Iceland, Scotland, and Canada. Each case study outlines its economic significance within a national or regional context. Instead of offering precise figures, these cases depict the scale of the economic influence. | |
| Munn et al. (2010) | Economic impact of fishing, hunting, and wildlife-associated recreation expenditures on the Southeast U.S. regional economy: an input-output analysis | The study’s results present both absolute figures and comparisons to the Southeast regional economy and nationwide wildlife expenditures. In 2006, wildlife recreationists in the Southeast spent $33 billion, leading to $11 billion in indirect impacts and an additional $9.6 billion in induced impacts. These wildlife recreational expenditures contributed to 0.7% of regional employment and gross output in the southeast. | |
| Arnett and Southwick (2015) | Economic and social benefits of hunting in North America | The research highlights the significant economic contributions of American hunters and Canadian nature recreationists. With 13.7 million American hunters spending over $38.3 billion annually and 2.1 million Canadian nature recreationists spending $1.8 billion, these activities generate substantial revenue. Additionally, hunting supports numerous jobs and contributes billions in tax revenue in both countries. The financial support from hunters plays a crucial role in conserving wildlife and habitats, establishing a vital social and economic foundation for future generations. | |
| Matilainen et al. (2016) | The economic significance of hunting tourism in East Lapland, Finland | In East Lapland, the economic impact of hunting tourism is noteworthy, even though there are only a few hunting tourism companies in the area. Specifically, hunting tourism services relying on small-game licences which contributed €5.86 million to East Lapland’s economy in 2008. This outcome is primarily influenced by the many independent licensed hunters who chose to visit the region. | |
| Pešić (2021) | Hunting tourism as a factor for economic development of hunting associations on the territory of the city of Leskovac | This study examines the impact of hunting tourism on the development of hunting associations in the City of Leskovac, Serbia. Most hunters were foreign tourists, constituting 84.50% (2017), 87.1% (2018), and 89.8% (2019). Revenue increased by 2.3% in 2018 and 22.6% in 2019, with investments rising from 20.1% in 2018 to 38.8% in 2019. Funds allocated for wildlife procurement also increased significantly, demonstrating the importance of hunting and hunting tourism for habitat conservation, environmental protection, and the economic development of hunting associations and their operating territories. | |
| Kupren and Hakuć-Błażowska (2021) | Profile of a modern hunter and the socio-economic significance of hunting in Poland as compared to european data | In the European Union (EU) alone, hunting is believed to have an approximate value of €16 billion and is responsible for creating 100–120 thousands of jobs. Recent studies conducted in specific EU countries and the diverse range of services offered by the hunting sector suggest that these values might be significantly higher. |
Within Africa, excluding South Africa, the literature review uncovered six studies, primarily concentrated in Namibia, with a couple in Tanzania. Once again, parallel findings to those outside of Africa were evident, as reflected in the research conducted by Baldus and Cauldwell (2004), Samuelsson and Stage (2007), Lindsey et al. (2007), Child et al. (2012), Naidoo et al. (2016), and Humavindu and Barnes (2003). These studies consistently affirm that hunting is a significant revenue source for host countries, bestows benefits upon communities in rural areas, and plays a crucial role in contributing to African conservation efforts (Table 2).
| Africa | |||
|---|---|---|---|
| Author and year | Title | Summary | |
| Baldus and Cauldwell (2004) | Tourist hunting and its role in the development of wildlife management areas in Tanzania | Hunting is a significant revenue source for many Wildlife Management Areas. It is crucial to optimise hunting revenues to maximise community benefits through the approved sharing schemes. | |
| Samuelsson and Stage (2007) | The size and distribution of the economic Impacts of Namibian hunting tourism | The income generated by hunting tourism and the distribution of this income are analysed using a recently developed Social Accounting Matrix (SAM). In aggregate, an extra N$ in spending by survey respondents translates into approximately one extra N$ in national income, and an average survey respondent’s spending raised overall national income by an amount corresponding to two to three years’ income for an average Namibian. | |
| Lindsey et al. (2007) | Economic and conservation significance of the trophy hunting industry in sub-Saharan Africa | Trophy hunting occurs in 23 African countries, with the primary industries concentrated in southern Africa and Tanzania. A minimum of 1,394,000 square kilometres is dedicated to trophy hunting in sub-Saharan Africa, surpassing the expanse covered by national parks. This form of hunting plays a crucial role in African conservation efforts by establishing economic incentives across extensive regions. These incentives extend to areas that may not be suitable for alternative wildlife-based land uses, such as photographic ecotourism. | |
| Child et al. (2012) | The economics and institutional economics of wildlife on private land in Africa | Over the past 60 years, wildlife has evolved into a crucial and economic viable land use option, generating more jobs and economic growth than conventional land uses under the right ecological and institutional circumstances. The success of this model requires devolution of ownership from government to communities in Africa’s communal lands, alongside democratic and effective organisational development within these communities. The emergence of wildlife as a viable option from proactive policy-making and private sector entrepreneurship challenging postcolonial norms. By devolving ownership to landholders, encouraging sustainable commercial uses, and reducing regulatory burdens, the value of wildlife increased significantly, leading to habitat recovery. However, centralised and non-commercial approaches have seen declines in wildlife populations | |
| Naidoo et al. (2016) | Complementary benefits of tourism and hunting to communal conservancies in Namibia | Tourism and hunting both generate substantial revenues for communities and private operators in Africa, but few studies have quantitatively examined the trade-offs and synergies that may result from these two activities. | |
| Humavindu and Barnes (2003) | Trophy hunting in the Namibian economy: an assessment | Trophy hunting generated at least N$134 million (USD19.6 million) in direct expenditures or gross output. Gross value added directly attributable to the industry was estimated at some N$ 63 million (USD9.2 million), and hunting constitutes at least 14% of the total tourism sector and a significant component of the Namibian economy. | |
In the context of South Africa, our review identified six pertinent studies, specifically those conducted by van der Merwe and Saayman (2003), van der Merwe et al. (2013, 2014), Saayman et al. (2011a, 2011b, 2018) and Taylor et al. (2020), primarily focusing on the economic value and contribution of hunting. These studies delved into distinct hunter segments, namely international and domestic hunting tourists. Notably, none of the studies simultaneously addressed both segments of hunting tourists but rather opted for separate examinations. Furthermore, those studies that explored the combined economic impact of international and domestic hunting tourists were limited to specific provinces. All of these studies were carried out prior to COVID-19 (Table 3).
| Author and year | Title | Summary | |
|---|---|---|---|
| van der Merwe and Saayman (2003) | Determining the economic value of game farm tourism | This paper showed that game farm tourism has a significant economic value, as seen from the 2000 statistics: Hunting (trophy and biltong) ZAR568 million, game sales R180 million, game products R20 million, ecotourism R106 million. Over and above the fact that game farm tourism in South Africa generated approximately R874 million, the 7000 game farms also employ approximately 63,000 people. | |
| van der Merwe et al. (2013) | The determinants of spending by biltong hunters | This research indicated that the economic contribution of biltong hunting is just over R3 billion (USD500 million) per season. | |
| Saayman et al. (2011a) | The economic impact of hunting in the Northern Cape province | In 2007, hunting in the Northern Cape province had a direct economic impact, surpassing R696.1 million, leading to a total economic impact of ZAR774.3 million with a multiplier effect of 1.11. Approximately 9072 jobs, including those directly involved, were estimated to depend on hunting, highlighting its significance in the province’s tourism industry. | |
| Saayman et al. (2011c) | The impact of hunting for biltong purposes on the SA economy | The contribution to real GDP is estimated to be in excess of R6 billion, with thousands of jobs created by increased activities/services. In addition, the related improvements to the country’s infrastructure, especially the transport sector, will benefit productivity in the longer term and lead to further increases in GDP. | |
| van der Merwe et al. (2014) | The economic impact of hunting: a regional approach | The research employed economic multipliers, input-output analysis, and associated modelling techniques utilising input-output (supply-use) tables and social accounting matrices (SAM). Notably, the outcomes varied substantially among the three provinces, with Limpopo experiencing the most significant impact at ZAR2.6 billion, while the Free State exhibited the highest multiplier of 2.08. Factors such as the geographical distribution of game farms, the number of farms per province, and the diversity of available species played crucial roles in determining the extent of the economic impact of hunters, surpassing traditional determinants in economic impact analysis. | |
| Saayman et al. (2018) | The economic impact of trophy hunting in the south African wildlife industry | Trophy hunters contribute USD250 million annually to this country’s economy. Through multiplier analysis utilising the Social Account Matrix (SAM) of South Africa, the study disclosed that trophy hunting annually adds over USD341 million to the South African economy, fostering more than 17,000 employment opportunities. | |
| Taylor et al. (2020) | Jobs, game meat and profits: The benefits of wildlife ranching on marginal lands in South Africa | The research showed that revenues were higher on wildlife-only properties than on livestock farms, but we were unable to compare the profitability of wildlife and livestock due to data gaps for livestock. Profits from WBLUs were highly variable, while mean return on investment (ROI) was 0.068. Wildlife properties employed more people per unit area than livestock farms, properties conducting ecotourism employed more than twice as many people as non-ecotourism properties, and biltong hunting properties employed 50% fewer people than non-biltong hunting properties. |
In the summary in Table 3, it is evident that the most recent study in this domain was conducted by Saayman et al. (2018), concentrating solely on international hunter spending. Importantly, all of these studies were conducted before the onset of the COVID-19 pandemic, with some dating back more than a decade. This temporal context underscores the opportunity for subsequent research, especially in the aftermath of COVID-19, to provide updated insights and a comprehensive understanding of the evolving dynamics in the hunting tourism sector in South Africa.
Method
A quantitative research approach involved a survey amongst national and international hunting tourists and an analysis of the data obtained through the surveys. Multiplier analysis was used to determine the economic contribution of visitor spending. The surveys and the analysis are subsequently explained.
Population, sampling method and sample size
The target population for this study was the hunting fraternity consisting of hunting tourists, which falls under one overarching body, the Sustainable Use Coalition (SUCo). This organisation has approximately 150,000 members in different categories. All members form part of a database that can be reached through emails and online communication channels.
Two surveys were conducted; the first survey focused on the international hunting tourists and the second was on the national hunting tourists of South Africa. A web-based survey was designed to optimise participation through SUCo. The advantages of web-based surveys are that they allow the researcher access to a unique population and save time and money (Wright 2005).
A web-based, self-administered questionnaire was distributed online by SUCo (Gatekeeper) to relevant members from each group (i.e. international and domestic hunting organisations). The different organisations that are part of SUCo distributed the questionnaire to their members. These members included the Confederation of Hunters Association of South Africa (CHASA), Wildlife Ranching South Africa (WRSA), and the Professional Hunters Association of South Africa (PHASA). South African Hunters and Game Conservation Association (SAHGCA) did not fall under SUCo but also participated in the research as they are one of the largest hunting organisations for South African hunters.
The invitation to participate in the survey was sent via these associations which distributed the link to their various members. The questionnaire was developed on the online platform QuestionPro, and data were collected online. The respondents could voluntarily participate in the survey after the email provided them with information about the study, the survey, a consent letter, and a link to the online questionnaire. Since the questionnaires were distributed via all known associations to their members between August 2022 and October 2023, the full known population was targeted. We received 414 completed international hunter questionnaires and 1864 completed national hunter questionnaires. The population of international hunting tourists in South Africa during the period under consideration was 6242 (Department of Forestry, Fisheries and the Environment 2023), and our sample had a margin of error of 5% on a 95% confidence interval. It is estimated that there were 200,000 (TREES 2023) national hunting tourists. SA Hunters Organisation estimates the number to be 250,000 (SA Hunters 2024). For the purpose of this study, the authors will work with 200,000 as this number was previously used and made it easier to compare (SA Hunters 2024).
The questionnaires
Two questionnaires were developed for the two hunting segments. The questionnaire was available in Afrikaans and English (two of the most spoken languages in South Africa) for national hunting tourists. For international hunting tourists, the questionnaire was in English only. All research conducted was approved by an ethics committee (ethics number NWU-00652-22). The questionnaires were based on previous research conducted in South Africa (van der Merwe and Saayman 2016). The questionnaires consisted of three sections. Section A assessed respondents’ socio-demographic information, which was limited to age, marital status, year of birth, level of education and qualification. Section B focused on the travel and hunting behaviour of the respondents, including the number of people in the hunting group, the number of hunting trips, the types of animals and birds hunted, and the spending behaviour of the hunting tourists. Section C captured aspects of the social impact of hunting (Oberholzer et al. 2010). Only sections A and B were used in this study.
Data analysis and modelling approach
The data generated by the survey were collated in Microsoft Excel®, and basic (descriptive) respondent characteristics were analysed using the IBM Statistical Package for Social Sciences (SPSS) software. Since this research focuses on spending behaviour and the subsequent impact on the economy, the modelling approach used to quantify these effects is multiplier analysis.
While different methods exist to obtain multipliers for an economy, the current research utilised the South African Social Accounting Matrix (SAM) in the multiplier analysis. he SAM is an extension of the Input-Output model, pioneered by Leontief (1936). The Input-Output model shows intersectoral relationships in an economy and the SAM extends these relationships by integrating data on household behaviour within the model. The SAM is, therefore, able to ‘capture macro transactions of an economic system based on micro-level transfers between all agents in the economy’ (Pyatt and Round 1985; Mainar-Causapé et al. 2018, p. 5). Because the model incorporates the socio-economic characteristics of households, it is able to provide an analysis of the income distribution. This makes the SAM ideal for analysing the key socio-economic issues, including the effect of activities or policies on poverty, employment, economic growth and income distribution (Mainar-Causapé et al. 2018).
In understanding the socio-economic effects of activities, the SAM framework thus offers distinct advantages which include studying the impact at a disaggregated level – by sectors and socio-economic groups. The 2019 South African SAM, compiled by van Seventer and Davies (2023), are used in this study. The SAM disaggregates economic activity in 61 different activity sectors, 108 commodity types and 14 household types (according to income percentiles). In addition, it disaggregates employment into ten different occupations within each sector.
The SAM multiplier model allows us to capture the change in production, income and employment levels in different industries and of different economic agents, due to some exogenous shock to the model. To do this, the SAM is divided into endogenous and exogenous accounts. Exogenous accounts are those activities that tend to be decided outside the economic system, while endogenous accounts are determined within the economic system (De Miguel-Velez and Perez-Mayo 2010).
We define the technical coefficient (aij) as the quantity of intermediate input demanded (zij) from one zij sector (i) to produce one unit of output in sector j (Xj) such that: aij = Xj. The technical coefficients are determined for the endogenous accounts (Croes and Rivera 2017). If the final demand is denoted by Yi, then the total output in each sector is the sum of final demand and intermediate demand. Using matrix notation, this implies that:
where A is the matrix of technical coefficients, X the vector of output and Y the vector of final demand (Croes and Rivera 2017). Rewriting Eqn 1 and defining I as the identity matrix, it delivers:
with Ma, the multiplier matrix, showing the increase in production/income of the endogenous account i due to an exogenous shock in account j (De Miguel-Velez and Perez-Mayo 2010). The exogenous shock, in this case, is the expenditure by hunting tourists in South Africa.
Results
Before turning towards the economic analysis, we briefly describe the respondents’ socio-demographics and compare them to previous research on hunting in South Africa.
Socio-demographic profile of the respondents
Table 4 presents an overview of the socio-demographic profile of the respondents. Based on Krejcie and Morgan (1970, p. 607) a minimum sample of n = 384 for universal populations of over 1 million individuals is needed for reliable statistics. Compared to previous work carried out in South Africa, the sample was deemed representative of the two hunting tourism segments, namely international and local hunting tourists. For example, in the research conducted by Saayman et al. (2018), the international hunter’s profile was similar to that of the current research and the same accounts for the local hunting tourism market that was researched by van der Merwe et al. (2013), who determined the determinants of spending for biltong hunters (local hunting tourists) in South Africa.
| International hunting tourists | National hunting tourists | ||
|---|---|---|---|
| Average age | 57 years | 47 years | |
| Marital status | 81% married | 82% married | |
| Highest level of education | 39% bachelor’s or equivalent | 41% diploma | |
| Length of stay | 9.56 nights | 3.7 nights | |
| Most preferred province | Limpopo | Limpopo | |
| Male/female | 89% male | 97% male | |
| Country/province of residents | 83% USA | 51% Gauteng (RSA) | |
| Occupation | 26% retired | 26% professional | |
| Frequency of hunting trips | 3 trips in a year time span | 2.7 trips per year |
International hunters have older individuals, more retirees, and longer stays, while local hunters have younger individuals, primarily professionals, and shorter stays. Both groups of hunters share preferences for Limpopo province as a hunting destination and have a high male representation. This was also found in previous work of van der Merwe and Saayman (2003), van der Merwe et al. (2013, 2014), Saayman et al. (2011a, 2011b, 2018) and Taylor et al. (2020).
The tabulated data present a comparative analysis between two distinct groups of hunting tourists. Key differentiators and commonalities across various dimensions are: firstly, the average age of international hunting tourists surpasses that of domestic hunting tourists, suggesting an overall older demographic profile within the international hunting community. Despite this age discrepancy, both groups exhibit a notable prevalence of married individuals, with domestic hunting tourists edging slightly higher in marital representation. In terms of educational attainment, a nuanced distinction emerges – a marginally higher percentage of domestic hunting tourists hold diplomas as their highest level of education, whereas international hunting tourists show a greater inclination towards possessing a bachelor’s degree or its equivalent.
The duration of hunting reveals a substantial dissimilarity, as international hunting tourists, on average, prolong their hunting trips significantly more than their domestic counterparts. This disparity hints at a distinctive preference for extended hunting experiences among international hunting tourists. It is noteworthy that both groups converge in their choice of hunting destination, displaying a shared affinity for Limpopo, highlighting a unifying geographical preference. A pronounced gender skew is evident, with both groups predominantly comprising male hunting tourists. Notably, domestic hunting tourists exhibit an even higher percentage of male participants. Geographically, the majority of international hunters comes from the United States, whereas domestic hunting tourists predominantly reside in Gauteng, South Africa. Occupation-wise, more international hunting tourists are as a criterion, which falls in line with the average age (26% retired), whereas most domestic hunting tourists have a professional occupation (26%). Lastly, the frequency of hunting trips underscores another distinction: international hunting tourists tend to hunt less in South Africa, with three trips every 10 years compared to their domestic counterparts, with 2.7 trips per year.
Compared to research conducted in South Africa before COVID-19 (van der Merwe et al. 2014; Saayman et al. 2018), the demographics of hunters remained unchanged, and the pandemic did not cause any shifts in these demographics.
Spending by hunting tourists
Assessing the impact of hunting tourism on the economy requires an assessment of the magnitude of spending due to hunting activities. This spending creates the initial stimulus for subsequent economic activity in the country or region. The approach followed in this research was to determine the average spending per hunter via questionnaires and, given the average spending per hunter and the total number of hunting tourists (national and international), total spending due to hunting activities was derived.
The national questionnaire asked the respondents to recall their spending on various items during the hunting season in 2022, while the international questionnaire asked respondents to recall their spending during their last hunting safari to South Africa. The difference is important since international hunting tourists tend to visit South Africa once a year on a hunting safari. However, local hunting tourists tend to hunt more often and assess spending throughout the hunting season, therefore more accurately capturing spending behaviour. Since the recall method is used, dividing the spending into categories delivers more accurate figures (Stynes 1999).
Table 5 summarises the average expenditure (in US Dollars, the average exchange rate for the year was used to convert South African rand amounts into US dollars ZAR17.61 = USD1) that a national hunter incurred during the hunting season of 2022. It is evident that the typical local hunter spends approximately USD3594 during a season on hunting. Game hunted by hunters accounted for USD2033, which accounts for 56% of total spending. Accommodation, transport and meat processing are also significant hunting categories for local hunting tourists. As indicated in Table 4, the spending is for an average of almost three hunting trips during the season.
| Spending item | USD | |
|---|---|---|
| Accommodation | 378 | |
| Transport | 299 | |
| Food | 176 | |
| Beverages | 104 | |
| Meat processing | 308 | |
| Hunting permits | 27 | |
| Daily fees | 120 | |
| Other (gifts and tips) | 105 | |
| Game | 2033 | |
| Birds | 42 | |
| Total spending (USD) | 3594 |
In Table 6, the average spending of the typical international hunter to South Africa is summarised. More spending categories are assessed since a distinction has to be made between spending in South Africa and spending that may not accrue to the South African economy (such as airfare to South Africa). International hunting tourists also incur additional costs, such as shipping costs for trophies. The average international hunter spends USD32,663 on their hunting trip to South Africa. Game hunted by hunters accounts for 37% of all spending for international hunters. Therefore, for local and international hunters, spending on game is the largest category. Other important spending categories include transport to the country, shipping costs of trophies, daily rates at game reserves/farms and spending on gifts and shopping. It is important to note here that transport to South Africa was excluded in the final calculations as this spending did not occur in South Africa.
| Spending items (excluding hunted game) | USD | |
|---|---|---|
| Transport to South Africa | 6400 | |
| Transport in South Africa | 453 | |
| Daily rates (game reserve/farm) | 2604 | |
| Beverages | 200 | |
| Food | 133 | |
| Ammunition (in SA) | 129 | |
| Clothing | 394 | |
| Hunting gear | 348 | |
| Shipping costs and trophy handling | 6175 | |
| Hunting permits and licences | 1275 | |
| Other expenses (tips, touring, shopping and gifts) | 2185 | |
| Game spending | 12,068 | |
| Bird hunt spending | 269 | |
| Total spending (USD) | 32,663 |
Based on the spending detailed in Tables 5 and 6, it can be assumed that most of the money spent on game hunted will remain at the hunting destination (farm, game reserve or owner). The same applies to spending on accommodation and daily rates. This expenditure can contribute to introducing new species and genetics, improving infrastructure, and enhancing the natural environment on the land.
The spending of hunters, both international (Saayman et al. 2018) and national (van der Merwe et al. 2013), seems to have recovered since COVID-19 compared to the work undertaken prior to COVID-19.
Using the average spending per international and national hunter and the total number of international and national hunting tourists, the total spending due to hunting activities can be derived. However, not all international hunter spending accrues to the South African economy. Since only spending that enters the economy can stimulate economic activity, some adjustments should be made to consider this. The following adjustments are made based on industry information obtained: Firstly, since the South African national carrier has scaled down flights, it is estimated that only 10% of the transport to the country accrues to South Africa (in the form of airport taxes); secondly, only 50% of spending on clothing and hunting gear is assumed to be spent in South Africa, with hunting gear including rifle rent; thirdly, 70% of shipping and trophy handling costs are expected to accrue to the country, with 50% specifically for taxidermy services. When considering this, the total spending of an average international hunter in South Africa amounts to USD27,170.
Once the average spending per hunter is determined, total spending due to hunting activities can be derived by multiplying the average spending by the number of hunting tourists. Data obtained from the Department of Forestry, Fisheries and the Environment (DFFE) indicated that 6242 international hunting tourists visited South Africa during the season under consideration. National hunting statistics are much more difficult to come by since not everyone who owns a hunting rifle needs to register at a hunting association. However, it is estimated that there are approximately 200,000 adult hunting tourists in South Africa. Using this information and the spending on various items, the total spending due to hunting activities within a year in South Africa is derived. This information is displayed in Table 7, and it is evident that, in total, USD888.3 million is spent within the country. Most of this spending stems from national hunting tourists due to the sheer magnitude of domestic hunting activities within the country. These numbers remain estimates though, since the number of national hunters is less certain than international hunters.
| Spending item | International hunting tourists | National hunting tourists | |
|---|---|---|---|
| Transport to South Africa | 3.995 | ||
| Transport in South Africa | 2.825 | 59.760 | |
| Accommodation | 75.631 | ||
| Daily rates at hunting destination (game reserve/farm) | 16.254 | 24.082 | |
| Beverages | 1.248 | 20.717 | |
| Food | 0.828 | 35.284 | |
| Ammunition (in SA) | 0.806 | ||
| Clothing | 1.230 | ||
| Hunting gear | 1.064 | ||
| Shipping costs and trophy handling | 26.980 | ||
| Meat processing | 61.688 | ||
| Hunting permits and licences | 7.960 | 5.405 | |
| Expenses not listed above | 13.640 | 21.058 | |
| Animals | 75.332 | 406.579 | |
| Birds | 1.680 | 8.497 | |
| Pre- or post-tour | 15.758 | ||
| Total (USD million) | 169.600 | 718.702 |
Multiplier analysis
To determine the economic significance of hunting tourism on the South African economy, multipliers derived from the 2019 South African SAM were used. We included both international and local hunting tourist spending in our analysis in order to present a complete picture of the total effect of hunting tourism on the South African economy, that is, the immediate losses to the economy should this activity totally cease to exist.
The total spending of hunting tourists (as indicated in Table 7) is allocated to the various SAM categories; this represents the change in final demand (Y in Eqn 2) in the simulation. Given the multipliers, the change in economic activity (X in Eqn 2) can subsequently be derived. Firstly, the impact on production within the economy is assessed. ‘Production’ refers to the total turnover generated by each sector in the economy. It, therefore, consists of both the demand for intermediate inputs by activity and the total value added by activity. Table 8 reflects the effects of expenditure related to hunting tourism in South Africa on production (using the production multipliers).
| Sector | Direct impact | Indirect impact | Induced impact | Total impact | Percentage | |
|---|---|---|---|---|---|---|
| Agriculture | 214.097 | 267.990 | 212.436 | 694.524 | 27.3% | |
| Mining | 14.721 | 14.044 | 14.982 | 43.746 | 1.7% | |
| Manufacturing | 113.139 | 116.840 | 92.580 | 322.559 | 12.7% | |
| Electricity and water | 18.941 | 17.947 | 18.474 | 55.362 | 2.2% | |
| Construction | 4.237 | 4.978 | 4.420 | 13.634 | 0.5% | |
| Trade, accommodation, catering | 132.469 | 108.671 | 151.869 | 393.009 | 15.5% | |
| Transport and communication | 65.094 | 59.341 | 62.357 | 186.791 | 7.3% | |
| Financial and business services | 132.689 | 105.282 | 152.758 | 390.729 | 15.4% | |
| Government | 17.590 | 10.608 | 22.541 | 50.740 | 2.0% | |
| Personal and social services | 143.592 | 82.312 | 166.481 | 392.385 | 15.4% | |
| Total (USD million) | 856.570 | 788.013 | 898.898 | 2543.48 | 100.0% |
The direct impact measures the change in production activity because of the initial change in final demand. The indirect impact measures the change in production because of the linkages between firms when depleted stock is replenished. Finally, the induced impact measures the change in production because of a change in income received by agents in the economy. The total impact on production is the sum of the direct, indirect, and induced impacts.
It is evident in Table 8 that the USD888.3 million expenditure by hunting tourists directly increases production by USD856.57 million, especially with the agricultural sector and personal services sector immediately experiencing an increase in production activities. Through linkages between industries, the indirect impact of the initial expenditure is USD788 million, while the induced impact is almost USD900 million. Together, the total economic significance of hunting tourism on production activities in South Africa amounts to USD2543.480 million. This represents a production multiplier of 2.97, indicating that for every USD1 spent by hunting tourists, production increases by an additional USD1.97.
The production sectors in the economy that benefit most from hunting tourism are the agricultural sector (27.3%); followed by the trade, accommodation, and catering sectors (15.5%) and the services sectors (15.4%).
Because the SAM is an extension of the classic input-output model, it can also measure the effect on household income within the economy. Table 9 shows the impact of hunting tourism on the incomes of low- and middle-income earners, as well as the impact on total income. The focus on low- and middle- income is important since it indicates the impact of the activity on poverty and income distribution within the economy.
| Sector | Total production | Low income | Middle income | Total income | Percentage | |
|---|---|---|---|---|---|---|
| Agriculture | 694.524 | 48.132 | 289.299 | 656.939 | 25.4% | |
| Mining | 43.746 | 2.628 | 19.357 | 42.624 | 1.6% | |
| Manufacturing | 322.559 | 15.826 | 118.050 | 265.182 | 10.3% | |
| Electricity and water | 55.362 | 2.553 | 22.793 | 52.737 | 2.0% | |
| Construction | 13.634 | 0.889 | 6.217 | 13.541 | 0.5% | |
| Trade, accommodation, catering | 393.009 | 22.652 | 193.217 | 436.993 | 16.9% | |
| Transport and communication | 186.791 | 8.427 | 76.319 | 174.978 | 6.8% | |
| Financial and business services | 390.729 | 18.307 | 187.914 | 449.087 | 17.4% | |
| Government | 50.740 | 2.550 | 28.058 | 63.929 | 2.5% | |
| Personal and social services | 392.385 | 36.877 | 185.331 | 430.360 | 16.6% | |
| Total (USD million) | 2543.480 | 158.842 | 1126.557 | 2586.369 | 100.0% |
In Table 9, it is clear that substantial spending by hunting tourists leads to an increase in income of low-income households, totalling almost USD159 million (6.1% of all income earned), while middle-income households earn USD1126.6 million (43.6% of all income earned). In total, household income benefits amount to USD2586.4 million. This represents an income multiplier of 3.02, which can be interpreted as the increase in household income for each USD1 of expenditure incurred by hunting tourists.
Households in the agricultural sector benefit the most from the increase in income (25.4%), followed by the financial and business services sector (17.4%); trade, accommodation, and catering sector (16.9%); and personal and social services (16.6%). These sectors are all relatively labour-intensive within the South African economy, which is also shown in the impact hunting tourism exerts on employment. Salaries and wages are distributed among various types of labourers, which has a positive impact on the economy. Labour forms an important part of the production process in any economy and is a key variable of concern in the South African economy, which has battled high levels of unemployment for decades. For example, in the first quarter of 2024, the unemployment rate for South Africa stood at 32.9% (STATS-SA 2024). Especially since COVID-19, the tourism industry has been severely impacted as indicated by van der Merwe et al. (2021b), and therefore, the importance of hunting tourism in rural areas cannot be denied.
Table 10 shows the impact of hunting tourism on employment within the South African economy. With approximately 16.5 million workers in the South African economy, the results of the analysis show that almost 95,000 job opportunities depend on hunting tourism. It is especially the agricultural sector (32.2%) and trade, accommodation and catering (29.3%) that benefit from hunting tourism employment.
| Sector | Total production (USD million) | Multiplier | Total labour | Percentage | |
|---|---|---|---|---|---|
| Agriculture | 694.524 | 2.49 | 30,495 | 32.2% | |
| Mining | 43.746 | 0.92 | 708 | 0.7% | |
| Manufacturing | 322.559 | 0.66 | 3776 | 4.0% | |
| Electricity and water | 55.362 | 0.40 | 388 | 0.4% | |
| Construction | 13.634 | 3.27 | 784 | 0.8% | |
| Trade, accommodation, catering | 393.009 | 4.00 | 27,650 | 29.2% | |
| Transport and communication | 186.791 | 1.33 | 4366 | 4.6% | |
| Financial and business services | 390.729 | 1.69 | 11,600 | 12.3% | |
| Government | 50.740 | 1.16 | 1038 | 1.1% | |
| Personal and social services | 392.385 | 2.01 | 13,872 | 14.7% | |
| Total | 2543.480 | 94,675 | 100.0% |
The 2019 SAM also breaks down employment according to 10 broad occupational groups (see Fig. 1), namely (1) Legislators, senior officials and managers; (2) Professionals; (3) Technical and associate professionals; (4) Clerks; (5) Service workers and shop and market sales workers; (6) Skilled agricultural and fishery workers; (7) Craft and related trades workers; (8) Plant and machine operators and assemblers; (9) Elementary occupation; and (10) Domestic workers (van Seventer and Davies 2023). This allows us to also determine how the various occupational groups are impacted by hunting tourism. Fig. 1 illustrates the number of job opportunities in each occupational group that depend on hunting tourists’ expenditure.
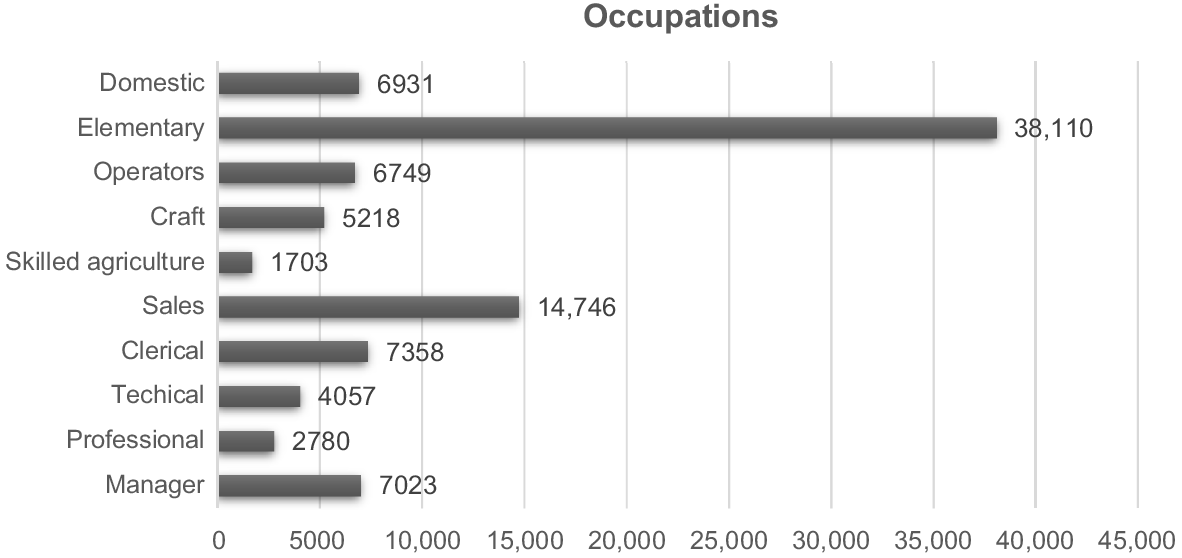
Fig. 1 shows that it is especially among the lower-skilled occupations where a large proportion (60.2%) of job opportunities depend on hunting tourism. These occupations include domestic workers, elementary occupations, plant and machine operators, and craft and related workers. Therefore, this activity benefits lower-skilled workers, who are especially vulnerable to unemployment within the South African economy.
Findings and implications
The first finding of the research is that hunting tourism makes a significant economic contribution to the South African economy. This confirms the findings of the research undertaken by Humavindu and Barnes (2003), Pešić (2021), and Matilainen et al. (2016), studied under the literature review of this study, that hunting tourism does contribute to the economy of the host country. The findings imply that hunting tourism drives production, household income, and employment across various sectors, particularly for the agriculture and services delivery sectors. Any disruption or decline in this activity would significantly impact dependent industries and the economy of the country. The opposite is true when hunting tourism experiences growth. These dependent sectors will benefit. Most importantly, rural areas will be most affected or benefited. In the case of South Africa, rural areas are the least developed areas and have some of the poorest communities, which, therefore, in a sence may depend on hunting tourism.
The second finding of the research is that hunting tourism plays an important role in income generation and poverty reduction in South Africa. The implication is that hunting tourism has a high income multiplier, generating substantial income gains for the country’s low- and middle-income households. In a country with the highest Gini coefficient in the world (0.63) (World Bank 2024), activities that create income and opportunities for low-income earners are especially important. This research, therefore, finds that hunting tourism contributes to reducing poverty and further addresses income inequality, especially in rural and lower-income areas. While research has shown that conservation contributes to poverty alleviation (see Saayman et al. 2012), the role of hunting tourism in poverty reduction has not received much attention to date. Therefore, this contributes to current literature pertaining to poverty reduction effects of hunting tourism.
The third finding is that hunting tourism plays an important role in job creation for lower-skilled workers in the country. Hunting tourism is further a labour-intensive sector. Although previous research indicated that hunting tourism contributes to job creation (Child et al. 2012; Arnett and Southwick 2015; Kupren and Hakuć-Błażowska 2021), this research clearly indicates that lower-skilled workers benefit the most. Skills referred to here are trackers, skinners, farm workers, cleaning and maintenance staff, to name but a few. This implies that a high number of jobs are created for lower-skilled workers by the hunting industry, which is needed in the country, highlighting the importance of the sector in employing a vulnerable segment of the South African population. The reduction of hunting tourism could disproportionately harm these workers, thus exacerbating the unemployment challenges in South Africa.
The fourth finding is the dependence of various sectors on hunting tourism. The implication is that if there is an increase or reduction in hunting tourism activities, several sectors will be affected. The agriculture, trade, accommodation, and personal services sectors showed a strong dependency on hunting and tourism. The South African government, which plays an important role in policy development, should recognise the importance of the sector when making decisions about land use, conservation policies, or hunting regulations, as this could have negative consequences if hunting tourism is not encouraged. This finding is in line with the work done by ’t Sas-Rolfes and Richard (2024).
The fifth finding is that hunting tourism positively contributes to conservation and the wildlife population in the country. This agrees with Semcer’s (2019) testimony before the U.S. House Natural Resources Committee who testified that hunting tourism has provided and can provide the incentives and revenue necessary to make conservation efforts more resilient. The article on the website of PERC (Property and Environment Research Center) further stated that 13 African nations (Cameroon, Central African Republic, Congo, Ethiopia, Liberia, Morocco, Mozambique, Namibia, Republic of South Africa, Tanzania, Uganda, Zambia, and Zimbabwe) use hunting tourism to achieve their conservation goals and will soon be joined by Angola and Botswana, who have recently reopened their countries to hunting but are yet to implement related programmes. Further, 34% of the signatories to the African Continental Free Trade Agreement decided to use hunting tourism to conserve their environment while building their economies (Semcer’s 2019). As evident in the introduction of this study, more land is under protection today in South Africa because wildlife has a consumptive use value for its owners. This notion is supported by Parker et al. (2020). Hunting tourism contributes to the rewilding of previously crop and livestock farming areas as these are replaced with wildlife reserves. Reduction in hunting tourism activities will negatively impact land use for wildlife as landowners will revert back to alternative agricultural activities such as domesticated livestock or crop farming to generate revenue, which will not benefit wildlife and conservation.
The last finding is that the hunting industry has recovered from the COVID-19 pandemic. The recovery might be driven by a growing interest in niche tourism experiences and strong demand for wildlife-related activities since COVID-19, particularly in regions like Africa. This statement suggests not only a bounce-back from the pandemic but possibly an industry-wide transformation where increased spending reflects a more resilient and perhaps higher-value market.
Conclusion
In conclusion, this research determined the collective economic significance of hunting tourism in South Africa, making several contributions to the field of study. Firstly, it contributes to the literature by providing empirical evidence of the simultaneous economic significance of both types of hunting markets, that is, biltong and trophy hunting in the country. Therefore, for the first time, there is a combined economic value of the contribution of hunting tourism to the South African economy (USD2.586 billion). Secondly, this research follows the COVID-19 pandemic and shows the economic rebound of the industry and its importance to the economy of South Africa and job creation. Given that the South African government allowed hunting as one of the first kinds of tourism to continue generally during the pandemic due to its location in open spaces, this result gives credence to this decision, safeguarding income and jobs in rural South Africa. Thirdly, the practical contribution for the researchers lies in the notion that hunting, directly and indirectly, supports conservation initiatives in South Africa, thus facilitating job creation (95,000 job opportunities depend on hunting), and therefore, plays a vital role in South Africa to improve the living conditions of people living in rural areas. Lastly, this research reveals that the consumptive use of wildlife is an integral part of the rural economic development plan in South Africa and Africa – a continent blessed with abundant, diverse wildlife.
This research is also not without limitations. First and foremost, although care was taken to reach both segments of the hunting tourism industry, the estimate of the number of biltong hunters in South Africa remains only that – an estimate. Further, while the SAM offers notable advantages, its underlying assumption that an increase does not affect the prices of production factors in demand, this remains a limitation. Given that the South African economy is not functioning at optimal levels and there is large-scale unemployment, the effect of this on the results is expected to be low to negligible. This current research has not considered the benefit of hunting tourism to government in terms of tax revenue gained, which could be a valuable addition in future research. Furthermore, our data does not allow us to do land use comparisons. Hence, the research could also be expanded to consider revenue per hectare, which is important in land use comparisons.
Data availability
The research data belong to SUCo (Sustainable Use Coalition) and, therefore, are not included.
Declaration of funding
The authors would like to declare that funding was received by SUCo (Sustainable Use Coalition), which was used to conduct the research, which includes the development of the measuring instruments, the running of the questionnaires and report writing.
Acknowledgements
The authors would like to acknowledge the assistance of the South African hunting fraternity for participating in this research.
References
ABSA (2015) Agricultural outlook 2015. Available at https://www.arc.agric.za/Economic%20Outlook%20Reports/Economic%20Outlook%20Report%20XVII,%20March%202015.pdf [retrieved 5 March 2024]
Andersson T, Rustaf A, Solberg HA (2004) Local residents’ monetary evaluation of sport events. Managing Leisure 9(3), 145-158.
| Crossref | Google Scholar |
Arnett EB, Southwick R (2015) Economic and social benefits of hunting in North America. International Journal of Environmental Studies 72(5), 734-745.
| Crossref | Google Scholar |
Barget E, Gouguet JJ (2007) The total economic value of sporting events theory and practice. Journal of Sports Economics 8(2), 165-182.
| Crossref | Google Scholar |
Brink M, Cameron M, Coetzee K, Currie B, Fabricius C, Hattingh S, Schmidt A, Watson L (2011) Sustainable management through improved governance in the game industry. South African Journal of Wildlife Research 41, 110-119.
| Crossref | Google Scholar |
Carruthers J (2008) “Wilding the farm or farming the wild”? The evolution of scientific game ranching in South Africa from the 1960s to the present. Transactions of the Royal Society of South Africa 63, 160-181.
| Crossref | Google Scholar |
Child BA, Musengezi J, Parent GD, Child GFT (2012) The economics and institutional economics of wildlife on private land in Africa. Pastoralism: Research, Policy and Practice 2(1), 18.
| Crossref | Google Scholar |
Clements HS, Child MF, Lindeque L, Lunderstedt K, De Vos A (2022) Lessons from COVID-19 for wildlife ranching in a changing world. Nature Sustainability 5, 1040-1048.
| Crossref | Google Scholar |
Croes R, Rivera MA (2017) Tourism’s potential to benefit the poor: a social accounting matrix model applied to Ecuador. Tourism Economics 23(1), 29-48.
| Crossref | Google Scholar |
Crompton JL (2006) Economic impact studies: instruments for political shenanigans? Journal of Travel Research 45(1), 67-82.
| Crossref | Google Scholar |
De Miguel-Velez FJ, Perez-Mayo J (2010) Poverty reduction and SAM multipliers: an evaluation of public policies in a regional framework. European Planning Studies 18(3), 449-466.
| Crossref | Google Scholar |
Dowling RK (2011) Geotourism’s global growth. Geoheritage 3(1), 1-13.
| Crossref | Google Scholar |
Fischer A, Sandström C, Delibes-Mateos M, Arroyo B, Tadie D, Randall D, Hailu F, Lowassa A, Msuha M, Kereži A, Reljić S, Linnell J, Majić A (2013) On the multifunctionality of hunting – an institutional analysis of eight cases from Europe and Africa. Journal of Environmental Planning and Management 56(4), 531-552.
| Crossref | Google Scholar |
Government of South Africa (1991) Game Theft Act, 1991. Vol. 313. Cape Town, 5 July 1991, No. 13352. Available at https://www.gov.za/sites/default/files/gcis_document/201409/a1051991.pdf
Grado SC, Kaminski RM, Munn IA, Tullos TA (2001) Economic impacts of waterfowl hunting on public lands and at private lodges in the Mississippi Delta. Wildlife Society Bulletin 29(3), 846-855.
| Crossref | Google Scholar |
Humavindu MN, Barnes JI (2003) Trophy hunting in the Namibian economy: an assessment. South African Journal of Wildlife Research 33(2), 65-70.
| Google Scholar |
Kottke M (1988) Estimating economic impacts of tourism. Annals of Tourism Research 15(1), 122-133.
| Crossref | Google Scholar |
Krejcie RV, Morgan DW (1970) Determining sample size for research activities. Educational and Psychological Measurement 30, 607-610.
| Crossref | Google Scholar |
Krutilla JV (1967) Conservation reconsidered. The American Economic Review 57(4), 777-786.
| Google Scholar |
Kupren K, Hakuć-Błażowska A (2021) Profile of a modern hunter and the socio-economic significance of hunting in Poland as compared to European data. Land 10(11), 1178.
| Crossref | Google Scholar |
Leontief W (1936) Quantitative input and output relations in the economic systems of the United States. Review of Economics and Statistics 18(3), 105-125.
| Crossref | Google Scholar |
Lindsey PA, Roulet PA, Romanach SS (2007) Economic and conservation significance of the trophy hunting industry in sub-Saharan Africa. Biological Conservation 134(4), 455-469.
| Crossref | Google Scholar |
Mainar-Causapé AJ, Ferrari E, McDonald S (2018) Social accounting matrices: Basic aspects and main steps for estimation (EUR 29297 EN, JRC Technical Reports). Publications Office of the European Union. Available at https://doi.org/10.2760/010600
Matilainen A, Keskinarkaus S, Törmä H (2016) The economic significance of hunting tourism in East Lapland, Finland. Human Dimensions of Wildlife 21(3), 203-222.
| Crossref | Google Scholar |
McKay T (2014) White water adventure tourism on the Ash River, South Africa. African Journal of Physical Health Education, Recreation and Dance 20(1), 52-75.
| Google Scholar |
Moore RL, Gitelson RJ, Graefe AR (1994) The economic impact of rail-trails. Journal of Park and Recreation Administration 12(2), 63-72.
| Google Scholar |
Munn IA, Hussain A, Spurlock S, Henderson JE (2010) Economic impact of fishing, hunting, and wildlife-associated recreation expenditures on the Southeast U.S. regional economy: an input-output analysis. Human Dimensions of Wildlife 15(6), 433-449.
| Crossref | Google Scholar |
Naidoo R, Weaver LC, Diggle RW, Matongo G, Stuart-Hill G, Thouless C (2016) Complementary benefits of tourism and hunting to communal conservancies in Namibia. Conservation Biology 30(3), 628-638.
| Crossref | Google Scholar |
Oberholzer S, Saayman M, Saayman A, Slabbert E (2010) The socio-economic impact of Africa’s oldest marine park. Koedoe 52(1), 1-9.
| Crossref | Google Scholar |
Pack S, Golden R, Walker A, Surrige M, Mawdsley M (2017) Comparison of national wildlife management strategies: What works where, and why? African Sustainability Conservation News 1-100.
| Google Scholar |
Parker K, De Vos A, Clements HS, Biggs D, Biggs R (2020) Impacts of a trophy hunting ban on private land conservation in South African biodiversity hotspots. Conservation Science and Practice 2, e214.
| Crossref | Google Scholar |
Pasmans T, Hebinck P (2017) Rural development and the role of game farming in the Eastern Cape, South Africa. Land Use Policy 64, 440-450.
| Crossref | Google Scholar |
Patterson C, Khosa P (2005) Background research paper: a status quo study on the professional and recreational hunting industry in South Africa. Prepared for the Panel of Experts appointed by the Minister of Environmental Affairs and Tourism. Available at file:///C:/Users/10219382/Downloads/hunting-industry-in-africa-1.pdf. [accessed 12 April 2024]
Pešić B (2021) Hunting tourism as a factor for economic development of hunting associations on the territory of the City of Leskovac. Turizam 25(1), 1-10.
| Crossref | Google Scholar |
SA Hunters (2024) Wildlife economy. Economic contribution of hunting. Available at https://sahunters.co.za/hunting/hunting-statistics-wildlife-economy/
Saayman M, Saayman A (2014) Appraisal of measuring economic impact of sport events. South African Journal for Research in Sport, Physical Education and Recreation 36(3), 151-181.
| Google Scholar |
Saayman M, van der Merwe P, Rossouw R (2011a) The economic impact of hunting in the Northern Cape Province. South African Journal of Wildlife Research 41(1), 120-133.
| Crossref | Google Scholar |
Saayman M, van der Merwe P, Rossouw R (2011c) The impact of hunting for biltong purposes on the SA economy. Acta Commercii 11, 1-12.
| Google Scholar |
Saayman M, Rossouw R, Saayman A (2012) Does conservation make sense to local communities? Development Southern Africa 29(4), 588-609.
| Crossref | Google Scholar |
Saayman M, van der Merwe P, Saayman A (2018) The economic impact of trophy hunting in the South African wildlife industry. Global Ecology and Conservation 16, e00510.
| Crossref | Google Scholar |
Samuelsson E, Stage J (2007) The size and distribution of the economic impacts of Namibian hunting tourism. South African Journal of Wildlife Research 37, 41-52.
| Crossref | Google Scholar |
Semcer CE (2019) EconTalk: Catherine Semcer on poaching, preserves, and African wildlife. Available at https://www.perc.org/2019/02/21/econtalk-catherine-semcer-on-poaching-preserves-and-african-wildlife/ [accessed 10 September 2024]
STATS-SA (2024) Quarterly labour force survey. Available at https://www.statssa.gov.za/publications/P0211/Presentation%20QLFS%20Q1%202024.pdf [accessed 3 October 2024]
Stynes DJ (1999) Guidelines for measuring visitor spending. Michigan State University. Available at https://npshistory.com/publications/social-science/measuring-visitor-spending.pdf [accessed 11 September 2023]
Suich H, Child B, Spenceley A (2009) ‘Evolution and innovation in wildlife conservation: Parks and game ranches to transfrontier conservation areas.’ (Routledge) 10.4324/9781849771283
Taylor WA, Lindsey PA, Nicholson SK, Relton C, Davies-Mostert HT (2020) Jobs, game meat and profits: the benefits of wildlife ranching on marginal lands in South Africa. Biological Conservation 245(2020), 108561.
| Crossref | Google Scholar |
Taylor WA, Child MF, Lindsey PA, Nicholson SK, Relton C, Davies-Mostert HT (2021) South Africa’s private wildlife ranches protect globally significant populations of wild ungulates. Biodiversity and Conservation 30, 4111-4135.
| Crossref | Google Scholar |
TIES (2015) What is ecotourism. The International Ecotourism Society. Available at https://ecotourism.org/what-is-ecotourism.htm [accessed 11 February 2021]
’t Sas-Rolfes M, Richard E (2024) African rhino conservation and the interacting influences of property, prices, and policy. Ecological Economics 220, 108123.
| Crossref | Google Scholar |
Tyrrell TJ, Johnston RJ (2006) The economic impacts of tourism: a special issue. Journal of Travel Research 45(1), 3-7.
| Crossref | Google Scholar |
van der Merwe P, Saayman M (2003) Determining the economic value of game farm tourism. Koedoe 46(2), 103-112.
| Crossref | Google Scholar |
van der Merwe P, Saayman M (2005) Game farms as sustainable ecotourism attractions. Koedoe 48(2), 1-9.
| Crossref | Google Scholar |
van der Merwe P, Saayman M, Krugell WF (2013) The determinants of spending by biltong hunters. South African Journal of Economic and Management Sciences 10(2), 184-194.
| Crossref | Google Scholar |
van der Merwe P, Saayman M, Rossouw R (2014) The economic impact of hunting: a regional approach. South African Journal of Economic and Management Sciences 17(4), 379-395.
| Crossref | Google Scholar |
van der Merwe P, Saayman A, Jacobs C (2021a) Assessing the economic impact of covid-19 on the private wildlife industry of South Africa. Global Ecology and Conservation 28, e01633.
| Crossref | Google Scholar |
van der Merwe P, Saayman A, Jacobs C (2021b) Assessing the economic impact of covid-19 on the private wildlife industry of South Africa. In ‘The 5th International Conference on Events (ICE2021) – Making New Waves in Africa: exploring Frontiers in Festivals and Events’, 16–18 November 2021, Cape Town, South Africa. (Cape Peninsula University of Technology)
World Bank (2024) Poverty and Inequality Platform (version 20240627_2017_01_02_PROD) [data set]. Available at pip.worldbank.org [accessed 04 October 2024]
Wright KB (2005) Researching internet-based populations: advantages and disadvantages of online survey research, online questionnaire authoring software packages, and web survey services. Journal of Computer-Mediated Communication 10(3),.
| Crossref | Google Scholar |