

Mercury concentration in Antarctic krill varies in time and space and with individual size
Rita M. Franco-Santos A B # * , Sam Eggins C # * , Michael J. Ellwood C D , Nils Hoem E , Peter D. Nichols B F , Patti Virtue B F and William A. Maher C
A
B
C
D
E
F
# These authors contributed equally to this work.
Handling Editor: Graeme Batley
Abstract
Several predators that eat Antarctic krill may be unintentionally ingesting toxic substances. Studying aspects of krill life to understand the effects of potential increases in Antarctic mercury (Hg) availability revealed that seasons, locations and individual size influence krill Hg concentration. Despite increasing human presence (potential Hg sources) in Antarctica, krill Hg content remains stable, and evidence suggests that Hg accumulates in predators by both short (krill-based) and longer food chains.
Mercury (Hg) is passively assimilated from the water by phytoplankton, accumulated by lower trophic levels species, and biomagnified along food chains. Any increases in its bioavailability in Antarctic waters could endanger the survival of vulnerable top predators. With Antarctic food webs reliant on krill, we must understand the temporal, spatial and biological variability in their Hg concentration to forecast ecosystem-wide impacts of rising Hg levels.
We sampled krill fortnightly from South Georgia, South Orkney Islands and West Antarctic Peninsula between December 2013 and September 2019 (excluding October and November months). Individuals were weighed, sexed and analysed for Hg. We assessed the importance of biological (krill size, sex and life stage) and environmental (location, time and chlorophyll-a concentration) parameters on krill Hg concentrations with generalised linear models, analyses of variance, Gaussian linear models and vector autoregressive modelling.
Temporal variation explained most of the differences in krill Hg concentrations, with location and individual size also contributing to the variability. Subsurface chlorophyll-a concentrations and the affinity of methylmercury to sulfhydryl groups of some proteins, rather than krill fatty acid content, were likely the drivers of observed annual cycles.
Antarctic krill Hg concentrations have remained stable since the 1990s, although our measurements were lower than most. Such a historic baseline is indispensable for continued monitoring of Antarctic ecosystems. Krill is considered a key prey species, but our findings and those of biomagnification studies suggest that there may be a gap in our understanding of trophic transfer and accumulation of Hg in some top predators. Future biomagnification studies would benefit from conducting mass balance models.
Keywords: chlorophyll-a, euphausiids, fatty acids, food web, maturity stage, mercury, phytoplankton, Southern Ocean.
Introduction
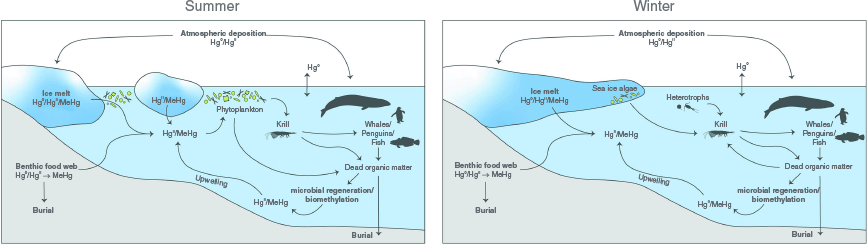
Long-range atmospheric transport and deposition processes have resulted in mercury (Hg) from natural and anthropogenic sources being widely distributed in the oceans. This is the case even in areas away from major urban developments and in remote locations such as Antarctica (Dommergue et al. 2010), where some of the highest open water Hg concentrations have been recorded (Cossa et al. 2011). Light and temperature conditions in polar zones make for unique Hg cycling in these regions. A synthesis of the available information on Hg cycling in Antarctica, with a focus on key Hg species, is presented in Fig. 1. Mercury is recycled between the ocean surface and the lower troposphere by oxidation and reduction reactions, and is actively scavenged by particulate matter (Mason and Gill 2005; Cossa et al. 2011). Atmospheric Hg0 (elemental Hg) is rapidly oxidised to HgII (inorganic Hg) in the spring by sea-salt-derived bromine that is released into the atmosphere during sea-ice formation (Schroeder et al. 1998; Lindberg et al. 2001; Ariya et al. 2002; Yue et al. 2021). These reactive Hg species can be deposited onto snow and transferred to the ocean upon thawing (Lindberg et al. 2001; Brooks et al. 2008). Once in the water, HgII species can be reduced to Hg0, re-emitted into the troposphere, bound to minerals or organic matter, or incorporated into phytoplankton within the photic zone (Cossa et al. 2011). HgII transported to the deeper ocean while attached to particles can be biomethylated in the water column, the rate of which will depend on the microbial activity associated with the degradation of phytoplankton (Heimbürger et al. 2010). Biological and photochemical demethylation can occur concurrently in the water column, snow packs and sediment, such that monomethylmercury (MeHg) concentrations reflect the net methylation–demethylation processes (Cossa et al. 2011). Overall, the distribution of Hg in the ocean is characterised by surface depletion and elevated concentrations at depth in the regeneration zone (Cossa et al. 2011). Net Hg methylation by microbial activity is thought to take place in low oxygen regions, driven by the decomposition of sinking organic matter (Heimbürger et al. 2010; Cossa et al. 2011). The sediment is the final compartment for Hg in the open ocean environment, where it can be transformed into MeHg by biomethylation. Monomethylmercury can then be released back into the water column, where upwelling currents may transport it to surface waters. Deep-sea cold seeps can be a sink for Hg and a source of MeHg in the ocean floor (Li et al. 2024). Proximity to bird or penguin colonies may also influence Hg concentrations in the water column and in the Antarctic food web, as their excreta is enriched with Hg (Bargagli et al. 1998; Chiang et al. 2021).
Processes involved in mercury (Hg) cycling in Antarctica during summer months (left panel) and winter months (right panel), with a focus on key Hg species (elemental mercury, Hg0; inorganic mercury, HgII; and methylmercury, MeHg). Arrows indicate the transfer of Hg species between different compartments and reservoirs. Burial can happen at shallower and deeper waters, depending on local hydrodynamics and biological activity in the sediment. Guano Hg input from bird colonies in coastal zones, as well as cold seep influences (Hg sink and MeHg source) are not included. Biological processes influencing Hg cycling are illustrated if directly related to Antarctic krill. The feeding ecology of this species varies with seasons; individuals feed primarily on phytoplankton during the summer, whereas during the winter krill larvae feed on ice algae and juveniles and adults opportunistically feed on heterotrophs (e.g. small copepods and flagellates) or marine snow when these are available, or consume their energy reserves (i.e. storage lipids) when food is unavailable. Phytoplankton, krill, and higher trophic level species (exemplified herein by whales, penguins and fish) contribute to the dead organic matter pool (including marine snow) with frustules, excretion and egestion (i.e. faeces) products, moults and dead bodies, among others.
The Antarctic food web is heavily reliant on Antarctic krill (Euphausia superba) (Locarnini and Presley 1995; Everson 2000). Several interconnected biotic and abiotic factors, including diet composition, geographic location, topographical features, depth of feeding and physiological state, can influence the concentration of Hg in krill. Although these crustaceans feed on phytoplankton and zooplankton (Perissinotto et al. 2000), the former is their primary source of food and, thus, of Hg. Phytoplankton blooms vary in time and space in the Southern Ocean (Cuzin-Roudy 2000; Atkinson et al. 2006), such that seasonal shifts in the proportion of phytoplankton and zooplankton in krill diets, as well as spatially variable (location-dependent) food dynamics and availability, may affect Hg intake and bioaccumulation in krill (Chen and Folt 2005; Sontag et al. 2019; Korejwo et al. 2023). The concentration of Hg in surface snow is greater at the sea-ice edge, adjacent to the freezing ocean surface, and its concentration in surface waters increases poleward (Brooks et al. 2008; Cossa et al. 2011). This pattern should be reflected in phytoplankton in these areas. Krill feed where thawing of sea-ice occurs in spring and summer, and could thus consume phytoplankton with higher Hg content. A similar trend could be expected for krill feeding in areas with high land or submarine volcanic activity and hydrothermal vents that emit heavy metals (e.g. Dick 1991; Bargagli et al. 1998; Tovar-Sanchez et al. 2009; Tomiyasu et al. 2023). Elsewhere, adult krill, which primarily feed in surface waters, likely consume phytoplankton with lower Hg concentrations. Juvenile krill, which develop and feed while ascending through mesopelagic depths, will encounter prey where environmental Hg concentrations may be higher. It is also possible that Hg can be lost once assimilated by adult female krill. Indeed, Seco et al. (2019) observed higher concentrations in eggs than in somatic tissue and proposed spawning as a potential mechanism for Hg elimination in krill.
Krill are a major food source for cephalopods, fish, seals, baleen whales and seabirds in Antarctica. Some seal and whale species feed exclusively on krill (Seco et al. 2019). Just as krill are the energy transfer link between primary producers and higher trophic levels, they also play a key role in the transfer, bioaccumulation and biomagnification of Hg in Antarctic food webs (e.g. Matias et al. 2022). Mercury is a non-essential metal that can be toxic even in low concentrations (e.g. it interferes with hormone regulation; as reviewed by Tan et al. 2009), and its presence in aquatic habitats is commonly seen as a global toxicity problem (Jackson 1998). It can also bioaccumulate and biomagnify in food webs primarily as MeHg (Bengtson Nash et al. 2021; Seco et al. 2021), a neurotoxic Hg species whose seawater concentration is controlled by biological methylation and both biotic and abiotic demethylation reactions (Cossa et al. 2011; Cipro et al. 2017; Maher et al. 2020). Mercury concentrations in Southern Ocean biota are expected to increase with climate change, as higher global temperatures lead to enhanced Hg methylation and bioavailability in subsurface waters where oxygen is depleted (Cossa et al. 2011). This is expected to affect Antarctic food webs at structural and functional levels, possibly endangering the reproduction and survival of more vulnerable top predator populations (e.g. Goutte et al. 2014; Mills et al. 2020).
A thorough understanding of trends and patterns in krill Hg content and its potential effects on the Antarctic food web, especially under changing climate conditions, requires comprehensive sampling at spatial and temporal scales. The costs and difficulty of frequently accessing Southern Ocean environments, however, have prevented scientists from establishing such long-term data sets. In this study, we collaborated with AkerBiomarine, a Norwegian krill fishing and biotech company, to obtain a scientifically unique and almost continuous (fortnightly between December and September) source of krill samples from late 2013 until 2019. Our objective was to establish a baseline (for past and future comparison) of Hg concentrations in female and male adult krill sampled from fishing locations in the South Orkney Islands (SOI), South Georgia (SG) and the West Antarctic Peninsula (WAP). We also investigated whether biological (size, sex and life stage) and abiotic (geographic location and temporal variation in food supply) variables had any influence on Hg concentrations in krill.
Experimental
Study sites and sample collection
Krill were collected by the vessel FV Saga Sea (Aker BioMarine, Oslo, Norway) during six fishing seasons (Fig. 2): December 2013–September 2014, December 2014–September 2015, December 2015–September 2016, January–August 2017, December 2017–August 2018 and January–September 2019 (hereafter referred to as fishing years 2014 through 2019 respectively; seasons are mentioned for the Southern Hemisphere which, in Australia, start on the first day of the respective months). Spring samples could only be obtained for the beginning of the season as FV Saga Sea concluded fishing in mid-September (fishing resumed in early December or in January the following year).
Timing (December 2013–September 2019), location and number of juvenile (J), female (F) and male (M) krill samples obtained for total mercury analysis. Each line corresponds to a fishing year, starting in December of the previous year and ending in September of the year indicated for each line (e.g. the first line presents data from fishing year 2014, which ran from December 2013 until September 2014). The timing (months and years) of krill fishing is indicated for each of the colour-coded locations (dark blue, South Georgia, SG; light blue, South Orkney Islands, SOI; and orange, Western Antarctic Peninsula, WAP). The red dashed vertical bars separate the months by season.
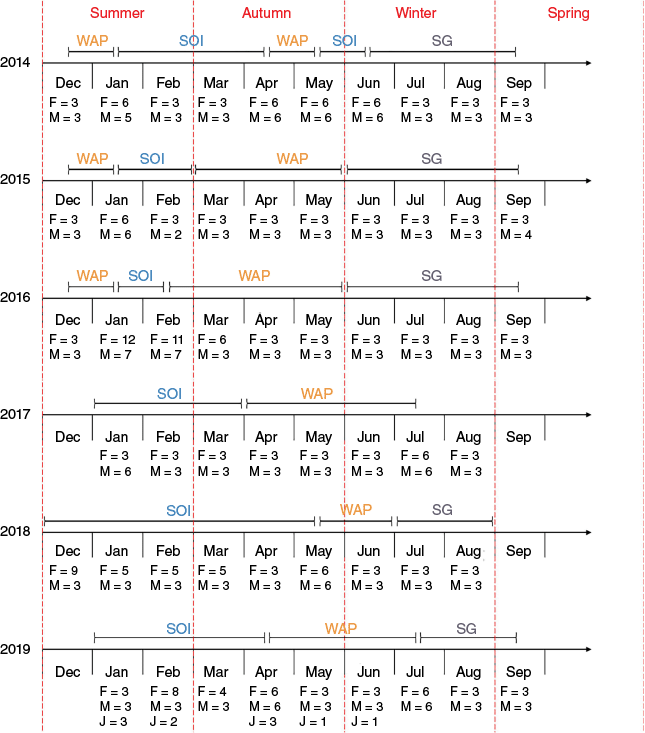
Fishing took place within the Commission for the Conservation of Antarctic Marine Living Resources (CCAMLR) Convention Area at WAP, SOI and SG (Food and Agriculture Organization (FAO) statistical subareas 48.1, 48.2 and 48.3 respectively; Supplementary material Fig. S1). The vessel predominantly fished at the WAP and SOI during summer and autumn, and at SG in winter and early spring. It moved between locations when sea-ice presence deterred fishing (WAP and SOI) or upon reaching subarea-specific maximum allowable catch quotas (WAP) or production goals (SG); fishing locations at a certain date therefore varied on a yearly basis.
A continuous catch system (Eco-Harvesting technology, Aker BioMarine) was used, which ensured that krill remained alive and intact while steadily pumped for 24 h from a mid-water trawl net onto FV Saga Sea. Twenty individuals were randomly sampled from the catch (there was no selection by size or maturity stage) every day by a fisheries observer. These were divided into two packages (either aluminium foil or a vacuum-sealed transparent plastic packet stored inside a dark package) and immediately frozen at −20°C for 4 h, being subsequently transferred to −80°C storage until shipping. Packages were transported on dry ice to the Institute for Marine and Antarctic Studies (Hobart, Australia), where they were stored in freezers at either −80 or −20°C until analysis.
Mercury analysis
An average of three samples for each male and female krill were chosen per fortnight for total Hg analysis, together with a few samples of juveniles (total n = 451; Fig. 2; Franco-Santos et al. 2025). Thawed individuals were sexed with a dissecting microscope and measured (‘Standard 1’ measurement from the tip of the rostrum to the tip of the uropod) according to Kirkwood (1982). They were then freeze-dried for 24 h and subsequently weighed (dry mass, DM); length and mass measurements were used as proxies for krill size. Most samples for Hg analysis pooled two to four individuals of the same sex and life stage, with sample length and weight representing the average of measurements from each pooled individual. A few samples pooled adults and subadults of the same sex (n = 31) and were considered as a third life stage category (adult only and subadult only were the other two) for statistical analyses.
Samples were homogenised to a fine powder (20–100 µm) using an IKA A11 Analytical micromill (MEDOS, Australia). Mercury analysis was conducted using a Milestone Direct Mercury Analyser (DMA-80 Tri-Cell; Milestone, Bergamo, Italy). The instrument was calibrated with an aqueous Hg standard for atomic absorption spectroscopy (AAS) (1000 mg L−1 of Hg in nitric acid; Sigma–Aldrich TraceCERT). A calibration curve was constructed by plotting the absorbances of standards against Hg concentrations in nanograms with an R2 value of 0.99 or higher. Samples were analysed using the US EPA Method 7473 (United States Environmental Protection Agency 1998); two blanks and three reference materials were analysed for every 40 samples. Approximately 100 mg of the sample was weighed in nickel boats. After every tenth sample, a replicate sample was analysed. When replicate recovery exceeded a variance of 10% compared to the original sample, a third replicate was run. Measured values for NIST SRM 1515 Apple leaves, NIST SRM1566b Oyster tissue and MURST-ISSA2 Antarctic Krill (42 ± 2 ng g−1, n = 33; 34 ± 4 ng g−1, n = 43; and 13 ± 1 ng g−1, n = 7 respectively) were in agreement with certified values (43.2 ± 2.3, 37.1 ± 1.3 and 13 ± 3 ng g−1 respectively).
Statistical analyses
To assess the overall importance of biological (size, sex and life stage), as well as abiotic (location and time – fishing year and month) variables on krill Hg concentrations, we fitted several generalised linear models (GLMs) to the data. We fitted separate models using length or mass as measures of individual size. Juveniles were not included in the analyses as their sample size was low (n = 10). We modelled the data with two different approaches for every combination of predictor variables, GLMs including main effects only and GLMs including main effects and a month–year interaction term, to allow for interannual variation in seasonal patterns. We used months rather than seasons for the interaction term because the former provided a better fit for the data regarding intraannual variation. The GLMs, including those without biological factors as predictor variables (the unbalanced study design resulted in a lack of statistical power for these factors), were compared using the Akaike information criterion (AIC). The comparison revealed that the main effects model with the month–year interaction term had optimal explanatory power, so these are the results we report. Given the high explanatory power of abiotic factors as predictor variables, we did not perform GLMs without them for comparison with the AIC. As data for December and September were missing for 2 out of 6 years, model predictions for those months are biased toward the years in which there are data. Other interaction terms were not included due to insufficient data coverage across all predictor variables (e.g. locations were not sampled over the same time periods – see Fig. 2). By excluding interactions, we assume that each variable’s effect operates independently of others, allowing us to capture broad trends across the dataset. As an example, seasonal patterns are treated as consistent across different locations, and differences in Hg concentrations associated with either sex or life stage are assumed to be stable regardless of other factors. Furthermore, given the right-skewed distribution of the data (Supplementary Fig. S2), we square root-transformed Hg concentrations and fitted the data using a scaled t-distribution (degrees of freedom and scaling parameters were estimated through maximum likelihood estimation), which is more robust to heavy tails and outliers than the normal distribution. Assessment of Q–Q plots and residual vs fitted plots confirmed model validity (using the scaled t-distribution for the residuals). An analysis of variance (ANOVA) was performed on each model to assess the significance of the main effects (length and mass, sex, stage, month, year and location) on square root-transformed Hg concentrations, using a scaled t-distribution for the residuals. The significance of each model term was assessed using a Wald test, as implemented in the R package mgcv (ver. 1(29), S. Wood, see https://cran.r-project.org/package=mgcv/). Wald tests are analogous to Type III ANOVA, in that they are useful for analysing imbalanced data and assessing the significance of each effect while accounting for the presence of other terms in the model. Pairwise comparisons were made using the Sidak method for adjusting P values for multiple comparisons and the R package emmeans (ver. 1.8.8, R. Lenth, see https://cran.r-project.org/package=emmeans/).
To further account for the incomplete coverage of biological metrics across other factors in the dataset, we also fitted Gaussian linear models to square root-transformed data with a two-way interaction between sex and life stage, focusing on the summer and autumn data from SOI and WAP, where all combinations of male and female and adult and subadult krill were sampled. For these, we excluded data from the mixed stage group (adult + subadults). Two-way ANOVAs were carried out using Type III Sum of Squares to account for data imbalance, but as the results were not statistically significant, we did not perform subsequent pairwise comparisons. We also conducted linear regressions between krill length and mass and Hg concentrations for each combination of location and season available in our data set.
Lastly, we obtained chlorophyll-a concentrations from Ocean Colour (Plymouth Marine Laboratory, see https://www.oceancolour.org/) to contrast trends with krill Hg. We downloaded the 5-day CCI_ALL-v6.0 chlorophyll data product (Sathyendranath et al. 2019) and averaged pixels to develop a time series. We then employed Vector Autoregressive Modelling (VAR) to examine the dynamic interrelationships between chlorophyll-a concentration and krill Hg across all sampling locations over time. By applying the VAR framework, we modelled the bi-directional influence of these variables, capturing both direct and lagged responses. An impulse response function was then generated to quantify how shocks to either chlorophyll-a or Hg concentrations propagate through the system over time, allowing us to visualise temporal effects and their statistical significance. Chlorophyll-a and Hg data were compared as concurrent 8-day averages. Modelling and diagnostics used to determine the number of lag terms were conducted using the R package vars (ver. 1.6-1, see https://cran.r-project.org/package=vars/; Pfaff 2008).
Data analyses and visualisation were performed in R (ver. 4.2.1, R Foundation for Statistical Computing, Vienna, Austria, see https://www.r-project.org/). Data manipulation was conducted using tools from the tidyverse package (ver. 2.0.0, see https://cran.r-project.org/package=tidyverse; Wickham et al. 2019).
Results and discussion
Baseline mercury data
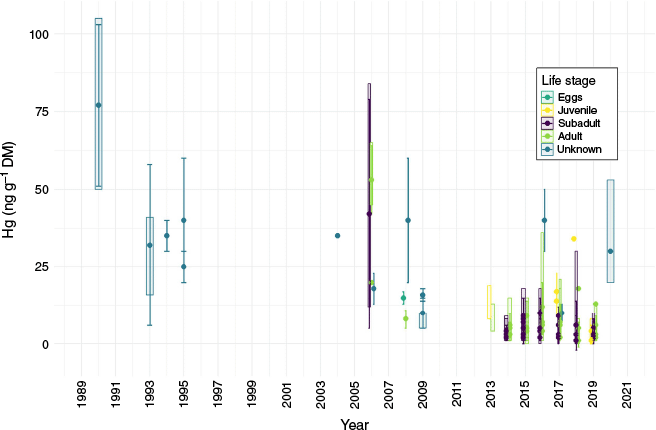
Mercury concentrations in krill averaged 5 ± 4 ng g−1 (w/w DM) and ranged from 0.05 to 21 ng g−1, with two additional high-concentration individuals containing 30 and 36 ng g−1 (Tables 1 and 2, Supplementary Fig. S2). Approximately half of our samples had Hg concentrations below 4 ng g−1. These data align with the lower range of previously reported values (Table 1). This likely reflects the higher proportion of our samples collected during autumn and winter (60%), when Hg concentrations are lower, compared to other studies that sample mostly during summer (see seasonality discussion below). Our concentrations exhibited a positively skewed distribution (Supplementary Fig. S2) typical of inherent variability attributed to genetics, age and other factors that may result in the variable uptake and retention of Hg (Lobel and Wright 1982; Lobel et al. 1982). Comparing data collected over the last 25 years (Table 1, Fig. 3), no substantial increase in krill Hg concentration is evident, despite increasing global Hg inputs and human activities in the Antarctic. The higher value recorded by Stoeppler and Brandt (1979) likely reflects the analytical capability at the time (lower instrument precision, greater likelihood of sample contamination during sampling, transport or analysis) rather than truly higher Hg concentrations.
| Year | Location | Hg (ng g−1 DM) | Reference | |
|---|---|---|---|---|
| 1978 A | Scotia Sea | <100 B | Stoeppler and Brandt (1979) | |
| 1989–1991 A | Ross Sea | 77 ± 26 (50–105) | Bargagli et al. (1998) | |
| 1993 | West Antarctic Peninsula | 31.7 ± 26.3 (16.1–40.9) | Locarnini and Presley (1995) | |
| 1993–1994 | Ross Sea | 35 ± 5 B | Caroli et al. (1998) | |
| 1994–1995 | Marguerite Bay (WAP) | 40 ± 20 B | Caroli et al. (1998) | |
| 1994–1995 | Livingston Island (WAP) | 25 ± 5 B | Caroli et al. (1998) | |
| 2004 A | Admiralty Bay (WAP) | 34.6 | dos Santos et al. (2006) | |
| 2004–2008 A | King George Island (WAP) | 18 ± 5 | Cipro et al. (2017) | |
| 2006 A | SW Indian Ocean sector of Southern Ocean (60–70°S, 30–80°E) | Sa = 42 ± 37 (12–84); Ad = 53 ± 11 (45–65); FSP = 20 ± 0 (20–20) | Bengtson Nash et al. (2021) | |
| 2007–2008 A | South Georgia | E = 15 ± 2; F = 8 ± 3 | Seco et al. (2019) | |
| 40 ± 20 | Seco et al. (2021a) | |||
| 2007–2008 and 2010–2011 | Palmer Long-Term Ecological Research study area (WAP) | 16 ± 2 | Brault (2012) | |
| 2009 A | Admiralty Bay (WAP) | 10 ± 5 (5–10) B | Polito et al. (2016) | |
| 2011–2015 A | Anvers Island (WAP) | Ad = (4.04–12.6); J = (7.85–19.4) | Sontag et al. (2019) | |
| 2015–2016 A | South Orkney Islands | Ad = 51 ± 15 (F = 54 ± 18, M = 48 ± 11); J = 71 ± 24 | Seco et al. (2019) | |
| Scotia Sea | 40 ± 10 | Seco et al. (2021b) | ||
| 2016–2017 A | South Georgia | Ad = 7 ± 2 (F = 6 ± 2, M = 7 ± 2); J = 14 ± 5 | Seco et al. (2019) | |
| Polar Front | J = 17 ± 6 | Seco et al. (2019) | ||
| South Georgia | 10 ± 3 | Seco et al. (2021a) | ||
| 2018 C | West Antarctic Peninsula | 20 (Ad = 18, J = 34), median = 10 | Korejwo et al. (2023) | |
| 2020 A | Weddell Sea | 30 (19.5–53) | Mirzoeva et al. (2022) | |
| 2013–2019 | South Georgia | 3 ± 2 (0.05- 12.0) FS = 3 ± 2 (0–11); M = 3 ± 2 (0–7); MS = 4 ± 3 (1–12) | This study | |
| 2013–2019 | South Orkney Islands | 6 ± 5 (0.3–35.5) F = 8 ± 5 (2–36); FS = 4 ± 3 (1–10); M = 5 ± 4 (1–18); MS = 6 ± 5 (0–30); J = 4 ± 2 (2–8) | This study | |
| 2013–2019 | West Antarctic Peninsula | 4 ± 4 (0.05–20.1) F = 7 ± 4 (1–20); FS = 3 ± 3 (1–15); M = 7 ± 4 (1–13); MS = 4 ± 4 (0–18); J = 1 ± 1 (0–2) | This study |
Where available, and unless stated otherwise, Hg concentrations are reported as nanograms per gram of dry mass (ng g–1 DM) and presented as mean (in bold) ± 1 standard deviation, with the range in parentheses if available. Where available, letter coding indicated sex and life stage of individuals analysed: F, female; FS, subadult female; FSP, spent female; M, male; MS, subadult male; Ad, adults; Sa, subadults; E, eggs; J, juveniles; WAP, Western Antarctic Peninsular. Studies providing Hg values for krill obtained from predator stomach contents were not included.
| Location | Season and year | Juveniles | Subadult females | Subadult males | Adult females | Adult males | |||||||||||
|---|---|---|---|---|---|---|---|---|---|---|---|---|---|---|---|---|---|
| Length | DM | Hg | Length | DM | Hg | Length | DM | Hg | Length | DM | Hg | Length | DM | Hg | |||
| SG | Sp 2014 | 41 ± 2 (40) | 94 ± 13 (88) | 4 ± 2 (5) | 39 | 79 | 8 | 44 ± 0 (44) | 129 ± 4 (129) | 5 ± 3 (5) | |||||||
| W 2014 | 37 ± 3 (36) | 85 ± 26 (78) | 4 ± 1 (3) | 39 ± 2 (39) | 109 ± 11 (109) | 2 ± 0 (2) | 42 | 116 | 3 | ||||||||
| Sp 2015 | 45 ± 1 (45) | 142 ± 18 (138) | 5 ± 1 (5) | 46 ± 3 (45) | 158 ± 32 (154) | 5 ± 1 (5) | |||||||||||
| W 2015 | 44 ± 3 (43) | 160 ± 44 (151) | 2 ± 1 (2) | 48 ± 2 (46) | 214 ± 29 (212) | 2 ± 0 (2) | 48 ± 0 (48) | 223 ± 25 (223) | 2 ± 3 (2) | ||||||||
| Sp 2016 | 41 ± 2 (40) | 107 ± 17 (110) | 6 ± 3 (7) | 41 ± 3 (40) | 111 ± 26 (111) | 8 ± 2 (8) | |||||||||||
| W 2016 | 42 ± 4 (43) | 139 ± 25 (142) | 5 ± 4 (4) | 44 ± 2 (45) | 185 ± 40 (187) | 3 ± 4 (2) | 46 | 190 | 4 | ||||||||
| W 2017 | 38 ± 2 (37) | 93 ± 18 (91) | 3 ± 1 (2) | 36 ± 4 (37) | 91 ± 28 (86) | 3 ± 2 (3) | 44 | 155 | 2 | ||||||||
| W 2018 | 46 ± 2 (45) | 177 ± 37 (174) | 1 ± 1 (0) | 48 ± 3 (48) | 216 ± 48 (207) | 1 ± 2 (1) | |||||||||||
| Sp 2019 | 40 ± 2 (40) | 87 ± 21 (87) | 6 ± 2 (6) | 41 | 98 | 4 | |||||||||||
| W 2019 | 39 ± 3 (40) | 121 ± 29 (127) | 2 ± 1 (2) | 36 ± 3 (36) | 83 ± 17 (84) | 3 ± 1 (3) | 45 ± 2 (45) | 188 ± 29 (188) | 2 ± 1 (2) | ||||||||
| SOI | Su 2013–2014 | 47 ± 2 (47) | 260 ± 53 (260) | 8 ± 1 (8) | 48 ± 3 (48) | 237 ± 58 (256) | 7 ± 5 (6) | 49 ± 5 (48) | 283 ± 105 (252) | 4 ± 1 (4) | |||||||
| A 2014 | 44 ± 3 (44) | 151 ± 23 (142) | 2 ± 1 (2) | 44 ± 3 (44) | 170 ± 53 (146) | 3 ± 1 (3) | 47 ± 0 (47) | 244 ± 12 (244) | 4 ± 0 (4) | 45 | 277 | 4 | |||||
| W 2014 | 43 ± 2 (43) | 146 ± 37 (135) | 3 ± 1 (2) | 51 | 280 | 1 | |||||||||||
| Su 2014–2015 | 38 ± 2 (38) | 123 ± 15 (131) | 8 ± 2 (9) | 41 ± 2 (41) | 135 ± 23 (129) | 7 ± 2 (6) | 44 | 137 | 9 | ||||||||
| Su 2015–2016 | 47 ± 3 (48) | 274 ± 74 (286) | 10 ± 5 (10) | 49 ± 3 (49) | 234 ± 38 (241) | 12 ± 8 (10) | 46 ± 1 (46) | 204 ± 17 (204) | 7 ± 1 (7) | ||||||||
| Su 2016–2017 | 40 ± 2 (40) | 114 ± 20 (122) | 6 ± 2 (6) | 50 ± 3 (49) | 198 ± 44 (178) | 8 ± 4 (8) | 52 ± 2 (52) | 259 ± 97 (253) | 7 ± 6 (5) | ||||||||
| A 2017 | 44 ± 2 (44) | 105 ± 23 (105) | 9 ± 3 (9) | 41 ± 3 (40) | 147 ± 29 (145) | 6 ± 2 (5) | |||||||||||
| Su 2017–2018 | 42 ± 1 (42) | 171 ± 17 (166) | 5 ± 1 (4) | 44 ± 4 (43) | 196 ± 53 (162) | 6 ± 3 (5) | 44 ± 5 (45) | 197 ± 67 (186) | 6 ± 4 (5) | ||||||||
| A 2018 | 46 ± 2 (46) | 220 ± 46 (217) | 3 ± 2 (2) | 47 ± 1 (47) | 231 ± 20 (230) | 5 ± 10 (2) | 52 ± 3 (52) | 253 ± 37 (260) | 4 ± 1 (4) | ||||||||
| Su 2018–2019 | 37 ± 2 (37) | 107 ± 27 (115) | 5 ± 2 (5) | 41 ± 5 (41) | 162 ± 73 (136) | 5 ± 1 (6) | 47 ± 4 (48) | 170 ± 79 (156) | 6 ± 3 (6) | 51 | 339 | 5 | |||||
| A 2019 | 42 ± 2 (42) | 163 ± 9 (163) | 2 ± 0 (2) | 50 ± 3 (51) | 264 ± 57 (273) | 3 ± 3 (2) | 45 ± 4 (47) | 220 ± 89 (220) | 4 ± 4 (2) | 52 | 321 | 5 | 51 | 273 | 1 | ||
| WAP | Su 2013–2014 | 48 | 208 | 5 | 45 ± 4 (45) | 170 ± 88 (159) | 10 ± 4 (10) | 43 ± 2 (42) | 131 ± 50 (108) | 10 ± 6 (8) | 42 | 107 | 12 | ||||
| A 2014 | 40 ± 2 (40) | 105 ± 18 (101) | 2 ± 2 (2) | 43 ± 3 (43) | 145 ± 34 (155) | 2 ± 1 (2) | 51 | 187 | 2 | ||||||||
| Su 2014–2015 | 44 ± 3 (44) | 183 ± 40 (163) | 7 ± 1 (7) | 43 ± 1 (43) | 158 ± 41 (159) | 7 ± 1 (7) | 44 | 163 | 9 | ||||||||
| A 2015 | 41 ± 3 (41) | 134 ± 25 (137) | 5 ± 5 (3) | 40 ± 1 (41) | 127 ± 12 (128) | 6 ± 6 (5) | 47 | 222 | 2 | 49 ± 2 (49) | 221 ± 8 (221) | 2 ± 0 (2) | |||||
| Su 2015–2016 | 45 ± 4 (44) | 187 ± 91 (159) | 11 ± 5 (10) | 47 ± 5 (46) | 230 ± 101 (208) | 8 ± 4 (8) | 48 ± 2 (49) | 313 ± 47 (326) | 7 ± 1 (7) | ||||||||
| A 2016 | 48 ± 2 (48) | 244 ± 45 (236) | 2 ± 1 (1) | 47 ± 6 (50) | 251 ± 92 (291) | 2 ± 2 (2) | 50 ± 6 (51) | 253 ± 95 (253) | 4 ± 4 (3) | 49 | 276 | 1 | |||||
| A 2017 | 45 ± 3 (45) | 177 ± 45 (183) | 2 ± 2 (1) | 46 ± 0 (46) | 201 ± 32 (205) | 1 ± 1 (1) | |||||||||||
| W 2017 | 42 ± 4 (40) | 146 ± 33 (125) | 2 ± 1 (2) | 40 ± 1 (40) | 138 ± 7 (139) | 3 ± 2 (3) | |||||||||||
| A 2018 | 38 ± 2 (38) | 133 ± 27 (125) | 1 ± 0 (1) | 41 ± 2 (42) | 142 ± 8 (144) | 1 ± 1 (1) | |||||||||||
| W 2018 | 43 ± 2 (44) | 151 ± 25 (163) | 2 ± 0 (2) | 44 ± 2 (43) | 172 ± 31 (165) | 4 ± 4 (2) | |||||||||||
| A 2019 | 37 ± 3 (37) | 98 ± 20 (98) | 1 ± 2 (1) | 42 ± 4 (41) | 136 ± 48 (127) | 3 ± 1 (2) | 42 ± 3 (41) | 149 ± 35 (139) | 2 ± 1 (1) | 46 | 155 | 13 | |||||
| W 2019 | 28 | 47 | 1 | 40 ± 4 (40) | 109 ± 31 (105) | 4 ± 4 (2) | 36 ± 2 (35) | 88 ± 17 (80) | 3 ± 2 (3) | ||||||||
Values are reported as mean ± 1 standard deviation, with the median in parentheses. Samples without replicates only have a mean value. Empty cells indicate combinations of categories for which we did not have samples. Data for samples pooling adults and subadults are not included. SG, South Georgia; SOI, South Orkney Islands; WAP, Western Antarctic Peninsular; A, autumn; Sp, spring; Su, summer; W, winter.
Compilation of historical and current (1989–2020) mercury (Hg) concentration (ng g−1 dry mass, DM) in krill sampled from various locations around Antarctica (see Table 1 for site names and publication references; values from Stoeppler and Brandt (1979) are excluded due to likely lower instrument precision). Circles, vertical bars and shaded rectangles represent mean, standard deviation and range values, when available. Life stages, when known, are indicated by different colours: dark green, eggs; yellow, juveniles; purple, subadults; light green, adults; and dark blue, individuals of unknown life stage.
The influence of biological metrics (size, sex and life stage) on mercury concentrations in krill
Krill ranged in length from 28 to 58 mm and in weight from 44 to 479 mg DM (mean ± 1 standard deviation: 44 ± 5 mm and 174 ± 70 mg DM; Table 2). The GLM showed that length had a significant, although minor, negative effect on Hg concentrations (Wald test: χ2 = 7.5, P = 0.006), contributing to only 0.9% of the total (53.8%) deviance explained by the GLM. We obtained a similar result when the data were categorised by location and season: significant negative correlations, but only for SG krill in the winter and WAP krill in the summer (Fig. 4a; R2 = 0.17 and 0.21, P < 0.001 and = 0.001). Even then, only 17 and 21% of the variance was explained by the regression. The relationship between krill dry mass and Hg concentrations (Fig. 4b) was similar to that described for krill length. Dry mass had greater predictive power than length as an explanatory variable in the GLM, with a significant and slightly negative effect on Hg concentrations (Wald test: χ2 = 26.0, P < 0.001), explaining 3.8% of the total (55%) deviance. We also observed significant negative correlations between DM and Hg in SG krill during winter and WAP krill during summer (Fig. 4b; R2 = 0.12 and 0.26, P < 0.001), as well as in SOI and WAP krill during autumn (R2 = 0.07 and 0.10, P = 0.047 and 0.005). Linear regressions only explained 7–26% of the variability in the data. Given the superior performance of the mass models (in comparison to length), we only report mass-based GLM results henceforth, with results for length-based models reported in Supplementary Table S1. It should be noted that any conclusions about bioaccumulation based on length or mass could be confounded by the fact that female and male krill reach maturity at different lengths (35–36 and 43–44 mm respectively) (Siegel and Loeb 1994; this study), although we did not find evidence for the latter (Supplementary Fig. S3).
Scatter plots of krill mercury (Hg) concentrations (ng g−1 dry mass, DM) against krill (a) length (mm) and (b) dry mass (mg). Life stages are colour-coded, with the samples pooling adult and subadult data making up their own category. Linear regressions for the relationship between the square-root of Hg and length (L) or dry mass (M) and their determination coefficients (R2) and P values are shown in each graph, this is within levels of location (vertical facets; SG, South Georgia; SOI, South Orkney Islands; WAP, Western Antarctic Peninsula) and season (horizontal facets). Statistically significant results (α = 0.05) are indicated by black boxes around P values.
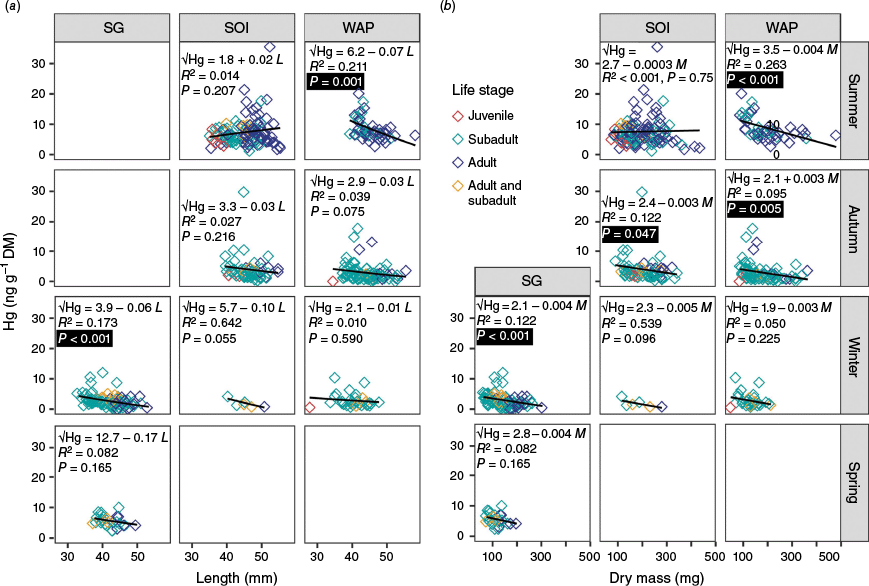
A two-orders of magnitude range is typically required to obtain clear relationships of metal and metalloid concentration with animal biomass (Boyden 1977), which could explain the minor role of dry mass in our results. As krill grow and age, their Hg concentrations are likely to decrease because their growth rate exceeds the rate at which they accumulate Hg (Korejwo et al. 2023). Although we observed a trend of slightly lower Hg concentrations in larger krill, this relationship was not as pronounced or statistically significant as that reported in many other studies (Locarnini and Presley 1995; Corbisier et al. 2004; Seco et al. 2019; Sontag et al. 2019; Bengtson Nash et al. 2021; Korejwo et al. 2023). The lack of strong relationships between krill size (length and mass) and Hg concentrations in our study is most likely explained by the lack of juvenile samples (i.e. smaller individuals with higher Hg concentrations) in the dataset. Furthermore, length and mass are not necessarily good indicators of age as, depending on food availability, female krill can shrink in winter and increase in size during reproduction (Tarling et al. 2016; Korejwo et al. 2023). Both male and female krill also lose mass during winter food shortages as they consume their lipid reserves to supplement nutrition from opportunistic feeding (if any) (e.g. Torres et al. 1994).
Predicting Hg concentrations in krill based on their life and maturity stage was also not straightforward. The effect of sex was not statistically significant in the GLM (Wald test: χ2 = 0.4, P = 0.51), nor could we find clear differences when comparing between seasons within locations or throughout the dataset (Table 2; Supplementary Fig. S4 and S5). Results were similar for summer and autumn data for the SOI and WAP, both within adult and subadult life stages (Supplementary Tables S2 and S3). The pattern revealed by our GLM, plots and ANOVAs (krill sex is unrelated to Hg concentrations) is expected, given the lack of evidence for sex-specific differences in krill food intake (Polito et al. 2013); this also agrees with previous results from published studies for adult krill (e.g. Seco et al. 2019; Korejwo et al. 2023). Krill life stage also had no significant influence on Hg concentrations (Table 2) in our GLM (Wald test: χ2 = 3.6, P = 0.17) and ANOVAs for the SOI and SG during summer and spring (Supplementary Tables S2 and S3). Juvenile krill often exhibit a wide range of Hg concentrations; in our study, they were not significantly higher than those of subadult and adult krill. Our low juvenile sample size may have only captured individuals at the lower range, so we could not meaningfully verify this trend. Studies that revealed different Hg concentrations between juveniles and adult krill often condensed various maturity stages into one adult stage category. When these maturity stages are disentangled, differences in Hg concentrations to juveniles may not be significant. Korejwo et al. (2023) reported statistically significant differences in Hg concentrations between juveniles and adults, but non-significant results were observed between juveniles, subadults and two adult maturity stages. The latter agrees with our findings, and both show that a finer resolution within the adult substages better represents the gradual changes in Hg concentration with krill development.
The influence of abiotic metrics (location and season) on mercury concentrations in krill
Many factors are believed to contribute to geographical differences in krill Hg concentrations, which may vary temporally. All our samples were obtained by the same fishing vessel, and locations were sampled at different times of the year. This led to an unbalanced dataset in which the timing of fishing was location-dependent (during summer–autumn, autumn–winter and winter–spring in SOI, WAP and SG respectively; Fig. 2). Of the 56 unique month and year combinations for which we have data, only 11 contained samples from two locations, and none from all three sites. Although the GLM revealed statistically significant differences (Wald test: χ2 = 11.2, P < 0.01), it estimated the effect of each location as a separate coefficient, extrapolating across months and years during which locations were not sampled. This translated into a lack of statistical power for geographic location as a predictor variable (e.g. only 1.7% of the 55% total deviance was explained by the GLM), preventing us from speculating about its influence on krill Hg concentrations. Where comparisons were available between locations for a given month (Fig. 5, Tables 1 and 2), values appeared to be similar, providing some confidence that any seasonal variations discussed below are not confounded by an effect of location. Volcanic activity had no influence on Hg concentrations in our study, as none of the WAP sites showed significantly elevated Hg concentrations.
Monthly average influence of seasonality (by sampling month) on krill mercury (Hg) concentrations (ng g−1 dry mass, DM) per year sampled (a) and over all years (b). Months in (a) begin in December of the previous year to facilitate visualisation in terms of seasons as well as months. Colours indicate sampling locations (purple for South Georgia, SG; light blue for South Orkney Islands, SOI; orange for Western Antarctic Peninsula, WAP). The horizontal black bars are estimated marginal means from a GLM including main effects with interannual variability in seasonal effects (month–year interaction term). Shaded rectangles represent the 95% confidence intervals on the estimated marginal means. Months with different letters (a through f) at the bottom of the plot in (b) had significantly different Hg concentrations based on estimated marginal means averaged over all other factors in the GLM.
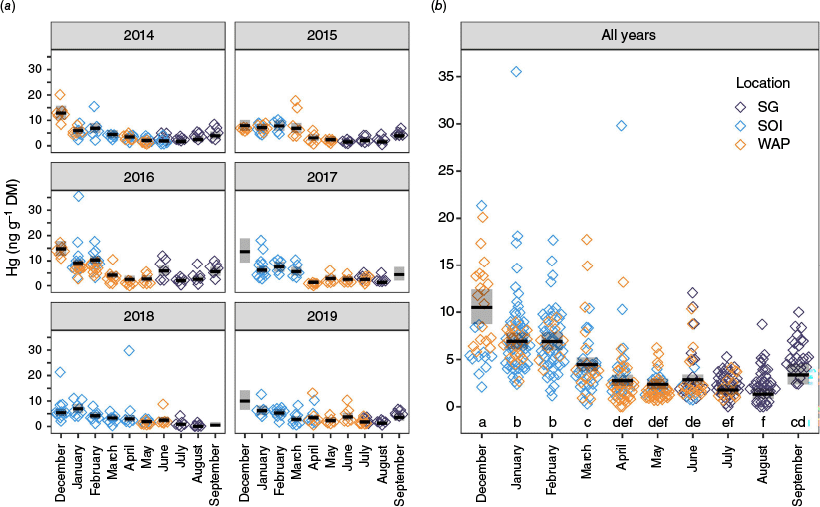
Mean Hg concentrations in our study were considerably and consistently lower in autumn and winter (3 ± 4 and 3 ± 2 ng g−1) than in spring and summer (6 ± 2 and 8 ± 4 ng g−1) (Fig. 5, Table 2). When results were looked at on a yearly basis, this pattern still held, although with month-specific variations (Fig. 5a). For example, December concentrations were higher in 2013, 2015 and 2016 than in 2014, 2017 and 2018, and March concentrations at times resembled values from summer. The GLM revealed that the month (Wald test: χ2 = 138, P < 0.001) and month–year interaction (Wald test: χ2 = 135, P < 0.001) terms had the strongest influence on Hg concentrations in krill, explaining 20 and 20.6% of the model deviance (55% in total). The fishing year also had a significant influence (Wald test: χ2 = 58, P ≤ 0.001) and explained 8.6% of the deviance in Hg concentration data. Estimated marginal mean concentrations averaged across years within the GLM were significantly higher in summer months (December to February) relative to other sampled months (Supplementary Table S4), with Hg concentrations in December higher than those in January and February (Fig. 5b; Sidak-adjusted pairwise comparison: t-ratios = 4.13 and 3.95 respectively, P values <0.01). Estimated mean concentrations in March were significantly lower than those in summer and higher than other autumn and winter months (Supplementary Table S4), highlighting March as a period from which krill Hg concentrations start decreasing. Similarly, the estimated mean concentrations in September were significantly higher than those for July and August but were statistically indistinguishable from those between March and June (Fig. 5b, Supplementary Table S4). The latter highlighted September as a period in which krill Hg concentrations were increasing again towards an early summer maximum.
Ecological processes and mercury concentrations in krill
The best GLM fitted to our data revealed that krill size, as well as the location and timing of sampling, all contribute to explaining Hg concentrations in individuals, with the latter showing the highest prediction power (Supplementary Table S1). Ecological processes interlink these variables and need to be considered jointly to understand Hg intake and accumulation in krill. Different krill life stages tend to inhabit different open ocean (deep and shallow water) and coastal (ice covered and ice free) locations (Fig. 1). Krill spawn offshore in areas where high export of phytoplankton to depth and subsequent organic matter remineralisation promotes biomethylation of Hg to MeHg (Cossa et al. 2011; Blum et al. 2013; Sontag et al. 2019), which they readily bioaccumulate. Larval populations develop in this environment and, as such, juvenile krill are expected to develop amid higher MeHg concentrations, resulting in higher Hg concentrations in their tissues – a pattern we could not verify due to our small juvenile sample size. Larvae and juveniles migrate toward coastal areas where ice forms, being thus subject to glacial inputs (Canário et al. 2017; Chiang et al. 2021; Matias et al. 2022), where higher biomethylation and MeHg concentrations are also expected (Bargagli et al. 1998; Sontag et al. 2019). Adult krill feed less during winter due to their reduced metabolic rate (both may be triggered by photoperiod; Meyer 2012 and references therein), while juveniles continue to feed, accumulating Hg in their tissues (Meyer et al. 2009, 2010; Schaafsma et al. 2017; Korejwo et al. 2023). The above-mentioned processes are all linked to light and temperature, which vary spatially and temporally in the Southern Ocean, making it difficult to differentiate the influence of krill life stages on Hg concentrations from that of location and time.
Based on our results, which contained several adult maturity substages (Supplementary Fig. S6 and S7), and on the literature, we propose that krill undergo three major changes in Hg concentration pattern during the juvenile-to-adult transition. The first is a decrease in Hg concentration from the juvenile to the subadult stage, as juveniles are expected to accumulate more Hg than (sub)adults due to their higher metabolic demands (i.e. they eat more) and to greater Hg availability in the environment they occupy. As they become subadults, accumulated Hg is ‘diluted’ by a larger body mass, and krill Hg intake and assimilation decrease comparatively (Karimi et al. 2007; Korejwo et al. 2023). Concentrations then increase as subadults gradually mature into adults and decrease again when gravid females spawn and males release spermatophores (as suggested by Seco et al. 2019).
Seasonal and interannual variations in light and temperature at a location also lead to highly variable phytoplankton production and microbial communities (Clarke and Leakey 1996; Bargagli et al. 1998). Some studies have suggested a shift in the proportion of phytoplankton-to-zooplankton intake during krill development might affect Hg bioaccumulation (Polito et al. 2013; Sontag et al. 2019). Antarctic summers are characterised by higher light availability and water temperatures (than winters), such that primary production is highly seasonal in the Southern Ocean. The summer phytoplankton biomass results in krill selectively grazing on diatoms. The seasonality of primary production in Antarctica is also reflected in consumer over-wintering strategies (Bargagli et al. 1998). As krill grow and the availability of summer phytoplankton decreases, larger individuals may adjust their diet and foraging range, transitioning to consuming heterotrophs such as small copepods and protozoans (Polito et al. 2013) (Fig. 1). During winter, adult krill feeding activity is reduced considerably in comparison to spring (14% of spring feeding rates), although it is still sufficient to avoid shrinkage or to survive the season (Torres et al. 1994; Meyer et al. 2010). Owing to the food shortage, krill primarily sustain themselves by extensively using their lipid reserves (Hagen et al. 2001; O’Brien et al. 2011), at a rate of ~10% body lipid dry mass−1 month−1 (Meyer 2012), with the lipid content decreasing to 25% of its maximum content (Hagen et al. 1996).
Several studies have linked lipid stores to the bioaccumulation of toxic organic substances (reviewed by Kainz and Fisk 2009), prompting us to look for relationships between Hg and total fatty acid (TFA) concentrations in krill (Ericson et al. 2018; Hellessey et al. 2018; R. M. Franco-Santos, P. D. Nichols and P. Virtue unpubl. data). When these variables are plotted (Fig. 6a), the mismatch between their highest and lowest concentrations is evident – Hg peaks in early summer (in the absence of late spring data), and is less than half that content by April–May (autumn). In comparison, TFA concentations peak in autumn and reduce significantly during winter to the lowest in spring. We offer three possible explanations for this pattern, although further studies are needed to fully confirm them. The first would involve the physiological elimination mechanisms previously mentioned (Seco et al. 2019). Lipids are a major component of eggs and sperm; if Hg bioaccumulates within lipid stores, we can expect an immediate decrease in Hg concentration when krill release sperm and spawn. Krill gonad maturation starts in spring, with reproduction occurring between mid-November and March (Witek et al. 1980). Most (68%) of our adult female samples had yet to develop eggs during summer (December–February), indicating that spawning in the sampled locations occurred towards the end of the reproductive period. Our data might have provided evidence for such a relationship if we knew the timing of spawning events. The potentially lagged response of Hg concentration (lowest in April to May) to reproduction (November to March) suggests that this mechanism had a minor role in explaining our results.
Relationships between mercury (Hg) concentration (ng g−1 dry mass, DM) and total fatty acid (TFA) content (µg g−1 wet mass, WM) in krill with satellite-derived sea surface chlorophyll-a concentrations (µg L−1). The average comparison between Hg concentration (blue line) and FA content (red line) over the sampling period (from different individuals collected by the same sampling effort; Ericson et al. 2018; Hellessey et al. 2018; Franco-Santos et al., unpubl. data) is shown in (a), whereas (b) and (c) present time series (diamond points; error bars are ±1 s.d.) of daily mean krill Hg concentration and FA content overlayed with 8-day average (lines) chlorophyll-a concentrations (respectively). Colours indicate the sampling location (purple for South Georgia, SG; light blue for South Orkney Islands, SOI; orange for Western Antarctic Peninsula, WAP).
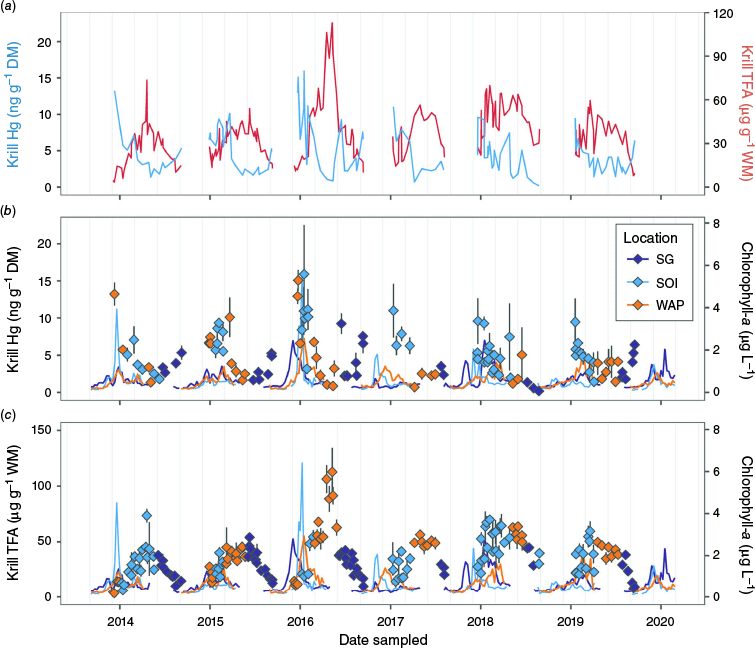
Another explanation for the mismatch between Hg and TFA concentrations would consider lipid and protein dynamics in krill, as these and other dietary components have a physiological interaction with Hg (Olsvik et al. 2011). Were Hg in lipids, we would expect the former to peak in autumn, together with TFAs, rather than to bottom out, as was observed (Fig. 6). Lavoie et al. (2010) propose that lipid-rich organisms are expected to have a low Hg concentration for a Canadian food web. This would be due to (1) MeHg having a high chemical affinity to sulfhydryl groups from certain proteins (Wolfe et al. 1998), as seen for fish (Bloom 1992) and cephalopods (Bustamante et al. 2006), and (2) the proportion of proteins being inversely related to that of lipids (i.e. only one is metabolised for energy). Previous studies report lower protein content in adult krill in autumn than in winter and summer (Meyer et al. 2010; Kim et al. 2014), potentially following its metabolism during the summer while lipids are accumulated (Meyer 2012), and negligible use of proteins for energy provision in winter (~3% body protein–1 DM month−1; Meyer et al. 2010; Meyer 2012). The MeHg–protein association could potentially explain our results. We know that protein-affinitive organic Hg (i.e. MeHg) in adult krill accounts for 5–37% of total Hg (Seco et al. 2019; Sontag et al. 2019; Korejwo et al. 2023). In addition, the significant drop in Hg concentration between summer and mid-late autumn and subsequent increase between autumn and winter follows the same seasonal pattern described for protein content in adult krill.
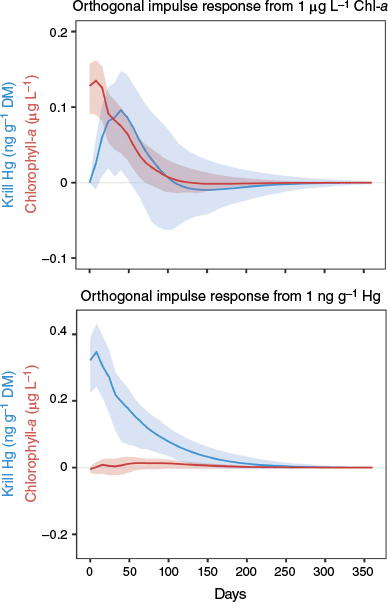
In our study, total Hg concentrations appear to be synchronised with phytoplankton bloom intensity, as evidenced by increased sea-surface chlorophyll-a concentrations (Fig. 6b, c). Korejwo et al. (2023) reported that an average of 48% of the Hg fraction in E. superba (April, WAP) is labile (inorganic) Hg-halides. The latter are known to be an important fraction of Hg species in microorganisms, including phytoplankton (Bełdowska et al. 2018), and their presence in large amounts in krill, therefore, signifies feeding on phytoplankton. The impulse response function based on the Vector Autoregressive Modelling of chlorophyll-a and krill Hg concentrations demonstrates that there is a 32–40-day lag between an increase in the former and peak values for the latter, with the resulting increase in krill Hg (~0.1 ng g−1 DM) subsiding to baseline values after ~3 months (Fig. 7). We propose, therefore, that the seasonality in krill Hg concentrations is affected by both the dietary uptake of labile Hg-halides during the annual phytoplankton bloom period (spring through summer) and by the relationship between MeHg and certain proteins, with spawning potentially and partially explaining Hg loss during autumn. Hg-halides do not tend to biomagnify (Lawson and Mason 1998), but MeHg does, which could be problematic despite its lower concentrations (than the former). Future analyses of Hg speciation in krill may also shed light on the role of lipids in Hg assimilation.
Impulse Response Function based on a Vector Autoregressive Model of satellite-derived sea surface chlorophyll-a (µg L−1) and krill Hg (ng g−1 dry mass, DM) concentrations (red and blue lines respectively; shaded areas represent 95% confidence intervals based on bootstrapping). The upper panel shows that an impulse of 1 µg L−1 chlorophyll-a leads to an increase in krill Hg concentration, which peaks ~32–40 days later. It then subsides ~80–100 days later. Note that, although the computed impulse for chlorophyll-a was 1 µg L−1, a self-feedback mechanism led to a net change of only 0.05 µg L−1 at the next time step. The bottom panel shows that an increase in Hg does not influence chlorophyll-a concentrations, confirming that there is a clear response of Hg to chlorophyll-a.
Bioaccumulation and biomagnification
Antarctic phytoplankton passively assimilate inorganic Hg and MeHg from the surrounding water; the former mainly binds to algal cell membranes, whereas the latter accumulates in their cytoplasm (Mason et al. 1996). This physiological difference leads to a 4× greater assimilation of MeHg by primary consumers than inorganic Hg (Mason et al. 1995, 1996). The higher transfer efficiency of MeHg to higher trophic levels, coupled with differences in species’ abilities to eliminate it, is the basis for its biomagnification potential in complex food webs (see Lavoie et al. 2013 for a summary of physical, chemical and biological controls on the process). Many food web studies have reported that bioaccumulation and biomagnification of toxic substances occur in Antarctic marine food webs, however, the role played by krill in this process is unclear (Stowasser et al. 2012). The krill-centred Antarctic food chain is relatively simple, comprising phytoplankton, filter-feeding krill and select vertebrate predators. Interannual shifts in prey availability may result in krill and higher trophic level species consuming alternate prey (Seco et al. 2021). When evaluating Hg biomagnification, it’s important to carefully define and limit the scope of krill-based food webs, especially when the consumer species is migratory, and to provide evidence (e.g. mass balance calculations) for any biomagnification claims.
To verify if Hg biomagnification reflects the krill-based Antarctic food webs, we conducted simple mass balance calculations for Antarctic baleen (blue, fin and humpback) whales using the equation
and available data on: whale-specific ingestion rates (IK, g krill day−1), feeding frequency (IF, days year−1), life span (LS, years) and average weight (Wwm, g wet mass, WM), and krill-specific Hg (K[Hg], µg g−1 WM) and MeHg (K[MeHg], as a percentage of total Hg) contents. The resulting range of values for whale MeHg concentration (W[MeHg], µg g−1 WM) was then compared to values reported in the literature (Table 3). Our mass balance results were within (although narrower than) the range reported in the literature. The proportion of MeHg (as a percentage of total Hg) in whales has been reported as 82% (Sanpera et al. 1993) and 106% (Maage et al. 2017); given the likelihood of errors in MeHg estimation in the early 1990s and the fact that total Hg and inorganic Hg are not readily transferred to higher trophic levels, we assumed the value to be 100%. It should be noted that Hg concentrations obtained for whales were not accompanied by the corresponding individual size and age.
| Whale species | IK | IF | LS | K[Hg] | K[MeHg] | Wwm | Range | W[MeHg] | |
|---|---|---|---|---|---|---|---|---|---|
| Blue | 5.4–14.5 × 10⁶ (Savoca et al. 2021; NOAA Fisheries 2023a) | 120 (SeaWorld 2024) | 80–90 (NOAA Fisheries 2023a) | 2.2 × 10⁻³ (averaged means from Table 1 except Stoeppler and Brandt 1979) | 5–37% (Seco et al. 2019; Sontag et al. 2019; Korejwo et al. 2023) | 4.5–15 × 107 (NOAA Fisheries 2023a) | 0.04–2.83 | 0.34 (Trumble et al. 2013) | |
| Fin | ≤ 1.8 × 10⁶ (Oceanwide Expeditions 2024) | 275 (NOAA Fisheries 2023b) | 80–90 (NOAA Fisheries 2023b) | 3.6–7.3 × 10⁷ (NOAA Fisheries 2023b) | 0.06–10.07 | 0.02–0.09 (Endo et al. 2012) | |||
| Humpback | 4.6 × 10⁵ (Owen et al. 2017) | 275–365 (Owen et al. 2017) | 80–90 (NOAA Fisheries 2024) | ≤3.6 × 10⁷ (NOAA Fisheries 2024) | 0.03–0.34 | 0.001–1.3 (Bengtson Nash et al. 2021) |
After calculating all possible results for a given species (Range), the resulting range in Hg concentration is compared with the whale MeHg content (W[MeHg], µg g−1 WM) reported from published studies. Value-specific references are given in parenthesis.
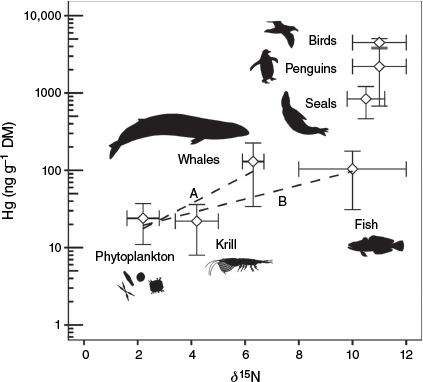
We also extracted values from published food web studies that provided carbon and nitrogen stable isotope data (13C and 15N) along with Hg concentrations in various organisms that consume krill (Fig. 8). Little increase occurs from phytoplankton (diatoms) to krill. Inorganic Hg is not efficiently assimilated (Lawson and Mason 1998) and constitutes 90% of total Hg in phytoplankton (Silva-Filho et al. 2014). The remaining organic MeHg is assimilated by zooplankton with an efficiency of 65% (Mason et al. 1995), and makes up 5–37% of the krill total Hg content (Seco et al. 2019; Sontag et al. 2019; Korejwo et al. 2023). Transfer of Hg between krill and the next trophic level can be separated into two different patterns for whales and fish, both showing a large increase in Hg concentration. The increase in 15N of whales (2–4‰) reflected the predicted values for two adjacent trophic levels (i.e. whales feeding on krill), as expected from our mass balance model calculations and also supported by 13C values (e.g. Angel Romero et al. 2017). The ~6‰ increase in 15N from krill to fish, however, suggested a missing intermediary trophic level, with 13C values indicating feeding by fish on mixed food sources (e.g. Cipro et al. 2017). Values for other vertebrate species are also plotted in Fig. 8, but have not been considered as part of the fish food chain, as the former are migratory and, based on N isotope values, consume invertebrates other than krill and may not consume fish. Concentrations of Hg are so high in penguins, seals and flying birds (Endo et al. 2002; Bengtson Nash et al. 2021) that a large percentage of Hg needs to be present as MeHg. Such biomagnification can only occur in the presence of at least four trophic levels (Bowles et al. 2001), so Hg sources other than krill must be available to these vertebrates. This interpretation is based on phytoplankton, which contain only very low Hg concentrations (mostly inorganic Hg), being the organic matter source at the base of the food web. If other MeHg-rich primary producers are present, as could be expected in systems with guano input from bird colonies (Jarzynowska et al. 2023), our model would be invalid. In such a case, another model would have to be proposed to explain the biomagnification of Hg to the levels reported in the literature for predators. We also did not take into account life span of modelled species, which could be related to their Hg concentrations.
Collation of concurrently published stable isotope and mercury (Hg) data (n = 128) on the bioaccumulation and biomagnification of Hg in krill-based Antarctic food webs. The graph presents Hg concentrations (ng g−1 dry mass, DM) and 15N values (‰) for phytoplankton as primary producers, krill as primary consumer, fish or whales as secondary consumers, and other unknown consumer levels of migratory species (seals, penguins and flying birds). Data sources: Bargagli et al. (1998), Anderson et al. (2009), Aubail et al. (2011), Brault (2012), Endo et al. (2012), Carravieri et al. (2013), Angel Romero et al. (2017), Cipro et al. (2017), Seco et al. (2021a) and Matias et al. (2022).
Our study adds a considerable wealth of information, both data and metadata, to existing baseline records of krill Hg concentrations at various locations in the Southern Ocean. This dataset will be valuable for short- and long-term monitoring of climate change and other effects in the region. Although we observed yearly cycles, with Hg concentrations peaking in early austral summer together with sea surface chlorophyll-a concentrations and bottoming out in winter, on a decadal scale, concentrations appear fairly stable, with minor location-specific variations. It would be useful if future studies could compare decadal trends in Hg concentrations in various trophic levels with information on local anthropogenic emissions over the years. We also noted that krill Hg concentrations varied (a) between locations, although the unbalanced character of our data limited any further interpretations on this effect, and (b) by individual size, although our low juvenile sample size hindered any further investigation into this. Future studies should record individual sex and stage before Hg analysis to better understand the effects of physiology and diet on ontogenetic changes in Hg concentrations. Lastly, future studies on Hg biomagnification in Antarctic megafauna should strive to present Hg data for as many producers and consumers as potentially expected, together with stable isotope data to confirm trophic levels. When available, future studies should also gather relevant data to conduct mass balance models as a way of verifying biomagnification claims for specific food chains.
Data availability
The data that support this study are available from the CSIRO Data Access Portal (DAP) (Franco-Santos et al. 2025). The R code used to analyse data for this study is publicly available from GitHub at https://github.com/sameggs/euphasia_antarctica_Hg.
Conflicts of interest
The krill used in this research were sampled from catches that are commercialised by Aker Biomarine as products for human health and nutrition. N. Hoem is the company’s chief scientist and, as such, had a professional investment in the results of our research.
Declaration of funding
This work was supported by an Antarctic Science International Bursary, awarded to RMF-S by Antarctic Science Ltd, and by project funds from the Australian National University Research School of Earth Sciences Marine Biogeochemistry Program. The main project investigating krill lipid biochemistry, from which the samples and lipid data used for this study were sourced, was funded by the Australian Research Council Linkage Project LP140100412 awarded to P. Virtue.
Acknowledgements
The authors thank the captain and crew of FV Saga Sea for their time and care in collecting, packaging and storing krill samples; Prayna Maharaj and Riteshma Devi for the assistance with sample homogenisation for mercury analysis; Mina Brock for assistance with lipid laboratory work; Dr Larissa Schneider and her student Jalene Nalbant for teaching us how to use the Direct Mercury Analyser. This project was conducted as an additional, a posteriori component to the Australian Research Council Linkage Project LP140100412 and a theme of the Australian National University Research School of Earth Sciences Marine Biogeochemistry Program.
References
Anderson ORJ, Phillips RA, McDonald RA, Shore RF, McGill RAR, Bearhop S (2009) Influence of trophic position and foraging range on mercury levels within a seabird community. Marine Ecology Progress Series 375, 277-288.
| Crossref | Google Scholar |
Angel Romero PA, Barragán-Barrera DC, Botero-Acosta N, Riet-Sapriza F, Caballero S, Luna-Acosta A (2017) Mercury concentrations in wild humpback whales (Megaptera novaeangliae) sampled in the Colombian Pacific and in Antarctic Peninsula. Undergraduate Biólogo degree project, Departamento de Ciencias Biológicas, Universidad de los Andes. Available at http://hdl.handle.net/1992/39623 [In English with abstract in English and Spanish]
Ariya PA, Khalizov A, Gidas A (2002) Reactions of gaseous mercury with atomic and molecular halogens: kinetics, product studies, and atmospheric implications. The Journal of Physical Chemistry A 106(32), 7310-7320.
| Crossref | Google Scholar |
Atkinson A, Shreeve RS, Hirst AG, Rothery P, Tarling GA, Pond DW, Korb RE, Murphy EJ, Watkins JL (2006) Natural growth rates in Antarctic krill (Euphausia superba): II. Predictive models based on food, temperature, body length, sex, and maturity stage. Limnology and Oceanography 51(2), 973-987.
| Crossref | Google Scholar |
Aubail A, Teilmann J, Dietz R, Rigét F, Harkonen T, Karlsson O, Rosing-Asvid A, Caurant F (2011) Investigation of mercury concentrations in fur of phocid seals using stable isotopes as tracers of trophic levels and geographical regions. Polar Biology 34(9), 1411-1420.
| Crossref | Google Scholar |
Bargagli R, Monaci F, Sanchez-Hernandez JC, Cateni D (1998) Biomagnification of mercury in an Antarctic marine coastal food web. Marine Ecology Progress Series 169, 65-76.
| Crossref | Google Scholar |
Bełdowska M, Saniewska D, Gębka K, Kwasigroch U, Korejwo E, Kobos J (2018) Simple screening technique for determination of adsorbed and absorbed mercury in particulate matter in atmospheric and aquatic environment. Talanta 182, 340-347.
| Crossref | Google Scholar | PubMed |
Bengtson Nash SM, Casa MV, Kawaguchi S, Staniland I, Bjerregaard P (2021) Mercury levels in humpback whales, and other Southern Ocean marine megafauna. Marine Pollution Bulletin 172, 112774.
| Crossref | Google Scholar | PubMed |
Bloom NS (1992) On the chemical form of mercury in edible fish and marine invertebrate tissue. Canadian Journal of Fisheries and Aquatic Sciences 49(5), 1010-1017.
| Crossref | Google Scholar |
Blum JD, Popp BN, Drazen JC, Anela Choy C, Johnson MW (2013) Methylmercury production below the mixed layer in the North Pacific Ocean. Nature Geoscience 6(10), 879-884.
| Crossref | Google Scholar |
Bowles KC, Apte SC, Maher WA, Kawei M, Smith R (2001) Bioaccumulation and biomagnification of mercury in Lake Murray, Papua New Guinea. Canadian Journal of Fisheries and Aquatic Sciences 58(5), 888-897.
| Crossref | Google Scholar |
Boyden CR (1977) Effect of size upon metal content of shellfish. Journal of the Marine Biological Association of the United Kingdom 57(3), 675-714.
| Crossref | Google Scholar |
Brault EK (2012) Evaluating persistent organic pollutants (POPs) and mercury in the West Antarctic Peninsula (WAP) food web, with a focus on Antarctic fur seals (Arctocephalus gazella). MSc thesis, paper 1539617927, College of William and Mary in Virginia, Faculty of the School of Marine Science, Williamsburg, VA, USA.
| Crossref | Google Scholar |
Brooks S, Lindberg S, Southworth G, Arimoto R (2008) Springtime atmospheric mercury speciation in the McMurdo, Antarctica coastal region. Atmospheric Environment 42(12), 2885-2893.
| Crossref | Google Scholar |
Bustamante P, Lahaye V, Durnez C, Churlaud C, Caurant F (2006) Total and organic Hg concentrations in cephalopods from the North Eastern Atlantic waters: influence of geographical origin and feeding ecology. Science of The Total Environment 368(2), 585-596.
| Crossref | Google Scholar | PubMed |
Canário J, Santos-Echeandia J, Padeiro A, Amaro E, Strass V, Klaas C, Hoppema M, Ossebaar S, Koch BP, Laglera LM (2017) Mercury and methylmercury in the Atlantic sector of the Southern Ocean. Deep-Sea Research – II. Topical Studies in Oceanography 138, 52-62.
| Crossref | Google Scholar |
Carravieri A, Bustamante P, Churlaud C, Cherel Y (2013) Penguins as bioindicators of mercury contamination in the Southern Ocean: birds from the Kerguelen Islands as a case study. Science of The Total Environment 454–455, 141-148.
| Crossref | Google Scholar |
Caroli S, Senofonte O, Caimi S, Pucci P, Pauwels J, Kramer GN (1998) A pilot study for the preparation of a new Reference Material based on antarctic krill. Fresenius’ Journal of Analytical Chemistry 360(3–4), 410-414.
| Crossref | Google Scholar |
Chen CY, Folt CL (2005) High plankton densities reduce mercury biomagnification. Environmental Science & Technology 39(1), 115-121.
| Crossref | Google Scholar | PubMed |
Chiang G, Kidd KA, Díaz-Jaramillo M, Espejo W, Bahamonde P, O’Driscoll NJ, Munkittrick KR (2021) Methylmercury biomagnification in coastal aquatic food webs from western Patagonia and western Antarctic Peninsula. Chemosphere 262, 128360.
| Crossref | Google Scholar | PubMed |
Cipro CVZ, Montone RC, Bustamante P (2017) Mercury in the ecosystem of Admiralty Bay, King George Island, Antarctica: occurrence and trophic distribution. Marine Pollution Bulletin 114(1), 564-570.
| Crossref | Google Scholar | PubMed |
Clarke A, Leakey RJG (1996) The seasonal cycle of phytoplankton, macronutrients, and the microbial community in a nearshore Antarctic marine ecosystem. Limnology and Oceanography 41(6), 1281-1294.
| Crossref | Google Scholar |
Corbisier TN, Petti MAV, Skowronski RSP, Brito TAS (2004) Trophic relationships in the nearshore zone of Martel Inlet (King George Island, Antarctica): δ13C stable-isotope analysis. Polar Biology 27, 75-82.
| Crossref | Google Scholar |
Cossa D, Heimbürger L-E, Lannuzel D, Rintoul SR, Butler ECV, Bowie AR, Averty B, Watson RJ, Remenyi T (2011) Mercury in the Southern Ocean. Geochimica et Cosmochimica Acta 75(14), 4037-4052.
| Crossref | Google Scholar |
Cuzin-Roudy J (2000) Seasonal reproduction, multiple spawning, and fecundity in northern krill, Meganyctiphanes norvegica, and Antarctic krill, Euphausia superba. Canadian Journal of Fisheries and Aquatic Sciences 57(S3), 6-15.
| Crossref | Google Scholar |
Dick AL (1991) Concentrations and sources of metals in the Antarctic Peninsula aerosol. Geochimica et Cosmochimica Acta 55(7), 1827-1836.
| Crossref | Google Scholar |
Dommergue A, Sprovieri F, Pirrone N, Ebinghaus R, Brooks S, Courteaud J, Ferrari CP (2010) Overview of mercury measurements in the Antarctic troposphere. Atmospheric Chemistry and Physics 10(7), 3309-3319.
| Crossref | Google Scholar |
dos Santos IR, Silva-Filho EV, Schaefer C, Maria Sella S, Silva CA, Gomes V, Passos MJDACR, Van Ngan P (2006) Baseline mercury and zinc concentrations in terrestrial and coastal organisms of Admiralty Bay, Antarctica. Environmental Pollution 140(2), 304-311.
| Crossref | Google Scholar |
Endo T, Haraguchi K, Sakata M (2002) Mercury and selenium concentrations in the internal organs of toothed whales and dolphins marketed for human consumption in Japan. Science of The Total Environment 300(1), 15-22.
| Crossref | Google Scholar | PubMed |
Endo T, Hotta Y, Hisamichi Y, Kimura O, Sato R, Haraguchi K, Funahashi N, Baker CS (2012) Stable isotope ratios and mercury levels in red meat products from baleen whales sold in Japanese markets. Ecotoxicology and Environmental Safety 79, 35-41.
| Crossref | Google Scholar |
Ericson JA, Hellessey N, Nichols PD, Kawaguchi S, Nicol S, Hoem N, Virtue P (2018) Seasonal and interannual variations in the fatty acid composition of adult Euphausia superba Dana, 1850 (Euphausiacea) samples derived from the Scotia Sea krill fishery. Journal of Crustacean Biology 38(6), 662-672.
| Crossref | Google Scholar |
Everson I (2000) Introducing krill. In ‘Krill: Biology, Ecology and Fisheries’. (Ed. I Everson) pp. 1–7. (Wiley: Hoboken, NJ, USA) doi:10.1002/9780470999493.ch1
Franco-Santos R, Eggins S, Ellwood M, Hoem N, Nichols PD, Virtue P, Maher W (2025) Mercury concentrations in Antarctic krill from South Georgia, South Orkney Islands, and West Antarctica Peninsula (2013–2019). CSIRO. [v1, Data Collection] doi:10.25919/dvmw-se97
Goutte A, Barbraud C, Meillère A, Carravieri A, Bustamante P, Labadie P, Budzinski H, Delord K, Cherel Y, Weimerskirch H, Chastel O (2014) Demographic consequences of heavy metals and persistent organic pollutants in a vulnerable long-lived bird, the wandering albatross. Proceedings of the Royal Society of London – B. Biological Sciences 281(1787), 20133313.
| Crossref | Google Scholar | PubMed |
Hagen W, Van Vleet ES, Kattner G (1996) Seasonal lipid storage as overwintering strategy of Antarctic krill. Marine Ecology Progress Series 134, 85-89.
| Crossref | Google Scholar |
Hagen W, Kattner G, Terbrüggen A, Van Vleet ES (2001) Lipid metabolism of the Antarctic krill Euphausia superba and its ecological implications. Marine Biology 139(1), 95-104.
| Crossref | Google Scholar |
Heimbürger L-E, Cossa D, Marty J-C, Migon C, Averty B, Dufour A, Ras J (2010) Methyl mercury distributions in relation to the presence of nano-and picophytoplankton in an oceanic water column (Ligurian Sea, North-western Mediterranean). Geochimica et Cosmochimica Acta 74(19), 5549-5559.
| Crossref | Google Scholar |
Hellessey N, Ericson JA, Nichols PD, Kawaguchi S, Nicol S, Hoem N, Virtue P (2018) Seasonal and interannual variation in the lipid content and composition of Euphausia superba Dana, 1850 (Euphausiacea) samples derived from the Scotia Sea fishery. Journal of Crustacean Biology 38(6), 673-681.
| Crossref | Google Scholar |
Jackson TA (1998) Mercury in aquatic ecosystems. In ‘Metal metabolism in aquatic environments’. (Eds WJ Langston, MJ Bebianno) pp. 77–158. (Springer: Boston, MA, USA) doi:10.1007/978-1-4757-2761-6_5
Jarzynowska M, Saniewska D, Fudala K, Wilman B, Balazy P, Płońska P, Saniewski M (2023) Mercury and methylmercury in birds and marine mammals inhabiting the coastal zone of the two King George Island’s bays: Admiralty and King George Bay (maritime Antarctic). Marine Pollution Bulletin 193, 115237.
| Crossref | Google Scholar | PubMed |
Kainz MJ, Fisk AT (2009) Integrating lipids and contaminants in aquatic ecology and ecotoxicology. In ‘Lipids in Aquatic Ecosystems’. (Eds M Kainz, MT Brett, MT Arts) pp. 93–114. (Springer: New York, NY, USA) dpo:10.1007/978-0-387-89366-2_5
Karimi R, Chen CY, Pickhardt PC, Fisher NS, Folt CL (2007) Stoichiometric controls of mercury dilution by growth. Proceedings of the National Academy of Sciences of the United States of America 104(18), 7477-7482.
| Crossref | Google Scholar | PubMed |
Kim M-A, Jung H-R, Lee Y-B, Chun B-S, Kim S-B (2014) Monthly variations in the nutritional composition of Antarctic krill Euphausia superba. Fisheries and Aquatic Sciences 17(4), 409-419.
| Crossref | Google Scholar |
Kirkwood JM (1982) A guide to the Euphausiacea of the Southern Ocean. ANARE Research Notes 1. (Information Services Section, Antarctic Division, Department of Science and Technology: Kingston, Tas., Australia) Available at https://www.antarctica.gov.au/site/assets/files/64914/arn_001.pdf
Korejwo E, Panasiuk A, Wawrzynek-Borejko J, Jędruch A, Bełdowski J, Paturej A, Bełdowska M (2023) Mercury concentrations in Antarctic zooplankton with a focus on the krill species, Euphausia superba. Science of The Total Environment 905, 167239.
| Crossref | Google Scholar | PubMed |
Lavoie RA, Hebert CE, Rail J-F, Braune BM, Yumvihoze E, Hill LG, Lean DR (2010) Trophic structure and mercury distribution in a Gulf of St Lawrence (Canada) food web using stable isotope analysis. Science of The Total Environment 408(22), 5529-5539.
| Crossref | Google Scholar | PubMed |
Lavoie RA, Jardine TD, Chumchal MM, Kidd KA, Campbell LM (2013) Biomagnification of mercury in aquatic food webs: a worldwide meta-analysis. Environmental Science & Technology 47(23), 13385-13394.
| Crossref | Google Scholar | PubMed |
Lawson NM, Mason RP (1998) Accumulation of mercury in estuarine food chains. Biogeochemistry 40(2), 235-247.
| Crossref | Google Scholar |
Li J, Dong X, Tang Y, Zhang C, Yang Y, Zhang W, Liu S, Yuan W, Feng X, Heimbürger-Boavida L-E, Wang F, Shang L, Peng X (2024) Deep sea cold seeps are a sink for mercury and source for methylmercury. Communications Earth & Environment 5(1), 324.
| Crossref | Google Scholar |
Lindberg SE, Brooks S, Lin C-J, Scott K, Meyers T, Chambers L, Landis M, Stevens R (2001) Formation of reactive gaseous mercury in the Arctic: evidence of oxidation of Hg to gas-phase Hg-II compounds after Arctic sunrise. Water, Air and Soil Pollution: Focus 1, 295-302.
| Crossref | Google Scholar |
Lobel PB, Wright DA (1982) Gonadal and nongonadal zinc concentrations in mussels. Marine Pollution Bulletin 13(9), 320-323.
| Crossref | Google Scholar |
Lobel PB, Mogie P, Wright DA, Wu BL (1982) Metal accumulation in four molluscs. Marine Pollution Bulletin 13(5), 170-174.
| Crossref | Google Scholar |
Locarnini SJP, Presley BJ (1995) Trace element concentrations in Antarctic krill, Euphausia superba. Polar Biology 15, 283-288.
| Crossref | Google Scholar |
Maage A, Nilsen BM, Julshamn K, Frøyland L, Valdersnes S (2017) Total mercury, methylmercury, inorganic arsenic and other elements in meat from minke whale (Balaenoptera acutorostrata) from the North East Atlantic Ocean. Bulletin of Environmental Contamination and Toxicology 99, 161-166.
| Crossref | Google Scholar | PubMed |
Maher W, Krikowa F, Ellwood M (2020) Mercury cycling in Australian estuaries and near shore coastal ecosystems: triggers for management. Elementa Science of the Anthropocene 8, 29.
| Crossref | Google Scholar |
Mason RP, Gill GA (2005) Mercury in the marine environment. In ‘Mercury: Sources, Measurements, Cycles and Effects’. (Eds MB Parsons, JB Percival) pp. 179–205. (Mineralogical Association of Canada: Ottawa, ON, Canada) doi:10.2113/gsecongeo.101.1.250
Mason RP, Reinfelder JR, Morel FMM (1995) Bioaccumulation of mercury and methylmercury. Water, Air, and Soil Pollution 80(1), 915-921.
| Crossref | Google Scholar |
Mason RP, Reinfelder JR, Morel FMM (1996) Uptake, toxicity, and trophic transfer of mercury in a coastal diatom. Environmental Science & Technology 30(6), 1835-1845.
| Crossref | Google Scholar |
Matias RS, Guímaro HR, Bustamante P, Seco J, Chipev N, Fragão J, Tavares S, Ceia FR, Pereira ME, Barbosa A, Xavier JC (2022) Mercury biomagnification in an Antarctic food web of the Antarctic Peninsula. Environmental Pollution 304, 119199.
| Crossref | Google Scholar | PubMed |
Meyer B (2012) The overwintering of Antarctic krill, Euphausia superba, from an ecophysiological perspective. Polar Biology 35(1), 15-37.
| Crossref | Google Scholar |
Meyer B, Fuentes V, Guerra C, Schmidt K, Atkinson A, Spahic S, Cisewski B, Freier U, Olariaga A, Bathmanna U (2009) Physiology, growth, and development of larval krill Euphausia superba in autumn and winter in the Lazarev Sea, Antarctica. Limnology and Oceanography 54(5), 1595-1614.
| Crossref | Google Scholar |
Meyer B, Auerswald L, Siegel V, Spahić S, Pape C, Fach BA, Teschke M, Lopata AL, Fuentes V (2010) Seasonal variation in body composition, metabolic activity, feeding, and growth of adult krill Euphausia superba in the Lazarev Sea. Marine Ecology Progress Series 398, 1-18.
| Crossref | Google Scholar |
Mills WF, Bustamante P, McGill RAR, Anderson ORJ, Bearhop S, Cherel Y, Votier SC, Phillips RA (2020) Mercury exposure in an endangered seabird: long-term changes and relationships with trophic ecology and breeding success. Proceedings of the Royal Society of London – B. Biological Sciences 287, 20202683.
| Crossref | Google Scholar | PubMed |
Mirzoeva N, Tereshchenko N, Paraskiv A, Proskurnin V, Stetsiuk A, Korotkov A (2022) Metals and metalloids in Antarctic krill and water in deep Weddell Sea areas. Marine Pollution Bulletin 178, 113624.
| Crossref | Google Scholar |
NOAA Fisheries (2023a) Blue whale Balaenoptera musculus. In ‘Species Directory’. (US Department of Commerce, National Oceanic and Atmospheric Administration) Available at https://www.fisheries.noaa.gov/species/blue-whale [Verified 18 May 2025]
NOAA Fisheries (2023b) Fin whale Balaenoptera physalus. In ‘Species Directory’. (US Department of Commerce, National Oceanic and Atmospheric Administration) Available at https://www.fisheries.noaa.gov/species/fin-whale [Verified 18 May 2025]
NOAA Fisheries (2024) Humpback whale Megaptera novaeangliae. In ‘Species Directory’. (US Department of Commerce, National Oceanic and Atmospheric Administration) Available at https://www.fisheries.noaa.gov/species/humpback-whale [Verified 18 May 2025]
O’Brien C, Virtue P, Kawaguchi S, Nichols PD (2011) Aspects of krill growth and condition during late winter-early spring off East Antarctica (110–130°E). Deep-Sea Research – II. Topical Studies in Oceanography 58(9–10), 1211-1221.
| Crossref | Google Scholar |
Oceanwide Expeditions (2024) Fin whale. (Oceanwide Expeditions) Available at https://oceanwide-expeditions.com/to-do/wildlife/fin-whale [Verified 18 May 2025]
Olsvik PA, Amlund H, Torstensen BE (2011) Dietary lipids modulate methylmercury toxicity in Atlantic salmon. Food and Chemical Toxicology 49(12), 3258-3271.
| Crossref | Google Scholar | PubMed |
Owen K, Kavanagh AS, Warren JD, Noad MJ, Donnelly D, Goldizen AW, Dunlop RA (2017) Potential energy gain by whales outside of the Antarctic: prey preferences and consumption rates of migrating humpback whales (Megaptera novaeangliae). Polar Biology 40(2), 277-289.
| Crossref | Google Scholar |
Perissinotto R, Gurney L, Pakhomov EA (2000) Contribution of heterotrophic material to diet and energy budget of Antarctic krill, Euphausia superba. Marine Biology 136(1), 129-135.
| Crossref | Google Scholar |
Pfaff B (2008) VAR, SVAR and SVEC models: Implementation within R package vars. Journal of Statistical Software 27, 1-32.
| Crossref | Google Scholar |
Polito MJ, Reiss CS, Trivelpiece WZ, Patterson WP, Emslie SD (2013) Stable isotopes identify an ontogenetic niche expansion in Antarctic krill (Euphausia superba) from the South Shetland Islands, Antarctica. Marine Biology 160, 1311-1323.
| Crossref | Google Scholar |
Polito MJ, Brasso RL, Trivelpiece WZ, Karnovsky N, Patterson WP, Emslie SD (2016) Differing foraging strategies influence mercury (Hg) exposure in an Antarctic penguin community. Environmental Pollution 218, 196-206.
| Crossref | Google Scholar |
Sanpera C, Capelli R, Minganti V, Jover L (1993) Total and organic mercury in North Atlantic fin whales: distribution pattern and biological related changes. Marine Pollution Bulletin 26(3), 135-139.
| Crossref | Google Scholar |
Sathyendranath S, Brewin RJW, Brockmann C, Brotas V, Calton B, Chuprin A, Cipollini P, Couto AB, Dingle J, Doerffer R, Donlon C, Dowell M, Farman A, Grant M, Groom S, Horseman A, Jackson T, Krasemann H, Lavender S, Martinez-Vicente V, Mazeran C, Mélin F, Moore TS, Müller D, Regner P, Roy S, Steele CJ, Steinmetz F, Swinton J, Taberner M, Thompson A, Valente A, Zühlke M, Brando VE, Feng H, Feldman G, Franz BA, Frouin R, Gould RW, Hooker SB, Kahru M, Kratzer S, Mitchell BG, Muller-Karger FE, Sosik HM, Voss KJ, Werdell J, Platt T (2019) An ocean-colour time series for use in climate studies: the experience of the ocean-colour climate change initiative (OC-CCI). Sensors 19(19), 4285.
| Crossref | Google Scholar | PubMed |
Savoca MS, Czapanskiy MF, Kahane-Rapport SR, Gough WT, Fahlbusch JA, Bierlich KC, Segre PS, Di Clemente J, Penry GS, Wiley DN, Calambokidis J, Nowacek DP, Johnston DW, Pyenson ND, Friedlaender AS, Hazen EL, Goldbogen JA (2021) Baleen whale prey consumption based on high-resolution foraging measurements. Nature 599(7883), 85-90.
| Crossref | Google Scholar |
Schaafsma FL, Kohlbach D, David C, Lange BA, Graeve M, Flores H, van Franeker JA (2017) Spatio-temporal variability in the winter diet of larval and juvenile Antarctic krill, Euphausia superba, in ice-covered waters. Marine Ecology Progress Series 580, 101-115.
| Crossref | Google Scholar |
Schroeder WH, Anlauf KG, Barrie LA, Lu JY, Steffen A, Schneeberger DR, Berg T (1998) Arctic springtime depletion of mercury. Nature 394(6691), 331-332.
| Crossref | Google Scholar |
SeaWorld (2024) Diet & eating habits. In ‘Baleen Whales’. (SeaWorld Parks & Entertainment, Inc.) Available at https://seaworld.org/animals/all-about/baleen-whales/diet/ [Verified 18 May 2025]
Seco J, Xavier JC, Coelho JP, Pereira B, Tarling G, Pardal MA, Bustamante P, Stowasser G, Brierley AS, Pereira ME (2019) Spatial variability in total and organic mercury levels in Antarctic krill Euphausia superba across the Scotia Sea. Environmental Pollution 247, 332-339.
| Crossref | Google Scholar | PubMed |
Seco J, Aparício S, Brierley AS, Bustamante P, Ceia FR, Coelho JP, Philips RA, Saunders RA, Fielding S, Gregory S, Matias R, Pardal MA, Pereira E, Stowasser G, Tarling GA, Xavier JC (2021a) Mercury biomagnification in a Southern Ocean food web. Environmental Pollution 275, 116620.
| Crossref | Google Scholar | PubMed |
Seco J, Freitas R, Xavier JC, Bustamante P, Coelho JP, Coppola F, Saunders RA, Almeida A, Fielding S, Pardal MA, Stowasser G, Pompeo G, Tarling GA, Brierley AS, Pereira E (2021b) Oxidative stress, metabolic activity and mercury concentrations in Antarctic krill Euphausia superba and myctophid fish of the Southern Ocean. Marine Pollution Bulletin 166, 112178.
| Crossref | Google Scholar |
Siegel V, Loeb V (1994) Length and age at maturity of Antarctic krill. Antarctic Science 6(4), 479-482.
| Crossref | Google Scholar |
Silva-Filho EV, Kütter VT, Figueiredo TS, Tessier E, Rezende CE, Teixeira DC, Silva CA, Donard OFX (2014) Mercury speciation in plankton from the Cabo Frio Bay, SE Brazil. Environmental Monitoring and Assessment 186(12), 8141-8150.
| Crossref | Google Scholar | PubMed |
Sontag PT, Steinberg DK, Reinfelder JR (2019) Patterns of total mercury and methylmercury bioaccumulation in Antarctic krill (Euphausia superba) along the West Antarctic Peninsula. Science of The Total Environment 688, 174-183.
| Crossref | Google Scholar | PubMed |
Stoeppler M, Brandt K (1979) Comparative studies on trace metal levels in marine biota. Zeitschrift für Lebensmittel-Untersuchung und Forschung 169(2), 95-98.
| Crossref | Google Scholar | PubMed |
Stowasser G, Atkinson A, McGill RAR, Phillips RA, Collins MA, Pond DW (2012) Food web dynamics in the Scotia Sea in summer: a stable isotope study. Deep-Sea Research – II. Topical Studies in Oceanography 59, 208-221.
| Crossref | Google Scholar |
Tan SW, Meiller JC, Mahaffey KR (2009) The endocrine effects of mercury in humans and wildlife. Critical Reviews in Toxicology 39(3), 228-269.
| Crossref | Google Scholar | PubMed |
Tarling GA, Hill S, Peat H, Fielding S, Reiss C, Atkinson A (2016) Growth and shrinkage in Antarctic krill Euphausia superba is sex dependent. Marine Ecology Progress Series 547, 61-78.
| Crossref | Google Scholar |
Tomiyasu T, Matsuki H, Oda M, Kodamatani H, Kanzaki R, Kobari T (2023) Impact of mercury discharged from submarine volcano on inner bay ecosystems. Chemosphere 339, 139748.
| Crossref | Google Scholar | PubMed |
Torres JJ, Donnelly J, Hopkins TL, Lancraft TM, Aarset AV, Ainley DG (1994) Proximate composition and overwintering strategies of Antarctic micronektonic Crustacea. Marine Ecology Progress Series 113, 221-232.
| Crossref | Google Scholar |
Tovar-Sanchez A, Duarte CM, Hernández-León S, Sañudo-Wilhelmy SA (2009) Impact of submarine hydrothermal vents on the metal composition of krill and its excretion products. Marine Chemistry 113(1), 129-136.
| Crossref | Google Scholar |
Trumble SJ, Robinson EM, Berman-Kowalewski M, Potter CW, Usenko S (2013) Blue whale earplug reveals lifetime contaminant exposure and hormone profiles. Proceedings of the National Academy of Sciences 110(42), 16922-16926.
| Crossref | Google Scholar |
United States Environmental Protection Agency (1998) Method 7473 (SW-846): mercury in solids and solutions by thermal decomposition, amalgamation, and atomic absorption spectrophotometry. (US EPA: Washington, DC, USA) Available at https://www.epa.gov/sites/default/files/2015-07/documents/epa-7473.pdf
Wickham H, Averick M, Bryan J, Chang W, McGowan LDA, François R, Grolemund G, Hayes A, Henry L, Hester J, Kuhn M, Pedersen TL, Miller E, Bache SM, Müller K, Ooms J, Robinson D, Seidel DP, Spinu V, Takahashi K, Vaughan D, Wilke C, Woo K, Yutani H (2019) Welcome to the Tidyverse. Journal of Open Source Software 4(43), 1686.
| Crossref | Google Scholar |
Witek Z, Koronkiewicz A, Soszka GJ (1980) Certain aspects of the early life history of krill Euphausia superba Dana (Crustacea). Polish Polar Research 1(4), 97-115.
| Google Scholar |
Wolfe MF, Schwarzbach S, Sulaiman RA (1998) Effects of mercury on wildlife: a comprehensive review. Environmental Toxicology and Chemistry 17(2), 146-160.
| Crossref | Google Scholar |
Yue F, Xie Z, Yan J, Zhang Y, Jiang B (2021) Spatial distribution of atmospheric mercury species in the Southern Ocean. Journal of Geophysical Research: Atmospheres 126(17), e2021JD034651.
| Crossref | Google Scholar |