

Genetic differentiation and population connectivity of humpback whales migrating through Aotearoa New Zealand waters
Debbie J. Steel A B , Emma L. Carroll B C , C. Scott Baker A B , Susana Caballero B D , Simon Childerhouse B E , Chloe Corne F , Claire Garrigue B G , Nadine Gibbs B H , Richard Kinsey F , Ngāti Kuri I , Mike Ogle J , Carlos Olavarría B K , Daniel Palacios A L , M. Michael Poole B M , Kristin Rasmussen N , Leena Riekkola B C , Jooke Robbins B L and Rochelle Constantine B C *
A
B
C
D
E
F
G
H
I
J
K
L
M
N
Abstract
Historically, humpback whales migrating past Aotearoa New Zealand (NZ) were linked to western South Pacific wintering grounds and Antarctic feeding grounds. As populations have recovered, research has focused on contemporary connectivity patterns throughout the South Pacific.
To determine the contemporary connectivity of winter breeding grounds for humpback whales on their northern and southern migrations past NZ, and those at the Kermadec Islands (Rangitāhua) migratory stopover.
We generated DNA profiles (mitochondrial DNA (mtDNA) haplotypes, genetic sex and microsatellite genotypes) using skin samples collected from whales between 1998 and 2021. We used comparisons of DNA profiles and a mixed-stock analysis of mtDNA haplotypes to determine the most likely wintering grounds of genetically identified individuals.
DNA profiles of 350 individual whales from NZ were compared to profiles from Oceania (n > 2000), Central and South America (n = 452) and East Australia (n = 809). This comparison revealed 35 genotype matches, mainly to New Caledonia and East Australia. The mixed-stock analysis showed that northbound whales (n = 145) had approximately equal assignment proportions to East Australia and New Caledonia whereas southbound whales (n = 74) showed a two-fold higher assignment to East Australia. In contrast, whales passing Rangitāhua (n = 112) assigned to New Caledonia and other Pacific wintering grounds but not to East Australia.
Humpback whales passing mainland NZ on their north and southbound migrations are strongly associated with East Australia and New Caledonia wintering grounds. Those migrating south past Rangitāhua have a broader range of wintering ground destinations, including a connection to Central America.
Keywords: connectivity, genetics, humpback whale, migration, mixed stock assignment, mtDNA, New Zealand, Pacific Ocean.
Introduction
Commercial whaling throughout the 20th century caused the near total collapse of large whale populations in the Southern Hemisphere (Clapham and Baker 2018). Despite protection since the 1960s, there have been variable rates of recovery from very slow e.g. Antarctic blue whales (Balaenoptera musculus musculus) (Branch 2007) and southern right whales (Eubalaena australis) (e.g. Jackson et al. 2016) to rapid and fully recovered e.g. humpback whales (Megaptera novaeangliae) in the south-west Atlantic (Bortolotto et al. 2021). However, even among humpback whales that are capable of rapid rates of increase (Bejder et al. 2016; Pallin et al. 2018; Noad et al. 2019) there is variation in recovery rates. For example, the Oceania region has several populations using wintering grounds between New Caledonia and French Polynesia (Fig. 1) that show considerably slower rates of recovery (Constantine et al. 2012; Jackson et al. 2015) than the neighbouring East Australia population (Noad et al. 2019). Although the causes of the historically slow recovery of Oceania’s whales are not fully understood, the huge illegal catches by the USSR south of Aotearoa New Zealand (NZ) in the late 1950s and early 1960s are likely a critical contributing factor (Clapham et al. 2009).
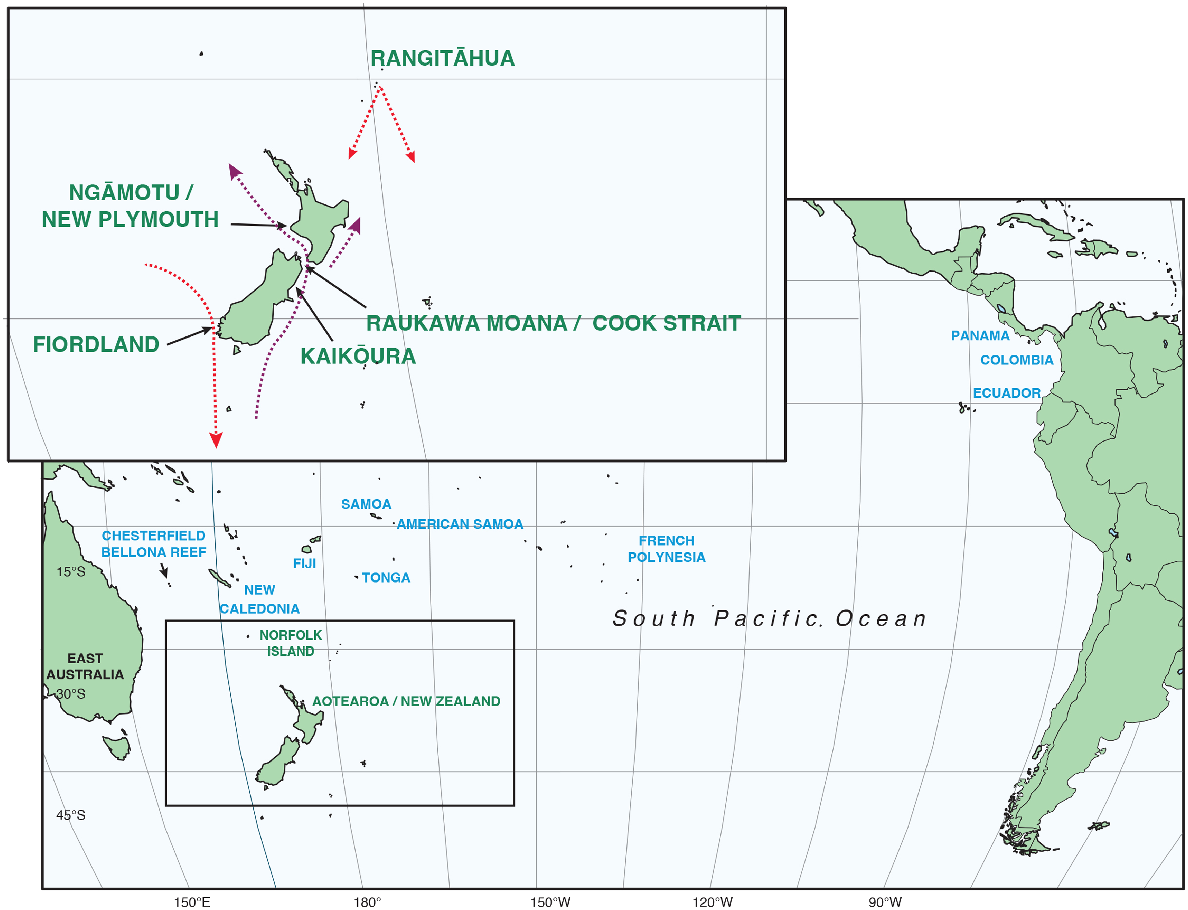
Oceania humpback whale wintering ground connections (in blue) and migratory corridors (in green). The top left insert shows the locations of genetic sampling for the northbound (indicated by the purple dotted lines) and southbound (red dotted lines) migratory streams of humpback whales passing Aotearoa New Zealand.
The endangered population of humpback whales in Oceania (Childerhouse et al. 2008) has a range of migratory destinations that span wintering grounds from New Caledonia (~160°E) to the French Polynesian archipelagos (~120°W). These are linked to a broad expanse of summer foraging grounds in the Southern Ocean from ~150°E to ~70°W (Constantine et al. 2014; Riekkola et al. 2018; Steel et al. 2018; Reisinger et al. 2021). There are also connections between East Australia, the western Oceania breeding grounds and NZ (e.g. Garrigue et al. 2011; Franklin et al. 2014; Andrews-Goff et al. 2018). Most of Oceania’s humpback whales do not migrate past East Australia (Constantine et al. 2014), therefore NZ is the only large landmass on their migratory corridor in the western South Pacific Ocean. Indigenous knowledge of humpback whale use of Oceania and NZ waters pre-dates commercial whaling, as large numbers of whales frequented nearshore waters during winter, and/or were encountered by voyagers navigating among the Pacific Islands and further south to NZ. This includes the remote Rangitāhua/Kermadec Island archipelago. In NZ, there are strong connections between Indigenous people – Māori – and whales, with well-established knowledge about whale song and their migration patterns reflecting the pre-whaling seasonal movements, historical abundance and eventual decline of whales (e.g. Grose et al. 2020).
The Discovery marking program conducted during the commercial whaling era linked southbound mainland NZ humpback whales to the migratory corridor of East Australia and northbound mainland NZ humpback whales to the migratory corridors of Norfolk Island and East Australia, and wintering grounds in Fiji (Dawbin 1959, 1964). These connections were largely lost with the decline in abundance and near collapse of East Australia and Oceania humpback whale populations resulting in an end to coastal commercial whaling in this area in the 1960s (Goodhand 1963; Chittleborough 1965; Clapham and Baker 2018). Today, humpback whales are slowly returning to Fijian waters but the historical population was possibly extirpated and the habitat is currently being colonised by whales from other breeding grounds (Gibbs et al. 2006; Miller et al. 2015).
Historically, Raukawa Moana/Cook Strait was a well-documented migration path for humpbacks on their northbound migration and the location for a land-based whaling station was active until the 1960s (Dawbin 1966). The south-west region of Te Waipounamu/the South Island (from Ōkahu/Jackson Bay, Te Rua-o-Te-Moko/northern Fiordland to Raratoka/Centre Island, Te Ara a Kiwa/Foveaux Strait) was identified as a migration path for southbound whales, with large aggregations of whales reported by sighting surveys during the whaling era (Dawbin 1956). Foraging behaviour and residency times of several days were also documented in this region, suggesting that this was a provisioning area for whales before they continued to their primary summer foraging areas in the Antarctic (Dawbin 1956).
Post-whaling knowledge of humpback whale movements around mainland NZ has largely relied on opportunistic sighting records collected since 1970, with most of the 157 sightings of the whales’ northbound migration primarily reported from Kaikōura and Cook Strait (Gibbs and Childerhouse 2000) between 1970 and 1999. Until 2004, most of the data enabling the genetic or photographic identification of individual whales were collected opportunistically, with small sample sizes. This made the comprehensive assessment of the winter breeding and summer feeding ground connectivity of whales migrating past mainland NZ difficult (Constantine et al. 2007, 2012; Garrigue et al. 2011; Franklin et al. 2014). In 2004, systematic annual surveys were undertaken at an old whaling lookout site at the Kura Te Au/Tory Channel entrance to Cook Strait for 12 years. Here, photo-identification and small tissue biopsy samples were collected in the main ‘hotspot’ for humpback whale sightings during their northbound migration from May to August (Dawbin 1956; Gibbs et al. 2018) (Fig. 1). A preliminary study using only 30 genetic samples from NZ suggested that whales migrating northward through Cook Strait were most closely affiliated with humpbacks from the New Caledonia breeding grounds (Olavarría et al. 2006). Opportunistic sightings during the southbound migration from September to November, and recent satellite telemetry results show that some southbound East Australia whales migrate towards south-western NZ (Andrews-Goff et al. 2018). As a result, dedicated boat-based surveys for humpbacks in the Fiordland region started in 2017, with a focus on collecting genetic samples and individual fluke identification photographs.
In addition to the mainland sightings, in the mid-2000s Te Papa Atawhai/Department of Conservation (DOC) rangers based at Rangitāhua (part of the Kermadec archipelago) reported an increasing number of southbound humpback whales from September to mid-November but only occasional sightings of whales on their northbound migration from April to June. Rangitāhua is remote, ~1100 km north-east of mainland NZ (Fig. 1) and an area of well-documented historical whale presence (Grose et al. 2020). Land-based, single-day surveys between 2008 and 2014 revealed an increase in whale numbers with one 4-h survey period in 2010 estimating up to 153 whales (see Brown 2010 and Gibson 2014). Research voyages to Rangitāhua revealed that whales stopped for ~5 days on their southbound migration from a 3600 km expanse of Oceania wintering grounds; in particular from New Caledonia (Garrigue et al. 2016; Clark et al. 2017; Riekkola et al. 2018; Owen et al. 2019). Whales subsequently continued their migration south-eastward to Antarctic feeding grounds, with very few whales passing close to mainland NZ (Riekkola et al. 2018).
Since the initial description of mitochondrial DNA (mtDNA) haplotypes from mainland NZ humpback whales (Olavarría et al. 2006), the continued collection of tissue samples from living and occasionally beachcast whales (Thompson et al. 2013) from their north and southbound migrations has greatly increased the number of genetic samples available. There has also been a concerted effort to standardise genetic markers for a ‘DNA profile’ to provide mtDNA haplotypes, and sex and microsatellite genotype (Constantine et al. 2012; Steel et al. 2018). This has enabled a comprehensive investigation using genetically identified individuals to investigate the whales’ likely wintering ground connections. Previous research suggests that the population affiliation of humpback whales passing NZ on their southern migration may differ from that of northern migrating whales (Valsecchi et al. 2010; Riekkola et al. 2018). As recovering whale populations can also change habitat use and migration patterns (e.g. Clapham and Zerbini 2015; Weir and Stanworth 2020), we consider three separate migration streams; northbound mainland NZ, southbound mainland NZ and southbound Rangitāhua. We use DNA profile data to investigate individual-based connectivity across the Pacific and mtDNA data to assess migratory habitat level connectivity. The latter is due to the highly informative nature of this marker for population structure in species such as humpback whales that show maternally directed fidelity to migratory habitats (e.g. Kershaw et al. 2017). In so doing, we also re-examine genetic differentiation across East Australia, Oceania, and the South and Central America wintering grounds with a larger dataset, to further investigate population structure and connectivity in this slowly recovering population of humpback whales.
Methods
Sample collection
In all research locations, when a pod of humpback whales was sighted, attempts were made to collect skin biopsy samples using a modified veterinary capture rifle (Krützen et al. 2002) or crossbow (e.g. Lambertsen 1987; Palsbøll et al. 1991) and collect photo-identification images of the underside of the whales’ flukes (Katona et al. 1979). Skin samples used for genetic analysis were stored in 70–90% ethanol and any blubber present was sub-sectioned from the epidermis and frozen at −20°C. Where possible, a biopsy sample and photo-identification image were collected from the same individual, providing two sources of individual identification. Samples from beachcast whales were collected by hand and stored as described above.
Data collection particular to the different locations is briefly outlined as follows.
Dedicated surveys for humpback whales were conducted at Tory Channel, Cook Strait (Fig. 1) during the austral winters (i.e. July–August) of 2004–2012 (see Gibbs et al. 2018 for details). Land-based surveys were conducted by four or more dedicated observers from a site (41°12.45′S, 174°19.43′E) 127 m above sea level. Surveys were conducted in favourable weather conditions, typically up to Beaufort 5. When possible, a boat-based research team collected samples and photo-identification, as guided by the land-based researchers.
Dedicated non-systematic boat-based surveys were conducted in 2017, 2018, 2020 and 2021 on the 22 m DOC liveaboard vessel Southern Winds from Taitetimu/Caswell Sound (40°00′S, 167°08′E) in the north to Rakituma/Preservation Inlet (46°05′S, 166°37′E) in the south including the coastal and inner fiord regions (see Corne 2023). Two to four observers conducted 90° scans along the transect line in weather conditions up to Beaufort 5 and up to 12 km offshore.
Dedicated non-systematic boat-based surveys were conducted in the austral spring 2015, 2016 and 2017 from different live-aboard vessels or, more frequently, from ~4 to 6 m small-boats deployed from the main vessel (see Clark et al. 2017 and Riekkola et al. 2018 for details). Data were collected throughout the archipelago with a focus on Rangitāhua (29°16′S, 177°56′W), an area with the highest number of whales. Surveys were conducted in Beaufort 3 or less and typically within 2 km of land.
In addition to biopsy samples of living whales, tissue collected from beachcast whales by DOC rangers from 1998 to 2012 were included (Thompson et al. 2013). Samples were preserved in 70% ethanol on location and sent to the University of Auckland/Waipapa Taumata Rau for curation in the NZ Cetacean Tissue Archive (NZCeTA) where they are stored at −20°C. Samples in this collection were split into northbound or southbound based on sampling date; samples collected between 1 September and 30 November over the 14 year time period were assigned to southbound, samples collected between 1 April and 31 July were assigned to northbound, and samples outside these date ranges were considered unknown and were not used in further analysis.
Hereafter, we refer to three migratory streams: (1) NZ-northbound (NZnth) comprises whales primarily sampled in Cook Strait and the beachcast samples collected during the northward migration period; (2) NZ-southbound (NZsth) comprises whales primarily sampled in Fiordland and the beachcast samples collected during the southward migration period; and (3) Rangitāhua comprises only samples from southbound whales, as there were no beachcast specimens from this area.
To enable comparison of the NZ migratory streams with wintering grounds, we compiled previously published datasets (see later section) and generated new reference data. Specifically, to increase the sample size of available DNA profiles, members of the South Pacific Whale Research Consortium (SPWRC) collected further biopsy or sloughed skin samples from the wintering grounds of American Samoa (2010–2019) and French Polynesia (2008–2012). Biopsy or sloughed skin samples were also collected off the Pacific coast of Colombia (2015–2018 by Fundación Macuáticos and Universidad de los Andes), the coast of Ecuador (2006–2010 by Fernando Felix, Pontificia Universidad Católica del Ecuador) and the Pacific coast of Panama (2016–2019 by Panacetacea Organization).
Total genomic DNA was extracted from skin biopsy samples either using standard proteinase K digestion and phenol/chloroform methods (Sambrook et al. 1989), as modified for small samples by Baker et al. (1994), or the Puregene DNA isolation kit (Gentra).
DNA profiles for each sampled whale included mtDNA control region haplotypes (470 bp), sex markers, and up to 15 microsatellite loci. Molecular identification of sex and sequencing of the mtDNA control region (470 bp) followed methods previously described by Olavarría et al. (2007). Microsatellite genotyping at up to 15 microsatellite loci (EV1, EV14, EV21, EV37, EV94, EV96 and EV104 (Valsecchi and Amos 1996); GATA28 and GATA417 (Palsbøll et al. 1997); RW31, RW410 and RW48 (Waldick et al. 1999); GT23, GT211 and GT575 (Bérubé et al. 2000)) followed methods previously described by Constantine et al. (2012). Amplicons from 4 to 5 loci were co-loaded for capillary electrophoresis with an ABI 3730 or an ABI 3130. Alleles were sized with Genemapper v4.0 (Applied Biosystems) and all automated calling was confirmed by visual inspection (Bonin et al. 2004). To ensure that alleles were binned consistently between runs, replicate samples (3–10) from individuals of known genotypes were included in each run to act as ‘allelic ladders’, following best practice (e.g. Bonin et al. 2004). As a precaution against poor DNA quality, only samples that amplified at a minimum of 11 microsatellite loci were retained for further analyses (QC11 dataset).
Data management, analyses of microsatellite allele frequency and analysis of probability of identity for each microsatellite locus and mtDNA were conducted using the program GenAlEx (Peakall and Smouse 2006). A binomial exact test was used to test sex bias within each of the NZ migratory streams.
Existing DNA profiles were available for individuals from the wintering grounds associated with International Whaling Commission breeding stocks spanning from West Australia to the Pacific Coast of South America (IWC 2016). Most of these profiles consist of the same loci and were generated by the methods described in the previous section as part of a long-term collaboration by members of the SPWRC and will be referred to here as the ‘SPWRC dataset’. These wintering ground individual profiles are as follows: n = 78 from the Great Barrier Reef, Queensland, Australia and n = 1402 from New Caledonia (see Garrigue et al. 2020); n = 346 from Tonga, n = 88 from Samoa and American Samoa, n = 207 from French Polynesia and n = 111 from the Pacific Coast of Colombia (Steel et al. 2018).
Previously published DNA profiles were also available for the West and East Australia wintering grounds (Anderson et al. 2003; Schmitt et al. 2014a). These were both generated by different research groups but had previously been standardised with the SPWRC dataset through an exchange of calibrated samples (Anderson et al. 2003; Morin et al. 2010; Schmitt et al. 2014a, 2014b). The 204 individual DNA profiles available for West Australian whales were generated from samples collected off Exmouth and consisted of up to 10 microsatellite loci, all of which overlapped with the SPWRC dataset (Schmitt et al. 2014a). The 734 DNA profiles available for East Australia were generated from samples collected off the northern coast of New South Wales and the southern coast of Queensland, and consisted of up to 13 microsatellite loci, 12 of which overlapped with the SPWRC dataset but only 8 overlapped with the West Australian dataset (Anderson et al. 2010).
The program CERVUS v3.0 was used to compare QC11 DNA profiles between- and within-years (Kalinowski et al. 2007). Within-year matches provide an indication of residency times between sampling events and locations, and between-year matches give an indication of migratory fidelity to NZ. For the final DNA register, only one copy of the DNA profile per region for each individual whale was retained and assigned a unique genetic-identification.
Confidence in matches was given by the average probability of identity (PID: Paetkau and Strobeck 1994), calculated in GenAlEx (Peakall and Smouse 2006). As a precaution against false exclusion due to allelic dropout and other genotyping errors (Waits and Leberg 2000; Waits et al. 2001), the initial comparison allowed for mismatches at up to three loci. The electropherograms of the mismatching loci were subsequently reviewed and either corrected based on this visual inspection or the loci were repeated. A minimum overlap of eight loci was required to identify duplicate samples of an individual due to some incomplete genotypes. Where a pair-wise comparison did not meet this minimum overlap, the missing loci for the limiting genotype were repeated or the sample was removed from the dataset. Arlequin v3.5.2.2 (Excoffier and Lischer 2010) was used to estimate haplotype and nucleotide diversity of the mtDNA haplotypes and estimate diversity of microsatellite loci.
Both individual-based and population-level approaches were used to investigate connectivity of NZ with wintering grounds in Australia, Oceania and the east Pacific Ocean (Panama, Colombia and Ecuador). At an individual level, the DNA register (i.e. the collection of DNA profiles of unique individual humpback whales sampled on NZ migratory streams), was compared with the DNA registers of humpback whales sampled in the wintering grounds of East Australia, Oceania and the east Pacific to assess the movement of individuals between these regions.
For comparison with this individual-based approach, population level tests of genetic differentiation were conducted. Specifically, Arlequin v3.5.2.2 was used to estimate differentiation in mtDNA haplotypes (FST and ΦST: Wright 1949; Weir and Cockerham 1984) between the NZ migratory streams and the wintering grounds. First the level of differentiation between wintering grounds was assessed and non-significant wintering grounds collapsed to regions. The NZ migratory streams were compared to these wintering regions. The significance of these differences was tested with a permutation procedure in Arlequin using 10,000 random permutations. To allow comparison to previously published analyses, ΦST was calculated by the same method as Olavarría et al. (2007), using unadjusted pair-wise differences. ΦST was also calculated after conducting model tests in MEGA v11.0.13 (Tamura et al. 2021) to determine the optimal substitution model. Genepop v4.7.5 (Rousset 2008) was used to estimate differentiation of the eight shared microsatellite loci between the three NZ migratory streams and the wintering regions.
To assess the proportion of whales from different wintering grounds migrating past NZ, a mixed-stock analysis was conducted using mtDNA and the Rannala and Mountain model as implemented in SPAM v3.7 (Debevec et al. 2000). For this analysis, each of our three NZ migratory streams – NZnth, NZsth and Rangitāhua – were considered ‘mixed stocks’ and the wintering grounds were considered the ‘source stocks’. The standard error of the apportionment was derived in SPAM v3.7 using 10,000 bootstrap re-samplings. Simulations conducted by Schmitt et al. (2014a) on a very similar dataset showed mtDNA data alone were slightly more accurate at reapportioning a ‘pure stock’ than when combined with microsatellite data, although the combined data showed slightly more precise estimates. Given the reduced number of microsatellite loci available for this analysis (eight overlapping loci among datasets compared to 10 loci used in Schmitt et al. (2014a)) and likely improved results from mtDNA-based analyses, we chose to use the latter.
Results
Sample collection, quality control and individual identification
Between 1998 and 2021, 306 skin samples were collected from humpback whales along mainland NZ: 190 from Cook Strait (northbound, NZnth), 94 from Fiordland (southbound, NZsth) and 22 from beachcast samples or opportunistic biopsy samples held in the NZCeTA. The number of samples per year ranged between 1 (1998 and 2003) and 47 (2012; Table 1). Eighteen of the NZCeTA samples were allocated to either northbound (n = 12) or southbound (n = 6) migration based on the date of sampling and added to the NZnth and NZsth datasets respectively. The four remaining samples were removed from further analyses.
| Year | NZnth | NZsth | Unknown | Rangitāhua | |||
|---|---|---|---|---|---|---|---|
| Survey | NZCeTA | Survey | NZCeTA | ||||
| 1998 | 0 | 0 | 0 | 0 | 1 | 0 | |
| 2003 | 0 | 0 | 0 | 1 | 0 | 0 | |
| 2004 | 12 | 1 | 0 | 1 | 1 | 0 | |
| 2005 | 11 | 1 | 0 | 0 | 0 | 0 | |
| 2006 | 10 | 1 | 0 | 0 | 0 | 0 | |
| 2007 | 10 | 1 | 0 | 0 | 0 | 0 | |
| 2008 | 16 | 0 | 0 | 0 | 0 | 0 | |
| 2009 | 20 | 1 | 0 | 2 | 1 | 0 | |
| 2010 | 24 | 0 | 0 | 0 | 0 | 0 | |
| 2011 | 40 | 2 | 0 | 1 | 0 | 0 | |
| 2012 | 47 | 5 | 0 | 1 | 1 | 0 | |
| 2015A | 0 | 0 | 0 | 0 | 0 | 84 | |
| 2016 | 0 | 0 | 0 | 0 | 0 | 34 | |
| 2017 | 0 | 0 | 6 | 0 | 0 | 21 | |
| 2018 | 0 | 0 | 32 | 0 | 0 | 0 | |
| 2020 | 0 | 0 | 22 | 0 | 0 | 0 | |
| 2021 | 0 | 0 | 34 | 0 | 0 | 0 | |
| Total | 190 | 12 | 94 | 6 | 4 | 136 | |
NZnth comprises dedicated surveys in Cook Strait (Survey), NZsth dedicated surveys in Fiordland (Survey) and in Rangitāhua, and from beachcast whales or opportunistic biopsies that have been placed in a migratory stream or unknown based on available sampling date information (NZCeTA).
In addition to the 84 samples from 72 individuals collected from Rangitāhua in 2015 (Riekkola et al. 2018), a further 55 samples were collected in 2016 (n = 34) and 2017 (n = 21). When combined with the 302 samples collected around mainland NZ this gave a total dataset of 438 samples of which 415 (95%) successfully passed the quality control criteria of genotyping at a minimum of 11 loci.
After reconciling matches of DNA profiles between- and within-years, these 415 DNA profiles were found to represent 350 individual whales: 346 whales sampled one or more times within the same year and four sampled at least once in two or more years. Twelve of the individuals were beachcast at the time of sampling and were therefore unavailable for recapture in subsequent years. Three of the between-year recaptures were males sampled during the Cook Strait surveys (northbound): one whale was seen in 2004, 2005 and 2007, another in 2010 and 2011, and the third whale was seen in 2011 and 2012. The remaining between-year match was a female first sampled in Rangitāhua in 2015 and again in 2017. All matches were supported by an average of 13.4 matching microsatellite loci (range = 10–15). For a minimum of 10 loci the probability of a match by chance (PID) ranged from 1.0 × 10⁻⁸ to 4.1 × 10⁻¹⁴ depending on the variability of the loci in a given match. Based on this PID we are confident that the markers used were able to differentiate individuals in a population of a few thousand whales (Constantine et al. 2012).
After duplicates were removed there were 157 individuals in the NZnth migratory stream, 77 individuals in the NZsth migratory stream and 116 in the Rangitāhua migratory stream. There was a significant male bias in the sex ratio of sampled whales in the NZnth stream (P < 0.0001), consistent with findings from the East Australia migratory corridor (Brown et al. 1995) and wintering grounds in Oceania (Constantine et al. 2012). However, there was no significant sex bias in either of the southbound migratory streams (NZsth, P = 0.3618; Rangitāhua, P = 0.1137).
A further 824 samples were collected from the wintering grounds of American Samoa (n = 138), French Polynesia (n = 272), and the Pacific coasts of Panama (n = 200), Colombia (n = 158) and Ecuador (n = 56). Thirty-five of these samples failed to amplify for a minimum of 11 loci and were removed from the dataset, while the remaining 789 samples amplified for an average of 14.5 loci. The DNA profiles generated from samples collected from American Samoa, French Polynesia and Colombia were merged with the previously published dataset (Steel et al. 2018) and within-region duplicates were removed from all datasets. This resulted in a total of 214 individuals identified in American Samoa, 353 in French Polynesia, 163 in Panama, 247 in Colombia and 49 in Ecuador (Table 2).
| Region | Abbreviation | Years | QC11 | # Ind. | # M | # F | # U | # mtDNA | ||
|---|---|---|---|---|---|---|---|---|---|---|
| Australia wintering grounds | ||||||||||
| West AustraliaA | WA | 2007 | – | 204 | 185 | |||||
| Great Barrier ReefB | 2011–2017 | 92 | 78 | 52 | 26 | – | 77 | |||
| East AustraliaC | 1996–2004 | – | 734 | 403 | 311 | 20 | 316 | |||
| Combined East Australia | CEA | 809 | 454 | 335 | 392 | |||||
| Oceania wintering grounds | ||||||||||
| New CaledoniaB | NC | 1995–2017 | 1919 | 1402 | 827 | 549 | 26 | 1363 | ||
| TongaD | Tg | 1991–2005 | 483 | 346 | 224 | 112 | 10 | 337 | ||
| American Samoa/Samoa D , E | AS/Sa | 2001–2019 | 232 | 214 | 155 | 58 | 1 | 206 | ||
| French PolynesiaD , E | FP | 1997–2012 | 562 | 353 | 190 | 154 | 9 | 343 | ||
| FP/AS/Sa | 1997–2019 | 794 | 546 | 329 | 207 | 10 | 528 | |||
| East Pacific wintering grounds | ||||||||||
| ColombiaD , E | Co | 1991–1999, 2015–2018 | 293 | 247 | 152 | 64 | 31 | 222 | ||
| EcuadorE | Ec | 2006–2010 | 52 | 49 | 33 | 7 | 9 | 46 | ||
| PanamaE | Pa | 2016–2019 | 200 | 163 | 106 | 57 | – | 159 | ||
| Co/Ec/Pa | 1991–1999, 2006–2019 | 545 | 452 | 287 | 125 | 40 | 420 | |||
| Migratory streams | ||||||||||
| New Zealand – northboundE | 2004–2012 | 180 | 157 | 108 | 42 | 7 | 145 | |||
| New Zealand – southboundE | 2003–2021 | 100 | 77 | 38 | 34 | 5 | 74 | |||
| Rangitāhua – southboundE , F | 2015–2017 | 135 | 116 | 51 | 65 | – | 112 | |||
The number of males (#M), females (#F) and unknown sex (#U), and number with a mtDNA control region haplotype are also given.
DNA profiles of the 78 individuals identified from samples collected on the Great Barrier Reef, Australia (Garrigue et al. 2020) were compared to the profiles of the 734 individuals from northern New South Wales and southern Queensland, Australia (Anderson et al. 2010) and three duplicates were identified. These duplicates were removed to form the ‘Combined East Australia’ DNA register (Table 2).
Individual connectivity of New Zealand migratory streams
Comparison of the NZnth, NZsth and Rangitāhua DNA registers showed no recaptures between these three migratory streams. However, there were 35 recaptures between NZ whales and wintering grounds. Comparison of the NZnth migratory stream and the wintering grounds of Australia, Oceania and the eastern Pacific revealed 23 recaptures (Table S1), most (72%, n = 18) of which were with New Caledonia. Twelve (67%) of these 18 recaptures were males and six (33%) were females, reflective of the male sampling bias on both the wintering ground and for the northbound whales, where our data were predominantly from whales migrating through Cook Strait. There was one within-year recapture; a male was sampled in Cook Strait in 2012 and subsequently in the New Caledonian wintering ground in the same year, while the other 22 recaptures were in different years. The remaining five recaptures of the NZnth migratory stream were whales on the East Australia wintering ground, comprising three males and two females (Table S1).
There were two recaptures between the NZsth migratory stream and the wintering grounds of East Australia and Oceania. One was a male first sampled in East Australia in 2001 and subsequently in Fiordland in 2020. The other was a female first sampled opportunistically by DOC off Ngāmotu/New Plymouth (Fig. 1), west coast NZ in 2009 and subsequently again in New Caledonia in 2011 (Table S1).
In addition to the four recaptures reported in Riekkola et al. (2018), a further five recaptures were identified between individuals sampled at Rangitāhua and the wintering grounds of Oceania. Four recaptures were from New Caledonia, bringing the total number of recaptures between these two regions to five (three males and two females). The remaining recapture was between a male first sampled in Tonga in 2002 and subsequently again at Rangitāhua in 2016. This brings the total number of recaptures between Rangitāhua and Tonga to three (one male and two females). The remaining recapture to Oceania was a male first sampled in American Samoa in 2009 and subsequently sampled in Rangitāhua in 2015 (reported in Riekkola et al. (2018)). Finally, one recapture was identified between Rangitāhua and the breeding ground of Panama in the east Pacific. This was a male first sampled in Rangitāhua in 2017 and subsequently again in Panama in 2018.
Between-region DNA profile recaptures matched at an average of 12.29 microsatellite loci, genetically identified sex and mtDNA control region haplotype. The probability of identity as calculated in Cervus ranged between 1.26 × 10⁻⁷ and 8.3 × 10⁻²² for the individual matches (Table S1).
Population level comparisons of migratory habitats
The previously unpublished DNA profiles included here represent a substantial increase in the DNA register from the wintering grounds of French Polynesia, American Samoa and Colombia (Olavarría et al. 2007; Albertson et al. 2018). They also allow for new comparisons of these regions with Panama and Ecuador. With these additional samples and locations, an initial test of mtDNA differentiation was conducted between all wintering ground sampling locations to assess the level of genetic structure across the South Pacific. This showed no differentiation between the wintering grounds of Colombia, Ecuador and Panama, and confirmed the lack of differentiation between the wintering grounds of American Samoa/Samoa and French Polynesia first reported from a smaller dataset in Albertson et al. (2018) (Table S2). Given these results, these five wintering grounds were collapsed into two wintering regions, Colombia/Ecuador/Panama, hereafter Co/Ec/Pa, and French Polynesia/American Samoa/Samoa, hereafter FP/AS/Sa, and within region duplicates were removed (Table 2). Pairwise tests of mtDNA differentiation between the wintering grounds, and measures of haplotype and nucleotide diversity were repeated after the revision of these two regions (Table 3). The microsatellite-based genetic differentiation and diversity results were broadly similar to the mtDNA-based analyses but were less informative (Tables S3–S5), therefore we focus on the mtDNA results in the remainder of this paper.
| n | WA | CEA | NC | Tg | FP/AS/Sa | Co/Ec/Pa | ||
|---|---|---|---|---|---|---|---|---|
| WA | 185 | – | 0.0165 | 0.0143 | 0.0160 | 0.0303 | 0.0576 | |
| CEA | 392 | 0.0336 | – | 0.0054 | 0.0145 | 0.0317 | 0.0567 | |
| NC | 1363 | 0.0202 | 0.0043 0.0025 | – | 0.0067 | 0.0250 | 0.0512 | |
| Tg | 337 | 0.0216 | 0.0054 0.0097 | 0.0013 0.0956 | – | 0.0132 | 0.0535 | |
| FP/AS/Sa | 528 | 0.0585 | 0.0173 | 0.0202 | 0.0189 | – | 0.0681 | |
| Co/Ec/Pa | 420 | 0.0536 | 0.0330 | 0.0328 | 0.0360 | 0.0435 | – |
Haplotype frequency, FST, differentiation shown above the diagonal, nucleotide, ΦST, differentiation shown below the diagonal. All P-values were <0.0001 except for the three shown in italics.
Across all wintering grounds, a total of 117 mtDNA control region haplotypes were described from 3181 individuals. Patterns of regional haplotype and nucleotide diversity were similar to those reported in Olavarría et al. (2007) and Albertson et al. (2018), with New Caledonia having the highest values for both measures (h = 0.9735 and π = 2.08%), the east Pacific wintering ground of Co/Ec/Pa having the lowest haplotype diversity (h = 0.9044) and FP/As/Sa having the lowest nucleotide diversity (π = 1.80%) (Table S6).
The haplotype differentiation of mtDNA was highly significant between the six designated wintering regions (P < 0.0001) (Table 3). Tests of nucleotide differentiation were also significant (P < 0.0001) for most pairwise comparisons, the exception being tests between East Australia, New Caledonia and Tonga. Within these, East Australia was significantly different to both New Caledonia (P = 0.0025) and Tonga (P = 0.0097), however Tonga and New Caledonia were not differentiated (P = 0.0956). This is different from results reported in Olavarría et al. (2007) where New Caledonia and Tonga were weakly differentiated at the nucleotide level (P = 0.045).
Sequences of the mtDNA control region were available for 145 of the NZnth individuals, 74 of the NZsth individuals and 112 of the individuals at Rangitāhua (Table 2). A total of 69 mtDNA haplotypes was described from all three migratory streams. Both haplotype and nucleotide diversity were highest in Rangitāhua (h = 0.9706 and π = 2.2% respectively, Table 4). For the NZnth and NZsth whales, haplotype diversity and nucleotide diversity were very similar (h = 0.9696, π = 2.16%, and h = 0.9711, π = 2.13%, respectively, Table 4). Pairwise tests of mtDNA haplotype differentiation between the three regions showed that Rangitāhua was significantly different from both NZnth and NZsth (FST = 0.0087, P ≤ 0.0001 and Fst = 0.0104, P = 0.0003, respectively) but NZnth and NZsth were not significantly different from each other (FST = 0.0015, P = 0.2492). At the nucleotide level none of the three migratory streams were significantly different from each other, with ΦST values ranging from 0.0016 (P = 0.2995) between NZsth and Rangitāhua, to 0.0075 between NZnth and both NZsth (P = 0.0946) and Rangitāhua (P = 0.0536).
| Migratory stream | n | k | Variable sites | h | π (%) | |
|---|---|---|---|---|---|---|
| Rangitāhua | 112 | 44 | 52 | 0.9706 ± 0.0049 | 2.2 ± 1.12 | |
| NZnth | 145 | 41 | 51 | 0.9696 ± 0.0040 | 2.16 ± 1.10 | |
| NZsth | 74 | 39 | 49 | 0.9711 ± 0.0075 | 2.13 ± 1.09 |
The total number of mtDNA haplotypes (k), number of variable sites, haplotype diversity (h) and nucleotide diversity (π) are given for each migratory stream.
A total of 140 haplotypes including seven previously undescribed haplotypes (GenBank PX148109 to PX148115; Table S7) was identified in the entire dataset, with one haplotype present in the Rangitāhua stream not found in any of the wintering grounds EC007 (Riekkola et al. 2018). Pairwise tests of mtDNA haplotype differentiation showed that the three NZ migratory streams were significantly different from the six wintering grounds except for NZsth and the wintering ground of East Australia (FST = 0.0002, P = 0.4077; Table 5a). However, the differentiation between NZnth and East Australia was only weakly significant (P = 0.0404), suggesting a connection between both north and southbound migratory streams passing mainland NZ and the wintering ground of East Australia. For the Rangitāhua migratory stream, population pairwise tests agree with those reported in Riekkola et al. (2018), with all comparisons showing significant differentiation.
| Wintering ground | N | Rangitāhua (n = 112) | NZnth (n = 145) | NZsth (n = 54) | |
|---|---|---|---|---|---|
| (a) Haplotype frequency differentiation | |||||
| WA | 185 | 0.0172 (<0.0001) | 0.0149 (<0.0001) | 0.0140 (0.0001) | |
| CEA | 392 | 0.0114 (<0.0001) | 0.0023 (0.0404) | 0.0002 (0.4077) | |
| NC | 1363 | 0.0030 (0.0105) | 0.0037 (0.0007) | 0.0041 (0.0143) | |
| Tg | 337 | 0.0039 (0.0161) | 0.0116 (<0.0001) | 0.0148 (<0.0001) | |
| FP/AS/Sa | 528 | 0.0195 (<0.0001) | 0.0260 (<0.0001) | 0.0307 (<0.0001) | |
| Co/Ec/Pa | 420 | 0.0538 (<0.0001) | 0.0553 (<0.0001) | 0.0551 (<0.0001) | |
| (b) Nucleotide differentiation | |||||
| WA | 185 | 0.0245 (0.0004) | 0.0254 (0.0002) | 0.0285 (0.0013) | |
| CEA | 392 | 0.0095 (0.0135) | 0.0119 (0.0033) | 0.0000 (0.8305) | |
| NC | 1363 | 0.0024 (0.1358) | 0.0040 (0.0458) | 0.0000 (0.4338) | |
| Tg | 337 | 0.0030 (0.1468) | 0.0095 (0.0117) | 0.0008 (0.3240) | |
| FP/AS/Sa | 528 | 0.0222 (0.0005) | 0.0360 (<0.0001) | 0.0195 (0.0048) | |
| Co/Ec/Pa | 420 | 0.0352 (<0.0001) | 0.0443 (<0.0001) | 0.0308 (0.0006) | |
Locations are WA, West Australia; CEA, Combined East Australia includes the Great Barrier Reef and other sites along the east coast; NC, New Caledonia; Tg, Tonga; FP/AS/Sa, French Polynesia/American Samoa/Samoa; Co/Ec/Pa, Colombia/Ecuador/Panama.
Most pairwise tests of nucleotide differentiation were also significantly different but weaker than for pairwise tests of haplotype frequency differences (Table 5a, b). The Rangitāhua stream is not differentiated from either the wintering grounds of New Caledonia (P = 0.1358) or Tonga (P = 0.1468). The NZsth whales were not differentiated from New Caledonia (P = 0.4338), Tonga (P = 0.3240) or East Australia (P = 0.8305). The NZnth stream is differentiated from all six wintering grounds but the level of differentiation is weak for the New Caledonia comparison (P = 0.0458).
Mixed-stock apportionment
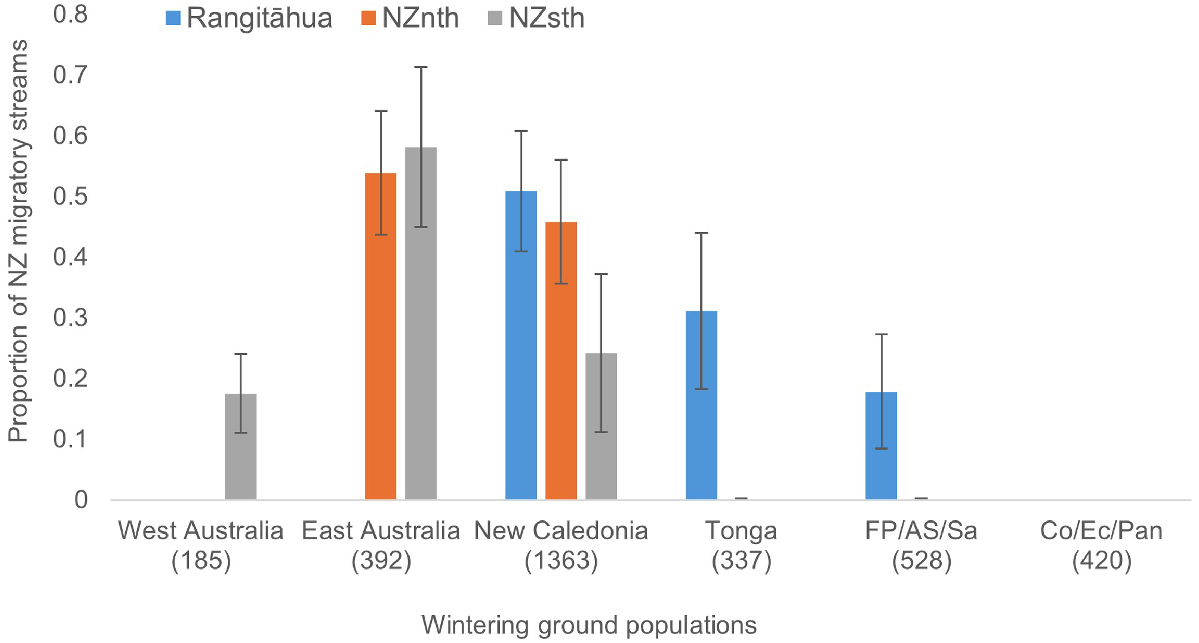
Given the significant regional differentiation in mtDNA haplotypes, a mixed-stock analysis was considered appropriate for describing the apportionment of the three NZ migratory streams to the six wintering grounds. Results from these analyses suggest different but overlapping composition of wintering grounds for humpbacks migrating past NZ (Table S8, Fig. 2). The apportionment of the Rangitāhua stream is consistent with results reported in Riekkola et al. (2018), with ~50% of the population apportioned to the wintering ground of New Caledonia, ~31% to Tonga and the remaining ~18% to FP/AS/Sa. Most of the NZnth stream apportioned to East Australia (53.9%, s.e. = 10.18%) and New Caledonia (45.9%, s.e. = 10.18%) with smaller apportionment to Tonga (1.5%) and FP/AS/Sa (0.9%), with the latter two wintering grounds having standard errors that overlapped with zero. The NZsth stream also showed the greatest apportionment to East Australia (60.8%, s.e. = 12.08%) with lower but still significant apportionment to New Caledonia (20.8%, s.e. = 11.79%) and West Australia (18.4%, s.e. = 6.25%).
Mixed-stock estimates of the three New Zealand (NZ) migratory streams, using mtDNA haplotypes and six wintering regions as source stocks; West Australia, East Australia, New Caledonia, Tonga, French Polynesia/American Samoa/Samoa (FP/AS/Sa) and Colombia/Ecuador/Panama (Co/Ec/Pan); sample size is under the region name. Blue bars represent proportion of each wintering ground estimated for the southbound Rangitāhua stream; orange bars represent proportion estimated for the northbound mainland NZ (NZnth) stream and grey bars represent proportion estimated for the southbound mainland (NZsth) stream. Error bars represent standard errors as derived in SPAM v3.7 using 10,000 bootstrap resamplings See Table S7 for details.
Discussion
Historically, the coastal waters of NZ were part of important migratory pathways for exploited baleen whales including blue whales (Branch et al. 2007), southern right whales (Dawbin 1986; Carroll et al. 2015), and humpback whales (Dawbin 1959). For some species the migratory connections and routes appear to be lost or limited likely due to intensive historical whaling (Clapham et al. 2009) as seen in southern right whales that have yet to recolonise formerly important mainland NZ and offshore Rēkohu/Chatham Islands, and the Louisville Ridge regions (Richards 2002; Carroll et al. 2014; Cranswick et al. 2022). Antarctic blue whales have yet to recover in abundance but are acoustically detected in NZ waters mainly via their distinctive ‘Z-calls’, suggesting seasonal migration patterns (Warren et al. 2021). Humpback whales primarily use NZ waters as migratory pathways and short stopover locations rather than important feeding or wintering habitat (Dawbin 1959; Gibbs et al. 2018). Annual surveys of northbound humpback whales in the Cook Strait showed a small but significant increase in numbers over a 12-year survey period, suggesting slow recovery of this migratory population 50 years after an end to whaling (Gibbs et al. 2018). Migratory corridors or stopovers such as Cook Strait, Rangitāhua and Fiordland can serve as important geographic reference points for provisioning, socialising or resting to ensure successful onward migration. Feeding is well documented in East Australia waters (e.g. Owen et al. 2015; Pirotta et al. 2021), a region with strong connectivity to the Fiordland stream of whales in south-west NZ. Satellite tracking revealed humpback whales foraging in upwellings off the coast of Fiordland (Andrews-Goff et al. 2018), and some foraging behaviours (<10% of encounters) are observed in the nearshore fiord waters (Corne 2023). When whales from different breeding grounds interact at migratory sites, that contact can have effects that go beyond the individuals involved to influence the populations, such as the development of song (Garland et al. 2015; Owen et al. 2019). This is well known to the Indigenous people (Māori of the tribe Ngāti Kuri) that are kaitiaki (guardians) of Rangitāhua (see Grose et al. 2020)) who, as ocean voyagers, have extensive knowledge of whales. Recent research on song (Owen et al. 2019) highlights the continued importance of remote habitats for whale aggregations as the whales recover throughout Oceania wintering grounds.
Humpback whale migratory streams through New Zealand waters
Whilst we have robust findings, of notable importance is that the three core sampling areas are geographically limited given the wide distribution of humpback whales in NZ waters. The genetic diversity and number of humpback sightings will increase with the recovery of this species. Future research may well find different patterns of genetic connectivity on the whales’ migration routes reflective of ongoing population growth. Individual movement and sharing of genetic diversity indicated connectivity between all three NZ migratory streams of humpback whales and the wintering grounds of New Caledonia. Unsurprisingly, there was a lack of connectivity to the east Pacific wintering grounds with one exception of a male humpback migrating south past Rangitāhua in September 2017 and subsequently sampled in Panama in September 2018. Perhaps further connections will be revealed through genetic or photo-identification matches in future work. With the relatively large sample size across the migratory streams in NZ waters, we found different patterns of association between each migratory stream and wintering grounds in the central Pacific and Australia.
Whales migrating north showed similar assignment proportions to both New Caledonia and East Australia in the mixed-stock analysis, although most of the individual recaptures were to New Caledonia, likely due to the larger and contemporaneous sample from this wintering ground available for comparison (Chero et al. 2020). Over the past 20 years, low levels of connectivity between whales migrating north to East Australia and New Caledonia have been reported via photo-identification, genetic and song analyses (e.g. Garrigue et al. 2000, 2011, 2020; Constantine et al. 2012; Franklin et al. 2014; Warren et al. 2020). During the Discovery marking program of the modern whaling era, most recaptures of NZ northbound whales were to East Australia followed by Fiji and Norfolk Island (Dawbin 1964). Discovery marks were deployed in New Caledonia, but the low number of deployments (n = 32) limited the chance of recapture and there was no whaling in that region, i.e. no chance for recapture of marks deployed elsewhere (Dawbin 1964). There are no contemporary samples from Fiji or Norfolk Island with which to assess current connectivity.
Whales migrating south had the strongest population level connectivity to East Australia, with one direct recapture, no significant genetic differentiation and the highest assignment values to this wintering ground. The mixed-stock analysis and one direct recapture also indicate a connection to the New Caledonia breeding ground. These findings are consistent with other methods, including satellite tracks from whales tagged in East Australia and New Caldonia including a female with a calf from New Caledonia that passed offshore of Fiordland (Garrigue et al. 2015; Andrews-Goff et al. 2018; Reisinger et al. 2021). The same tagged female was encountered in 2018 in the Ross Sea region, the feeding grounds to which she was tracked in 2012 (R. Constantine and C. Garrigue, unpubl. data). Historically, most records of humpback whales passing nearshore Fiordland were from their southern migration with very few records during the whales’ northern migration (Dawbin 1956). The recent dedicated DOC surveys have revealed that most sightings of humpback whales occur during the late austral winter to spring but interestingly recent acoustic monitoring recorded whales throughout most of the year (Corne 2023). This may reflect the fully recovered East Australia population (Bejder et al. 2016; Noad et al. 2019), and overlapping north and south migration periods due to the different timing of demographic cohorts (e.g. Dawbin 1966; Franklin et al. 2011; Seyboth et al. 2023). Our mixed-stock analysis also suggested a connection between NZsth and West Australia that could reflect the occasional movement of whales between the west and east coasts of Australia (Noad et al. 2000; Andrews-Goff et al. 2018). Alternatively, this result could be due to the small sample sizes from each of these Australian populations relative to their current abundance; abundance in 2015 was estimated to be 24,545 for East Australia (Noad et al. 2019) and 20,337 for West Australia (IWC 2016; Seyboth et al. 2023).
Our additional samples confirmed previous reports highlighting the connections between the Rangitāhua migratory habitat and central Pacific wintering grounds (Riekkola et al. 2018). In comparison, there is only a single photo-identification connection between Rangitāhua and East Australia (Ngāti Kuri, unpubl. data) and no population level genetic data suggesting a strong connection to East Australia. To pass Rangitāhua, whales from Australia need to migrate eastwards either directly to Rangitāhua or via another Oceania wintering ground, rather than their more typical southern coastal route. Notably, with the connectivity between the growing populations in East Australia and New Caledonia (Orgeret et al. 2014; Garrigue et al. 2015; Noad et al. 2019; Chero et al. 2020), and more whales sighted in the former whaling area in the Chesterfield-Bellona Reef complex in the Coral Sea (Oremus and Garrigue 2014; Derville et al. 2020; Garrigue et al. 2020) in time there may be more whales from this region migrating past Rangitāhua, possibly including more northbound whales. Rangitāhua is the NZ migratory stream with connections to the most wintering grounds, with increasing numbers of whales from several different wintering grounds stopping for periods of up to 5 days to rest and socialise before they continue southeast to a 4500 km expanse of the Southern Ocean for feeding (Riekkola et al. 2018; Riekkola et al. 2019). Derville et al. (2019) predict that more southern regions, such as Rangitāhua, may become wintering grounds as increasing ocean temperatures make tropical Oceania waters unsuitable for humpbacks.
Fidelity to a migratory stream?
The low recapture of individuals across years within each of the three NZ migratory streams indicates either limited fidelity to a migratory route by individual humpback whales or suggests that large numbers of whales are passing through these migratory corridors, reducing the likelihood of between-year recaptures. For northbound whales, a recent acoustic study estimated 240 to 360 whales migrating north past Te Pātaka-o-Rākaihautū/Banks Peninsula which creates a pinch point, south of Kaikōura (Childerhouse et al. 2022). Based on acoustic recordings of humpback whale song offshore from Kaikōura, in the Cook Strait and in the South Taranaki Bight but very few recordings off Wairarapa (southeast North Island), most of the estimated 240 to 360 whales migrating along the Kaikōura coast are considered to move through the Cook Strait and into the Tasman Sea (Warren et al. 2020). This suggests that, currently, the low recapture rate in the Cook Strait surveys may be due to low fidelity of humpback whales to this migratory stream rather than many whales passing through this corridor. Alternatively, even though the estimated peak of migration was targeted with each annual Cook Strait field season, interannual variability in migratory timing, particularly by different demographic cohorts of humpback whales (Dawbin 1966) possibly resulted in heterogeneity of sampling and a reduction in the likelihood of recaptures.
There is currently no estimate for the number of whales that join the southbound migratory stream passing Fiordland. Given the strong connection of this stream to the large East Australia population and the limited sampling as shown in our study, no conclusions about fidelity to this migratory route can be made. Similarly, increasing numbers of whales are passing Rangitāhua (Brown 2010; Gibson 2014; Riekkola et al. 2018) but there are no estimates of abundance for this remote island. There are photo-identification resights (e.g. Clark et al. 2017; Ngāti Kuri, unpubl. data) but with sporadic sampling and an increasing number of whales, we currently do not have sufficient genetic samples to observe the recaptures required to determine migratory fidelity.
Future migratory paths and connections
Given that the estimates of the wintering grounds are in the tens of thousands for both East and West Australia (see summary in Seyboth et al. (2023)), and thousands for Oceania (e.g. Constantine et al. 2012; Orgeret et al. 2014; Chero et al. 2020), recaptures with wintering grounds are likely influenced by the large numbers of whales in these regions. With the increased abundance of humpbacks throughout the Southern Hemisphere, and the vast expanse of Oceania winter breeding ground and Antarctic feeding grounds (Reisinger et al. 2021), connections with more remote locations, such as Central and South America and the West Antarctic Peninsula are more likely (e.g. Robbins et al. 2011; Stevick et al. 2013; Acevedo et al. 2022). Photo-identification has regularly been used to identify humpback whales in NZ waters since the 1990s (e.g. Constantine et al. 2007), and the increased use of automated platforms such as Happywhale (Cheeseman et al. 2022) and Flukebook (Blount et al. 2022) have increased the accessibility to images throughout the world, including citizen/community science. Many of the NZ humpback whale images have been uploaded into Happywhale and a preliminary assessment has revealed connections between whales migrating past NZ to East Australia, Norfolk Island, New Caledonia, Tonga and Panama, some of which we have also identified with DNA profiles (Cooper 2021).
The samples from dead, beachcast whales were valuable in supplementing dedicated biopsy survey samples and had the same patterns of connectivity. We recommend that these continue to be collected and curated in the National Archive (NZCeTA) as, over time, these samples may reveal other migratory streams e.g. north-east North Island that used to be a southbound migration route or whales from different populations. The presence of humpbacks almost year-round off Fiordland is interesting and worthy of further investigation (Corne 2023). The south-west coast of NZ was first identified as a provisioning area for humpback whales on southbound migration during the whaling era (Dawbin 1956). More recently, area-restricted search behaviour identified by state-space modelling of satellite tagged whales (Andrews-Goff et al. 2018) and visual observation of foraging behaviour, most likely on zooplankton, and defecation of humpback whales (Corne 2023) indicate that the Fiordland region of the south-west coast continues to be a provisioning area. While the future environment in this region is uncertain due to climate change, modelling suggests that primary production will either increase or stay the same as primary productivity decreases in areas to the north (Chiswell and Sutton 2020). Under either scenario the Fiordland region will continue to be an important provisioning area for migrating humpback whales. As such, risks of interaction with anthropogenic activities such as tourism, fishing and aquaculture should be assessed and monitored.
One of the limitations of our study is sample size and determining how many whales are passing through NZ waters that are almost certainly growing each year, in line with population recovery rates (e.g. Gibson 2014; Gibbs et al. 2018). Quantifying the number of whales passing our three key study sites, and identifying increased sightings in other locations e.g. Kaikōura, Banks Peninsula (Childerhouse et al. 2022) will enable us to determine whether this issue is one of sample size, timing of sampling, fidelity to migration pathways or all three. With the collapse of some subpopulations due to whaling (e.g. Fiji, Gibbs et al. 2006; Miller et al. 2015), the whales using migratory paths through NZ waters may have been extirpated. This work reinforces previous studies showing that humpback whales can rediscover previously used migratory habitat (e.g. Clapham et al. 2008; Jackson et al. 2024), and in this case, have retained strong historical connections to the west Pacific region, including East Australia (Dawbin 1956, 1966). We suggest prioritising sampling in Fiji to understand contemporary connections of humpback whales to NZ and Oceania wintering grounds.
Conclusion
Despite more than 60 years since the collapse of humpback whale populations throughout Oceania (IWC 2015), our comprehensive genetic analysis of these three key migratory streams show that humpback whales retain the cultural memory and use of their pre-whaling migration routes. Using expanded DNA registers of whales from East Australia, Oceania and east Pacific wintering grounds, we revealed strong connections to the west Pacific region. Overall, the mainland NZ north and southbound migratory streams show strong individual and population level connections to East Australia and New Caledonia, with New Caledonia being the dominant migratory connection to Rangitāhua. Southbound whales passing Rangitāhua had connections to the widest range of wintering grounds supporting findings by Riekkola et al. (2018), reflecting the importance of this historic stopover (Grose et al. 2020) as Oceania’s humpback whales recover from near extinction.
Data availability
The mtDNA haplotype GenBank codes and references to previously published research are provided in Table S7. To manage the data sovereignty of mana whenua – Māori (the Indigenous people of Aotearoa New Zealand) under Te Tiriti o Waitangi, use of the Aotearoa/New Zealand data that support this study will require permission upon reasonable request to the corresponding author (Rochelle Constantine r.constantine@auckland.ac.nz).
Declaration of funding
This research was generously funded by the following: Rangitāhua – The Pew Charitable Trust, Southern Ocean Research Partnership – International Whaling Commission, Ministry for Primary Industries – BRAG, BLAKE NZ, and The University of Auckland Waipapa Taumata Rau. Cook Strait – OMV NZ Ltd, Transact Management Ltd, Canon NZ, Dolphin Watch Picton and WWF NZ. Fiordland – the Fiordland Marine Mammal Liaison Group. New Caledonia – Provinces Sud, Nord et Iles, International Fund for Animal Welfare, Fondation d’Entreprises Total, and Total Pacifique, Vale S. A. Panama – The Islas Secas Foundation. None of these sources of support were involved in the writing of the manuscript.
Acknowledgements
We thank mana whenua (Māori specific to each research location) throughout Aotearoa New Zealand for supporting this research. We particularly thank the DOC rangers who collected samples from beachcast whales and supported the fieldwork efforts. The research at Rangitāhua was possible due to close involvement with the Ngāti Kuri Trust Board. The Cook Strait research was possible due to the ex-whalers of the Perano Whaling Station, the Heberley family and many volunteers. The Fiordland research was supported by the four Southland Rūnaka of Ngāi Tahu, especially Ōraka Aparima Rūnaka, the skippers and crew of the DOC vessel Southern Winds. The New Caledonia work was possible thanks to Rémi Dodémont, Véronique Pérard, Solène Derville, and Claire-Daisy Bonneville for field and lab support, and the support of many field assistants. The research in American Samoa was possible due to David Mattila, Alden Tagarino, Adam Miles and the American Samoa Department of Marine and Wildlife Resources. Panacetacea is grateful to Luis Bernal, Ursula Gonzalez, Betzi Perez, and numerous interns for field assistance. Fieldwork was conducted with the following permissions: Aotearoa New Zealand – Department of Conservation and Animal Ethics approvals after consultation with mana whenua (Māori from the research location); New Caledonia – the authorities of the three provinces and the government of New Caledonia; American Samoa – the U.S. National Marine Fisheries Service and the government of American Samoa; French Polynesia – the French Polynesian Ministry of the Environment; Panama – the Panamanian Minesterio de Ambiente; and Colombia – Colombia Ministerio de Medio Ambiente y Desarrollo Sostenible granted to Universidad de los Andes.
References
Acevedo J, Aguayo-Lobo A, Beeman P, Cheeseman T, Olavarría C (2022) From the Antarctic Peninsula to eastern Australia: the longest migration of a humpback whale through the South Pacific Ocean. Mammalian Biology 102(4), 1463-1468.
| Crossref | Google Scholar |
Albertson GR, Friedlaender AS, Steel DJ, Aguayo-Lobo A, Bonatto SL, Caballero S, Constantine R, Cypriano-Souza AL, Engel MH, Garrigue C, Flórez-González L, Johnston DW, Nowacek DP, Olavarría C, Poole MM, Read AJ, Robbins J, Sremba AL, Baker CS (2018) Temporal stability and mixed-stock analyses of humpback whales (Megaptera novaeangliae) in the nearshore waters of the Western Antarctic Peninsula. Polar Biology 41, 323-340.
| Crossref | Google Scholar |
Anderson M, Steel D, Franklin W, Franklin T, Paton D, Burns D, Harrison P, Baverstock PR, Garrigue C, Olavarría C, Poole M, Hauser N, Constantine R, Thiele D, Clapham P, Donoghue M, Baker CS (2010) Microsatellite genotype matches of eastern Australian humpback whales to Area V feeding and breeding grounds. Report SC/62/SH7 to Scientific Committee of the International Whaling Commission, Agadir, Morocco.
Andrews-Goff V, Bestley S, Gales NJ, Laverick SM, Paton D, Polanowski AM, Schmitt NT, Double MC (2018) Humpback whale migrations to Antarctic summer foraging grounds through the southwest Pacific Ocean. Scientific Reports 8(1), 12333.
| Crossref | Google Scholar |
Baker CS, Slade RW, Bannister JL, Abernethy RB, Weinrich MT, Lien J, Urban J, Corkeron P, Calmabokidis J, Vasquez O, Palumbi SR (1994) Hierarchical structure of mitochondrial DNA gene flow among humpback whales Megaptera novaeangliae, world-wide. Molecular Ecology 3(4), 313-327.
| Crossref | Google Scholar | PubMed |
Bejder M, Johnston DW, Smith J, Friedlaender A, Bejder L (2016) Embracing conservation success of recovering humpback whale populations: evaluating the case for downlisting their conservation status in Australia. Marine Policy 66, 137-141.
| Crossref | Google Scholar |
Bérubé M, Jørgensen H, McEwing R, Palsbøll PJ (2000) Polymorphic di-nucleotide microsatellite loci isolated from the humpback whale, Megaptera novaeangliae. Molecular Ecology 9(12), 2181-2183.
| Crossref | Google Scholar | PubMed |
Blount D, Gero S, Van Oast J, Parham J, Kingen C, Scheiner B, Stere T, Fisher M, Minton G, Khan C, Dulau V, Thompson J, Moskvyak O, Berger-Wolf T, Stewart CV, Holmberg J, Levenson JJ (2022) Flukebook: an open-source AI platform for cetacean photo identification. Mammalian Biology 102(3), 1005-1023.
| Crossref | Google Scholar |
Bonin A, Bellemain E, Bronken Eidesen P, Pompanon F, Brochmann C, Taberlet P (2004) How to track and assess genotyping errors in population genetics studies. Molecular Ecology 13(11), 3261-3273.
| Crossref | Google Scholar | PubMed |
Bortolotto GA, Thomas L, Hammond P, Zerbini AN (2021) Alternative method for assessment of southwestern Atlantic humpback whale population status. PLoS ONE 16(11), e0259541.
| Crossref | Google Scholar |
Branch TA (2007) Abundance of Antarctic blue whales south of 60°S from three complete circumpolar sets of surveys. Journal of Cetacean Research and Management 9(3), 253-262.
| Crossref | Google Scholar |
Branch TA, Stafford KM, Palacios DM, Allison C, Bannister JL, Burton CLK, Cabrera E, Carlson CA, Galletti Vernazzani B, Gill PC, Hucke-Gaete R, Jenner KCS, Jenner M-NM, Matsuoka K, Mikhalev YA, Miyashita T, Morrice MG, Nishiwaki S, Sturrock VJ, Tormosov D, Anderson RC, Baker AN, Best PB, Borsa P, Brownell RL, Jr, Childerhouse S, Findlay KP, Gerrodette T, Ilangakoon AD, Joergensen M, Kahn B, Ljungblad DK, Maughan B, McCauley RD, McKay S, Norris TF, Oman Whale And Dolphin Research Group, Rankin S, Samaran F, Thiele D, Van Waerebeek K, Warneke RM (2007) Past and present distribution, densities and movements of blue whales Balaenoptera musculus in the Southern Hemisphere and northern Indian Ocean. Mammal Review 37(2), 116-175.
| Crossref | Google Scholar |
Brown MR, Corkeron PJ, Hale PT, Schultz KW, Bryden MM (1995) Evidence for a sex-segregated migration in the humpback whale (Megaptera novaeangliae). Proceedings of the Royal Society of London. Series B: Biological Sciences 259(1355), 229-234.
| Crossref | Google Scholar |
Carroll EL, Jackson JA, Paton D, Smith TD (2014) Two intense decades of 19th century whaling precipitated rapid decline of right whales around New Zealand and east Australia. PLoS ONE 9(4), e93789.
| Crossref | Google Scholar |
Carroll EL, Baker CS, Watson M, Alderman R, Bannister J, Gaggiotti OE, Gröcke DR, Patenaude N, Harcourt R (2015) Cultural traditions across a migratory network shape the genetic structure of southern right whales around Australia and New Zealand. Scientific Reports 5(1), 16182.
| Crossref | Google Scholar |
Cheeseman T, Southerland K, Park J, Olio M, Flynn K, Calambokidis J, Jones L, Garrigue C, Frisch Jordán A, Howard A, Reade W, Neilson J, Gabriele C, Clapham P (2022) Advanced image recognition: a fully automated, high-accuracy photo-identification matching system for humpback whales. Mammalian Biology 102(3), 915-929.
| Crossref | Google Scholar |
Chero G, Pradel R, Derville S, Bonneville C, Gimenez O, Garrigue C (2020) Reproductive capacity of an endangered and recovering population of humpback whales in the Southern Hemisphere. Marine Ecology Progress Series 643, 219-227.
| Crossref | Google Scholar |
Childerhouse S, Jackson J, Baker CS, Gales N, Clapham P, Brownell JRL (2008) Megaptera novaeangliae, Oceania subpopulation. (IUCN Red List of Threatened Species). Available at https://www.iucnredlist.org/species/132832/3463914
Chiswell SM, Sutton PJH (2020) Relationships between long-term ocean warming, marine heat waves and primary production in the New Zealand region. New Zealand Journal of Marine and Freshwater Research 54(4), 614-635.
| Crossref | Google Scholar |
Chittleborough RG (1965) Dynamics of two populations of the humpback whale, Megaptera novaeangliae (Borowski). Australian Journal of Marine and Freshwater Research 16, 33-128.
| Crossref | Google Scholar |
Clapham PJ, Zerbini AN (2015) Are social aggregation and temporary immigration driving high rates of increase in some Southern Hemisphere humpback whale populations? Marine Biology 162(3), 625-634.
| Crossref | Google Scholar |
Clapham PJ, Aguilar A, Hatch LT (2008) Determining spatial and temporal scales for management: lessons from whaling. Marine Mammal Science 24(1), 183-201.
| Crossref | Google Scholar |
Clapham P, Mikhalev Y, Franklin W, Paton D, Baker CS, Ivashchenko YV, Brownwell RL, Jr (2009) Catches of humpback whales, Megaptera novaeangliae, by the Soviet Union and other nations in the Southern Ocean, 1947-1973. Marine Fisheries Review 71(1), 39-43.
| Google Scholar |
Clark MR, Trnski T, Constantine R, Aguirre JD, Barker J, Betty E, Bowden DA, Connell A, Duffy C, George S, Hannam S, Liggins L, Middleton C, Mills S, Pellentin A, Riekkola L, Sampey A, Sewell MA, Spong K, Stewart A, Stewart R, Struthers C, van Oosterom L (2017) Biodiversity of the Kermadec Islands and offshore waters of the Kermadec Ridge: report of a coastal, marine mammal and deep-sea survey (TAN1612). Report number 179, New Zealand Aquatic Environment and Biodiversity Report, Ministry for Primary Industries, Wellington, New Zealand. Available at https://niwa.co.nz/sites/default/files/TAN1611-Voyage-report-Kermadec-Islands-survey-web.pdf
Constantine R, Russell K, Gibbs N, Childerhouse S, Baker CS (2007) Photo-identification of humpback whales (Megaptera novaeangliae) in New Zealand waters and their migratory connections to breeding grounds of Oceania. Marine Mammal Science 23(3), 715-720.
| Crossref | Google Scholar |
Constantine R, Jackson JA, Steel D, Baker CS, Brooks L, Burns D, Clapham P, Hauser N, Madon B, Mattila D, Oremus M, Poole M, Robbins J, Thompson K, Garrigue C (2012) Abundance of humpback whales in Oceania using photo-identification and microsatellite genotyping. Marine Ecology Progress Series 453, 249-261.
| Crossref | Google Scholar |
Constantine R, Steel D, Allen J, Anderson M, Andrews O, Baker CS, Beeman P, Burns D, Charrassin J-B, Childerhouse S, Double M, Ensor P, Franklin T, Franklin W, Gales N, Garrigue C, Gibbs N, Harrison P, Hauser N, Hutsel A, Jenner C, Jenner M-N, Kaufman G, Macie A, Mattila D, Olavarría C, Oosterman A, Paton D, Poole M, Robbins J, Schmitt N, Stevick P, Tagarino A, Thompson K, Ward J (2014) Remote Antarctic feeding ground important for east Australian humpback whales. Marine Biology 161(5), 1087-1093.
| Crossref | Google Scholar |
Cranswick AS, Constantine R, Hendriks H, Carroll EL (2022) Social media and citizen science records are important for the management of rarely sighted whales. Ocean & Coastal Management 226, 106271.
| Crossref | Google Scholar |
Dawbin WH (1956) The migrations of humpback whales which pass the New Zealand coast. Transactions of the Royal Society of New Zealand 84(1), 147-196.
| Google Scholar |
Dawbin WH (1959) New Zealand and South Pacific whale marking and recoveries to the end of 1958. Norsk Hvalfangsttiid 48, 213-238.
| Google Scholar |
Dawbin WH (1964) Movements of humpback whales marked in the southwest Pacific Ocean 1952 to 1962. Norsk Hvalfangsttiid 53, 68-78.
| Google Scholar |
Debevec EM, Gates RB, Masuda M, Pella J, Reynolds J, Seeb LW (2000) Computer note. SPAM (version 3.2): statistics program for analyzing mixtures. Journal of Heredity 91(6), 509-511.
| Crossref | Google Scholar | PubMed |
Derville S, Torres LG, Albertson R, Andrews O, Baker CS, Carzon P, Constantine R, Donoghue M, Dutheil C, Gannier A, Oremus M, Poole MM, Robbins J, Garrigue C (2019) Whales in warming water: assessing breeding habitat diversity and adaptability in Oceania’s changing climate. Global Change Biology 25(4), 1466-1481.
| Crossref | Google Scholar | PubMed |
Derville S, Torres LG, Zerbini AN, Oremus M, Garrigue C (2020) Horizontal and vertical movements of humpback whales inform the use of critical pelagic habitats in the western South Pacific. Scientific Reports 10(1), 4871.
| Crossref | Google Scholar |
Excoffier L, Lischer HEL (2010) Arlequin suite ver 3.5: a new series of programs to perform population genetics analyses under Linux and Windows. Molecular Ecology Resources 10(3), 564-567.
| Crossref | Google Scholar | PubMed |
Franklin T, Franklin W, Brooks L, Harrison P, Baverstock P, Clapham P (2011) Seasonal changes in pod characteristics of eastern Australian humpback whales (Megaptera novaeangliae) Hervey Bay 1992–2005. Marine Mammal Science 27(3), E134-E152.
| Crossref | Google Scholar |
Franklin W, Franklin T, Gibbs N, Childerhouse S, Garrigue C, Constantine R, Brooks L, Burns D, Paton D, Poole MM, Hauser N, Donoghue M, Russell K, Mattila DK, Robbins J, Anderson M, Olavarría C, Jackson J, Noad M, Harrison P, Baverstock P, Leaper R, Baker SC, Clapham P (2014) Photo-identification confirms that humpback whales (Megaptera novaeangliae) from eastern Australia migrate past New Zealand but indicates low levels of interchange with breeding grounds of Oceania. Journal of Cetacean Research and Management 14, 133-140.
| Google Scholar |
Garland EC, Goldizen AW, Lilley MS, Rekdahl ML, Garrigue C, Constantine R, Hauser ND, Poole MM, Robbins J, Noad MJ (2015) Population structure of humpback whales in the western and central South Pacific Ocean as determined by vocal exchange among populations. Conservation Biology 29(4), 1198-1207.
| Crossref | Google Scholar | PubMed |
Garrigue C, Forestell P, Greaves J, Gill PC, Naessig P, Patenaude NJ, Baker CS (2000) Migratory movements of humpback whales (Megaptera novaeangliae) between New Caledonia, East Australia and New Zealand. Journal of Cetacean Research and Management 2, 111-115.
| Crossref | Google Scholar |
Garrigue C, Constantine R, Poole M, Hauser N, Clapham P, Donoghue M, Russell K, Paton D, Mattila DK, Robbins J, Baker CS (2011) Movement of individual humpback whales between wintering grounds of Oceania (South Pacfic), 1999 to 2004. Journal of Cetacean Research and Management (Special Issue) 3, 275-281.
| Google Scholar |
Garrigue C, Clapham PJ, Geyer Y, Kennedy AS, Zerbini AN (2015) Satellite tracking reveals novel migratory patterns and the importance of seamounts for endangered South Pacific humpback whales. Royal Society Open Science 2(11), 150489.
| Crossref | Google Scholar |
Garrigue C, Constantine R, Derville S, Dodemont R, Pérard V (2016) Kermadec Islands constitute a migratory corridor for the humpback whales breeding in New Caledonia. In ‘Proceedings of Kermadec - discoveries and connections’, Wellington, New Zealand. (Eds B Golder, A Connell) pp. 51–53. (The PEW Charitable Trusts). Available at https://www.pew.org/en/research-and-analysis/fact-sheets/2010/08/01/kermadec-science-symposium-proceedings
Garrigue C, Derville S, Bonneville C, Baker CS, Cheeseman T, Millet L, Paton D, Steel D (2020) Searching for humpback whales in a historical whaling hotspot of the Coral Sea, South Pacific. Endangered Species Research 42, 67-82.
| Crossref | Google Scholar |
Gibbs N, Paton DA, Childerhouse S, Clapham P (2006) Assessment of the current abundance of humpback whales in the Lomaiviti Island group of Fiji and a comparison with historical data. Report to Inter-sessional Workshop for the Comprehensive Assessment of Southern Hemisphere humpback whales. Scientific Committee of the International Whaling Commission, Hobart, Australian.
Gibbs NJ, Dunlop RA, Gibbs EJ, Heberley JA, Olavarría C (2018) The potential beginning of a postwhaling recovery in New Zealand humpback whales (Megaptera novaeangliae). Marine Mammal Science 34(2), 499-513.
| Crossref | Google Scholar |
Goodhand WE (1963) Humpback whaling in Australian waters – a declining industry. Geography 48(3), 325-326.
| Google Scholar |
Grose SO, Pendleton L, Leathers A, Cornish A, Waitai S (2020) Climate change will re-draw the map for marine megafauna and the people who depend on them. Frontiers in Marine Science 7, 547.
| Crossref | Google Scholar |
Jackson JA, Ross-Gillespie A, Butterworth D, Findlay K, Holloway S, Robbins J, Rosenbaum H, Weinrich M, Baker CS, Zerbini A (2015) Southern hemisphere humpback whale comprehensive assessment - a synthesis and summary: 2005–2015. pp. 1–38. Report SC/66a/SH03 to Scientific Committee of the International Whaling Commission, San Diego, USA.
Jackson JA, Carroll EL, Smith TD, Zerbini AN, Patenaude NJ, Baker CS (2016) An integrated approach to historical population assessment of the great whales: case of the New Zealand southern right whale. Royal Society Open Science 3(3), 150669.
| Crossref | Google Scholar |
Jackson JA, Kennedy AS, Bamford CCG, Hart I, Martin S, MacDonald D, Moore MM, Carroll EL (2024) Humpback whales (Megaptera novaeangliae) return to Cumberland Bay, South Georgia, one century after the peak of whaling. Marine Mammal Science 40(1), 237-245.
| Crossref | Google Scholar |
Kalinowski ST, Taper ML, Marshall TC (2007) Revising how the computer program CERVUS accommodates genotyping error increases success in paternity assignment. Molecular Ecology 16(5), 1099-1106.
| Crossref | Google Scholar | PubMed |
Katona S, Baxter B, Brazier O, Kraus S, Perkins J, Whitehead H (1979) Identification of Humpback Whales by Fluke Photographs. In ‘Behavior of marine animals: current perspectives in research’. (Eds HE Winn, BL Olla) pp. 33–44. (Springer US: Boston, MA) 10.1007/978-1-4684-2985-5_2
Kershaw F, Carvalho I, Loo J, Pomilla C, Best PB, Findlay KP, Cerchio S, Collins T, Engel MH, Minton G, Ersts P, Barendse J, Kotze PGH, Razafindrakoto Y, Ngouessono S, Meyer M, Thornton M, Rosenbaum HC (2017) Multiple processes drive genetic structure of humpback whale (Megaptera novaeangliae) populations across spatial scales. Molecular Ecology 26(4), 977-994.
| Crossref | Google Scholar | PubMed |
Krützen M, Barré LM, Möller LM, Heithaus MR, Simms C, Sherwin WB (2002) A biopsy system for small cetaceans: darting success and wound healing in Tursiops spp. Marine Mammal Science 18(4), 863-878.
| Crossref | Google Scholar |
Lambertsen RH (1987) A biopsy system for large whales and its use for cytogenetics. Journal of Mammalogy 68(2), 443-445.
| Crossref | Google Scholar |
Miller C, Batibasiga A, Sharma-Gounder S, Solomona P (2015) Very low numbers of endangered Oceania humpback whales seen in Fijian waters. The South Pacific Journal of Natural and Applied Sciences 33(2), 39-45.
| Crossref | Google Scholar |
Morin PA, Martien KK, Archer FI, Cipriano F, Steel D, Jackson J, Taylor BL (2010) Applied conservation genetics and the need for quality control and reporting of genetic data used in fisheries and wildlife management. Journal of Heredity 101(1), 1-10.
| Crossref | Google Scholar | PubMed |
Noad MJ, Cato DH, Bryden MM, Jenner M-N, Jenner KCS (2000) Cultural revolution in whale songs. Nature 408(6812), 537.
| Crossref | Google Scholar |
Noad MJ, Kniest E, Dunlop RA (2019) Boom to bust? Implications for the continued rapid growth of the eastern Australian humpback whale population despite recovery. Population Ecology 61(2), 198-209.
| Crossref | Google Scholar |
Olavarría C, Childerhouse S, Gibbs N, Baker CS (2006) Contemporary genetic diversity of New Zealand humpback whales and their genetic relationship with Breeding Stocks D,E,F and G. Report to Inter-sessional Workshop for the Comprehensive Assessment of Southern Hemisphere humpback whales. Scientific Committee of the International Whaling Commission, Hobart, Australia.
Olavarría C, Baker CS, Garrigue C, Poole M, Hauser N, Caballero S, Flórez-González L, Brasseur M, Bannister J, Capella J, Clapham P, Dodemont R, Donoghue M, Jenner C, Jenner M-N, Moro D, Oremus M, Paton D, Rosenbaum H, Russell K (2007) Population structure of South Pacific humpback whales and the origin of the eastern Polynesian breeding grounds. Marine Ecology Progress Series 330, 257-268.
| Crossref | Google Scholar |
Oremus M, Garrigue C (2014) Humpback whale surveys in the Chesterfield Archipelago: a reflection using 19th century whaling records. Marine Mammal Science 30(2), 827-834.
| Crossref | Google Scholar |
Orgeret F, Garrigue C, Gimenez O, Pradel R (2014) Robust assessment of population trends in marine mammals applied to New Caledonian humpback whales. Marine Ecology Progress Series 515, 265-273.
| Crossref | Google Scholar |
Owen K, Warren JD, Noad MJ, Donnelly D, Goldizen AW, Dunlop RA (2015) Effect of prey type on the fine-scale feeding behaviour of migrating east Australian humpback whales. Marine Ecology Progress Series 541, 231-244.
| Crossref | Google Scholar |
Owen C, Rendell L, Constantine R, Noad MJ, Allen J, Andrews O, Garrigue C, Michael Poole M, Donnelly D, Hauser N, Garland EC (2019) Migratory convergence facilitates cultural transmission of humpback whale song. Royal Society Open Science 6(9), 190337.
| Crossref | Google Scholar |
Paetkau D, Strobeck C (1994) Microsatellite analysis of genetic variation in black bear populations. Molecular Ecology 3(5), 489-495.
| Crossref | Google Scholar | PubMed |
Pallin LJ, Baker CS, Steel D, Kellar NM, Robbins J, Johnston DW, Nowacek DP, Read AJ, Friedlaender AS (2018) High pregnancy rates in humpback whales (Megaptera novaeangliae) around the Western Antarctic Peninsula, evidence of a rapidly growing population. Royal Society Open Science 5(5), 180017.
| Crossref | Google Scholar |
Palsbøll PJ, Larsen F, Hansen SE (1991) Sampling of skin biopsies from free-ranging large cetaceans in West Greenland: development of new biopsy tips and bolt designs. Report of the International Whaling Commission 13, 71-79.
| Google Scholar |
Palsbøll PJ, Bérubé M, Larsen AH, Jørgensen H (1997) Primers for the amplification of tri- and tetramer microsatellite loci in baleen whales. Molecular Ecology 6(9), 893-895.
| Crossref | Google Scholar | PubMed |
Peakall R, Smouse PE (2006) GENALEX 6: genetic analysis in Excel. Population genetic software for teaching and research. Molecular Ecology Notes 6, 288-295.
| Crossref | Google Scholar |
Pirotta V, Owen K, Donnelly D, Brasier MJ, Harcourt R (2021) First evidence of bubble-net feeding and the formation of ’super-groups’ by the east Australian population of humpback whales during their southward migration. Aquatic Conservation: Marine and Freshwater Ecosystems 31(9), 2412-2419.
| Crossref | Google Scholar |
Reisinger RR, Friedlaender AS, Zerbini AN, Palacios DM, Andrews-Goff V, Dalla Rosa L, Double M, Findlay K, Garrigue C, How J, Jenner C, Jenner M-N, Mate B, Rosenbaum HC, Seakamela SM, Constantine R (2021) Combining regional habitat selection models for large-scale prediction: circumpolar habitat selection of southern ocean humpback whales. Remote Sensing 13(11), 2074.
| Crossref | Google Scholar |
Richards R (2002) Southern right whales: a reassessment of their former distribution and migration routes in New Zealand waters, including on the Kermadec grounds. Journal of the Royal Society of New Zealand 32(3), 355-377.
| Crossref | Google Scholar |
Riekkola L, Zerbini AN, Andrews O, Andrews-Goff V, Baker CS, Chandler D, Childerhouse S, Clapham P, Dodémont R, Donnelly D, Friedlaender A, Gallego R, Garrigue C, Ivashchenko Y, Jarman S, Lindsay R, Pallin L, Robbins J, Steel D, Tremlett J, Vindenes S, Constantine R (2018) Application of a multi-disciplinary approach to reveal population structure and Southern Ocean feeding grounds of humpback whales. Ecological Indicators 89, 455-465.
| Crossref | Google Scholar |
Riekkola L, Andrews-Goff V, Friedlaender A, Constantine R, Zerbini AN (2019) Environmental drivers of humpback whale foraging behavior in the remote Southern Ocean. Journal of Experimental Marine Biology and Ecology 517, 1-12.
| Crossref | Google Scholar |
Robbins J, Dalla Rosa L, Allen JM, Mattila DK, Secchi ER, Friedlaender AS, Stevick PT, Nowacek DP, Steel D (2011) Return movement of a humpback whale between the Antarctic Peninsula and American Samoa: a seasonal migration record. Endangered Species Research 13(2), 117-121.
| Crossref | Google Scholar |
Rousset F (2008) genepop’007: a complete re-implementation of the genepop software for Windows and Linux. Molecular Ecology Resources 8(1), 103-106.
| Crossref | Google Scholar | PubMed |
Schmitt NT, Double MC, Baker S, Gales N, Childerhouse S, Polanowski AM, Steel D, Albertson R, Olavarría C, Garrigue C, Poole M, Hauser N, Constantine R, Paton D, Jenner CS, Jarman SN, Peakall R (2014a) Mixed-stock analysis of humpback whales (Megaptera novaeangliae) on Antarctic feeding grounds. Journal of Cetacean Research Management 14(1), 141-157.
| Google Scholar |
Schmitt NT, Double MC, Jarman SN, Gales N, Marthick JR, Polanowski AM, Scott Baker C, Steel D, Jenner KCS, Jenner M-NM, Gales R, Paton D, Peakall R (2014b) Low levels of genetic differentiation characterize Australian humpback whale (Megaptera novaeangliae) populations. Marine Mammal Science 30(1), 221-241.
| Crossref | Google Scholar |
Seyboth E, Meynecke J-O, de Bie J, Roychoudhury A, Findlay K (2023) A review of post-whaling abundance, trends, changes in distribution and migration patterns, and supplementary feeding of Southern Hemisphere humpback whales. Frontiers in Marine Science 10, 997491.
| Crossref | Google Scholar |
Steel D, Anderson M, Garrigue C, Olavarría C, Caballero S, Childerhouse S, Clapham P, Constantine R, Dawson S, Donoghue M, Flórez-González L, Gibbs N, Hauser N, Oremus M, Paton D, Poole MM, Robbins J, Slooten L, Thiele D, Ward J, Baker CS (2018) Migratory interchange of humpback whales (Megaptera novaeangliae) among breeding grounds of Oceania and connections to Antarctic feeding areas based on genotype matching. Polar Biology 41(4), 653-662.
| Crossref | Google Scholar |
Stevick PT, Allen JM, Engel MH, Felix F, Haase B, Neves MC (2013) Inter-oceanic movement of an adult female humpback whale between Pacific and Atlantic breeding grounds off South America. Journal of Cetacean Research Management 13, 159-162.
| Crossref | Google Scholar |
Tamura K, Stecher G, Kumar S (2021) MEGA11: molecular evolutionary genetics analysis version 11. Molecular Biology and Evolution 38, 3022-3027.
| Crossref | Google Scholar | PubMed |
Thompson KF, Millar CD, Scott Baker C, Dalebout M, Steel D, van Helden AL, Constantine R (2013) A novel conservation approach provides insights into the management of rare cetaceans. Biological Conservation 157(0), 331-340.
| Crossref | Google Scholar |
Valsecchi E, Amos W (1996) Microsatellite markers for the study of cetacean populations. Molecular Ecology 5, 151-156.
| Crossref | Google Scholar | PubMed |
Valsecchi E, Corkeron PJ, Galli P, Sherwin W, Bertorelle G (2010) Genetic evidence for sex-specific migratory behaviour in western South Pacific humpback whales. Marine Ecology Progress Series 398, 275-286.
| Crossref | Google Scholar |
Waits JL, Leberg PL (2000) Biases associated with population estimation using molecular tagging. Animal Conservation 3, 191-199.
| Crossref | Google Scholar |
Waits LP, Luikart G, Taberlet P (2001) Estimating the probability of identity among genotypes in natural populations: cautions and guidelines. Molecular Ecology 10(1), 249-256.
| Crossref | Google Scholar | PubMed |
Waldick RC, Brown MW, White BN (1999) Characterization and isolation of microsatellite loci from the endangered North Atlantic right whale. Molecular Ecology 8(10), 1763-1765.
| Crossref | Google Scholar | PubMed |
Warren VE, Constantine R, Noad M, Garrigue C, Garland EC (2020) Migratory insights from singing humpback whales recorded around central New Zealand. Royal Society Open Science 7(11), 201084.
| Crossref | Google Scholar |
Warren VE, Širović A, McPherson C, Goetz KT, Radford CA, Constantine R (2021) Passive acoustic monitoring reveals spatio-temporal distributions of antarctic and pygmy blue whales around central New Zealand. Frontiers in Marine Science 7, 575257.
| Crossref | Google Scholar |
Weir BS, Cockerham CC (1984) Estimating F-Statistics for the analysis of population structure. Evolution 38(6), 1358-1370.
| Crossref | Google Scholar | PubMed |
Weir CR, Stanworth A (2020) The Falkland Islands (Malvinas) as sub-Antarctic foraging, migratory and wintering habitat for southern right whales. Journal of the Marine Biological Association of the United Kingdom 100(1), 153-163.
| Crossref | Google Scholar |
Wright S (1949) The genetical structure of populations. Annals of Eugenics 15(1), 323-354.
| Crossref | Google Scholar |