

The Unusual Fluorescence Quenching of Coumarin 314 by β-Cyclodextrin and the Effect of β-Cyclodextrin on its Binding with Calf Thymus DNA
Chandrasekaran Sowrirajan A , Sameena Yousuf A and Israel V. M. V. Enoch A BA Department of Chemistry, Karunya University, Coimbatore 641 114, Tamil Nadu, India.
B Corresponding author. Email: drisraelenoch@gmail.com
Australian Journal of Chemistry 67(2) 256-265 https://doi.org/10.1071/CH13364
Submitted: 11 July 2013 Accepted: 25 September 2013 Published: 17 October 2013
Abstract
This paper discusses the binding of a laser dye, Coumarin 314 with β-cyclodextrin, studied mainly by UV-visible spectroscopy, 2D rotating-frame nuclear Overhauser effect spectroscopy (ROESY), steady-state spectroscopy and time-resolved fluorescence spectroscopy. The role of β-cyclodextrin on the binding of Coumarin 314 with calf thymus DNA was investigated. Coumarin 314 shows a hyperchromic shift of absorption and a quenching of fluorescence due to binding with β-cyclodextrin. The fluorescence quenching is non-linear and the reason for the non-linearity is discussed. The unusual fluorescence quenching on Coumarin 314–β-cyclodextrin binding is rationalised from the effect of acidity on absorption, fluorescence, and molecular modelling studies. Additional proof for the mode of binding is given by 2D ROESY. The capped and exposed portions of the Coumarin 314 molecule in the Coumarin 314–β-cyclodextrin complex when binding with calf thymus DNA were visualised based on spectral and molecular modelling studies.
Introduction
Coumarins (benzo-α-pyrones) and coumarin derivatives find useful applications in the dye industry[1] and as laser dyes.[2] Coumarins are also used in several areas of synthetic chemistry, medicinal chemistry, and photochemistry. Coumarins exhibit fascinating fluorescence properties, which are sensitive to their local environment. This sensitivity has led to their widespread application as sensitive fluorescent probes for a variety of systems. Coumarins exhibit a variety of pharmacological activities, such as antiviral[3] and antimicrobial activity.[4] Coumarin 314 (C314, 2,3,5,6–1H,4H-tetrahydro-9-carbethoxyquinolizino-[9,9a,1-gh]coumarin) is a laser dye which exists in two different forms.[5] In the crystalline form, the coumarin moiety is planar, one of the piperidine rings is disordered and the N atom is in a planar configuration.[6] Owing to its interesting optical properties, C314 has been studied with doped sol-gel silica rods.[7] Red emitting small molecules with a high quantum yield of emission, including C314, have been used as dopants, e.g. organic dyes, to tune the emission colour of a polymers.[8,9] The ultrafast excited-state electron transfer[10] and the interfacial dynamics[11] of C314 have been reported. The in-plane rotational dynamics of C314 at the surfactant sodium dodecyl sulfate (SDS)/aqueous interface have been studied using femtosecond time-resolved second-harmonic spectroscopy.[12]
In order to improve the solubility and chemical stability of molecules, inclusion complexes are nowadays largely used in the pharmaceutical field or whenever modulated properties of the guest are needed. Much interest has been shown on cyclodextrins (CDs), because of their remarkable ability to form host–guest inclusion complexes with a wide variety of molecules.[13,14] β-Cyclodextrin (β-CD) is a cyclic oligomer formed by seven units of glucose via α-(1,4)-linkages, having a toroidal shape with a hydrophobic cavity and hydrophilic exterior. Due to this specific structure, it acts as a molecular host for a large variety of guest molecules, both polar and non-polar, through non-covalent interactions.[14] The ground and excited state properties of fluorophores are dramatically modified by β-CD.[15–18] Information like guest location, micro-environmental conditions such as polarity and hydrophobicity, area openness, and structural rigidity need to be known in detail in order to understand the behaviour of these host-guest systems in solution and project them for possible applications.
There have been reports on the supramolecular interactions of drugs and organic dyes with various biological targets aimed at the elucidation of structural and functional features of biomacromolecules.[19] The development of effective therapeutic agents which control gene expression require the characterisation of the interaction of small molecules with DNA.[20] Studies reveal that binding affinities of small molecules towards the biomacromolecules are controlled by various structural and electronic factors and these studies have led to the design of effective drugs against various diseases.[21] Hence selective blocking of a part of a small molecule by a capping agent like cyclodextrin would help to better understand the site of binding with DNA and direct the mode of binding. This article reports (i) the mode of binding, the stoichiometry, and the binding constants between C314 with β-CD, (ii) the effect of pH on the host–guest complexes, (iii) the binding of C314 with calf thymus DNA (ctDNA), and (iv) the role of β-CD on the binding of C314 with ctDNA.
Materials
Chemicals
Coumarin 314 and β-cyclodextrin were purchased respectively from Sigma–Aldrich (Bangalore) and Hi Media and used as received. ctDNA was purchased from Genei (Merck), India. The purity of ctDNA was checked from optical measurements (A260/A280 > 1.8, where A represents absorbance). Various pH solutions for the effect on acidity studies (adjusted with phosphoric acid and sodium hydroxide) were purchased from Qualigens. Solutions of pH below 2 were made with appropriate dilution of sulfuric acid (Qualigens). H0 and pH values below pH 2 were measured from a modified Hammett’s acidity scale.[22] All the solvents used from Merck were of spectral grade which were used as received without further purification.
Methods
Preparation of C314–β-CD Solid Complex
C314 (0.2 g, 0.63 mmol) was dissolved in 5 mL of methanol and an equimolar amount of β-CD (0.72 g) was dissolved in 5 mL of doubly distilled water, in separate 50 mL beakers. The solution of C314 was added slowly to the solution of β-CD at room temperature in an Ultra-sonicator and sonicated for 30 min. The mixture was then warmed to 50°C for 10 min, then kept at room temperature for two days. The solid obtained was re-crystallised and analysed.
Preparation of Test Solutions
Test solutions were prepared by dilution of stock solutions of C314 and β-CD. Owing to the poor solubility of C314 in water, the stock solution was made in methanol, with a concentration of 1 % w/v. ctDNA was dissolved in 0.05 mol dm–3 of NaCl before use to obtain the desired concentration. Binding of C314 to ctDNA in the absence and the presence of β-CD were studied by diluting appropriate amounts of C314, β-CD, and ctDNA from their stock solutions in the presence of 1 mL acetate buffer solution (pH, 3.5). All experiments were carried out at ambient temperature of 25 ± 2°C and double distilled water was used. The test solutions were homogeneous after all additives were added and the absorption and fluorescence spectra were recorded against appropriate blank solutions.
Instrumentation
Absorption measurements were performed with a double beam ultraviolet-visible (UV–Vis) spectrophotometer (Jasco–V630) using 1 cm path length cells. A spectrofluorimeter (Perkin-Elmer LS55) equipped with a 120 W Xenon lamp for excitation was used for fluorescence measurements. Both the excitation and the emission bandwidths were set up at 4 nm. Time–resolved fluorescence measurements were done on a time-correlated single photon counting spectrofluorimeter (Ti-Sapphire Laser – Spectra-physics; Jobin-Vyon) with a picosecond laser source 350 – 450 nm. An Ultra-sonicator PCI 9L 250H (India) was used for sonication. pH studies were carried out using an Elico LI 120 pH meter (India). 2D rotating-frame nuclear Overhauser effect spectroscopy (ROESY) spectra were recorded on a Bruker AV III instrument operating at 500 MHz with [D6]DMSO as solvent for the C314–β-CD complex, with TMS as an internal standard. Chemical shift values were obtained downfield from TMS in part per million (ppm). The mixing time for ROESY spectra was 200 ms under spin lock conditions. The interactions of C314 with β-CD and DNA was determined by molecular modelling studies using the software Glide 5.5 (Schrödinger). B-DNA was used as a model for the theoretical studies. The structures of β-CD and duplex 5′-d(CCATTAATGG)2-3′ were built and optimised by molecular mechanics.[23,24] The bond length and breadth of C314 were calculated using RasMol Version 2.7.5.2 software[25] (Fig. S1 in the Supplementary Material).
Results and Discussion
Absorption Study on the Inclusion Complexation of C314 with β-CD
The effect of β-CD on the absorption spectrum of C314 was studied by keeping the concentration of C314 fixed and changing the concentration of the added β-CD. Absorption spectra of C314 with different amounts of β-CD are shown in Fig. 1a and data are summarised in Table 1. The addition of β-CD increased the absorbance of C314. A hyperchromic shift could be observed until a concentration of 6.0 × 10⁻³ mol dm–3 of β-CD was reached; above this concentration, the absorbance did not change significantly. This hyperchromic effect might be due to the complexation of C314 with β-CD. Also, a significant red shift of the absorption maximum, of 6 nm (λmax changed from 448 to 454 nm), was observed. If the complexation of C314 occurred with the encapsulation of the chromophore by β-CD and if it is a considerably strong complex, a blue shift would have been observed. This expected blue shift, as the chromophore moves from a hydrophilic (solvent cage of water) to a non-polar hydrophobic environment, is due to the inner oxygen atoms of the d-glucopyranose ring of β-CD. However, in the case of C314, since we observed a significant red shift, we suggest that there might be some surfactant action of the cyclodextrin molecule with the involvement of its hydroxyl groups, as discussed below. Fig. 1b shows the plot of 1/A - A0 vs1/[β-CD]. For this plot, the absorption spectral data were used in the following Eqn 1.
Here, A0 is the absorbance of C314 in water, A is the absorbance at various concentrations of β-CD, and A′ is the absorbance at the highest concentration of β-CD. K is the binding constant. The linearity in the plot suggested a 1 : 1 stoichiometry of C314–β-CD interaction, with a calculated binding constant (K) of 1.89 × 10³ mol–1 dm3.
|
|
Fluorescence Study on the Inclusion Complexation of C314 with β-CD
Fig. 2a shows the fluorescence spectra of C314 with various concentrations of β-CD and spectral data are summarised in Table 1. Upon addition of β-CD, the fluorescence of C314 quenched, with a larger magnitude initially up to 4.0 × 10⁻³ mol dm–3 of β-CD and weakly above that concentration of the added β-CD. The Stern–Volmer plot for the quenching of fluorescence showed a downward concave curve (Fig. 2b). The plot was non-linear, curving downward, and came to a saturation point which is characteristic of two fluorophore populations, one of which was not accessible to the quencher. The possible explanation for this might be that at low concentrations the C314 molecule was accessible by β-CD and complete association of C314 with β-CD offered constraints to the accessibility of the C314 molecules by excess β-CD molecules. However, these molecules could have partially interacted with C314 and hence the low rate of quenching at higher concentration of β-CD. This is an obvious deviation from the linear Stern–Volmer plots. In such cases, the Stern–Volmer quenching constant of the accessible fraction (Ka) can be determined from Eqn 2[26]:
where fa is the fraction of the initial fluorescence that is accessible to the quencher. The modified form of the Stern–Volmer equation allows fa and Ka to be determined graphically (Fig. 2c). A plot of F0/ΔF vs 1/[Q] yields fa–1 as the intercept and (faKa) –1 as the slope. The Stern–Volmer quenching constant of the accessible fraction Ka = 2.57 × 10² mol–1 dm3 value was calculated, as mentioned in the above procedure.
|
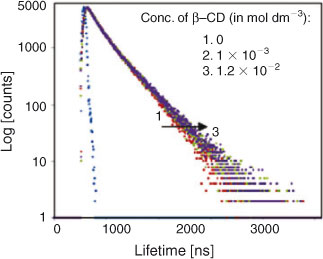
Time-Resolved Fluorescence Study on the Inclusion Complexation of C314 with β-CD
Fig. 3 shows the time–resolved decay profiles of C314 in water and in low and high concentrations of β-CD. A biexponential decay in water was observed (Table 2). The relative amplitudes of the two states in the presence of β-CD changed from those in water. Obviously there was a decrease in relative amplitude of the shorter lifetime state and an increase in the longer lifetime. These observations suggested that inclusion complexation of C314 with β-CD did indeed occur. However, the quenching of fluorescence might have been more overwhelming than the usual enhancement effect reported for β-CD complexation of other fluorophores.[18] The present case of quenching of fluorescence might be due to complexation through the quinolizidine part of the C314 molecule. If the π-electron rich centre of the choromophore had been involved in an inclusion complex, the vibrational restriction offered by the β-CD cavity to that π-electron rich centre capped inside the β-CD would have shown pronounced enhancement of fluorescence. These discussions are further supported by a study on the acid strength of C314 in the absence and presence of β-CD and 2D ROESY NMR characterisation of the C314–β-CD solid inclusion complex.
|
|
Effect of Acidity on the Free and the β-CD Complexed Form of C314
The effect of acid strength on the absorption spectrum of C314 is shown in Fig. 4a. A decrease in pH from 4.6 made the absorption band at 448 nm (corresponding to the neutral form of C314) to decrease in magnitude with a corresponding increase at 300 nm (due to the formation of the monocation). There is an isosbestic point at 380 nm due to the neutral–monocation equilibrium. The ground state pKa value was calculated as follows:

where CT is the total concentration of the compound in both forms and ϵ1(λ1), ϵ2(λ2), ϵ2(λ1), and ϵ2(λ2) are the molar extinction coefficients of the protonated and neutral forms at wavelengths λ1 and λ2 respectively. The pKa was determined from Eqn 5:

|
The calculated ground state pKa was 1.73. The effect of H0/pH on the fluorescence spectrum of C314 is shown in Fig. 4b. Decrease of pH from 4.6 resulted in fluorescence quenching. When the fluorescence got quenched fully (at pH 1.0) a new red shifted band started appearing and continued up to H0 0.13. This might be due to the formation of monocation. The initial quenching of fluorescence might be due to the abstraction of electrons from the molecule by protons in solution, forming a less fluorescent complex. The pKa* (the excited state pKa) for the neutral – monocation equilibrium was obtained from the monocation formation curve as 2.4 (Fig. 4c). Hence, the C314 molecule becomes more basic in the excited state.
Fig. 5a, b shows the effect of H0/pH on C314, in the presence of β-CD, on absorbance and fluorescence spectra. There was no clear isosbestic point observed for the prototropic equilibrium in the absorption spectrum. This might be due to the weak complexation between C314 and β-CD. However there was a blue shift corresponding to the formation of a monocation, and the absorption band due to a neutral form of C314 disappeared at 454 nm. The ground state pKa was 1.6. This indicated that β-CD still had an influence on the pKa value by providing an environment shielding the protonation of nitrogen although it did not fully cover the C314 molecule. The fluorescence spectrum showed quenching of fluorescence down to H0 0.13 and the intensity almost became zero. The formation of a new band could not be observed beyond that H0 value in the presence of β-CD. The non-availability of unshared pairs of electrons from the quinolizidine nitrogen for protonation and monocation formation may be due to steric hindrance due to C314–β-CD complexation.
|
2D ROESY NMR Spectroscopy
In order to confirm the complexation of C314 with β-CD, the prepared solid inclusion complex was analysed by 2D ROESY NMR spectroscopy. The partial 2D ROESY spectrum is shown in Fig. 6. The cross peaks were assigned to 1H NMR chemical shift values of C314–β-CD complex and they are tabulated in Table 3. Cross peaks were observed due to the correlation of methylene protons at positions 10 and 12 of C314 with the secondary hydroxyl groups of β-CD (shown in box 1 in Fig. 6). Also there were off-diagonal peaks for the same protons of C314 with the H2, H5, and H6 protons of the β-CD. Since these protons of the β-CD are at the inner rim of this basket shaped molecule, we conclude that the inclusion complex was formed and the encapsulated C314 was oriented through the quinolizidine part to the β-CD molecule. A visual representation of C314 inclusion into the β-CD molecule is shown in Fig. 7a.
|
|
|
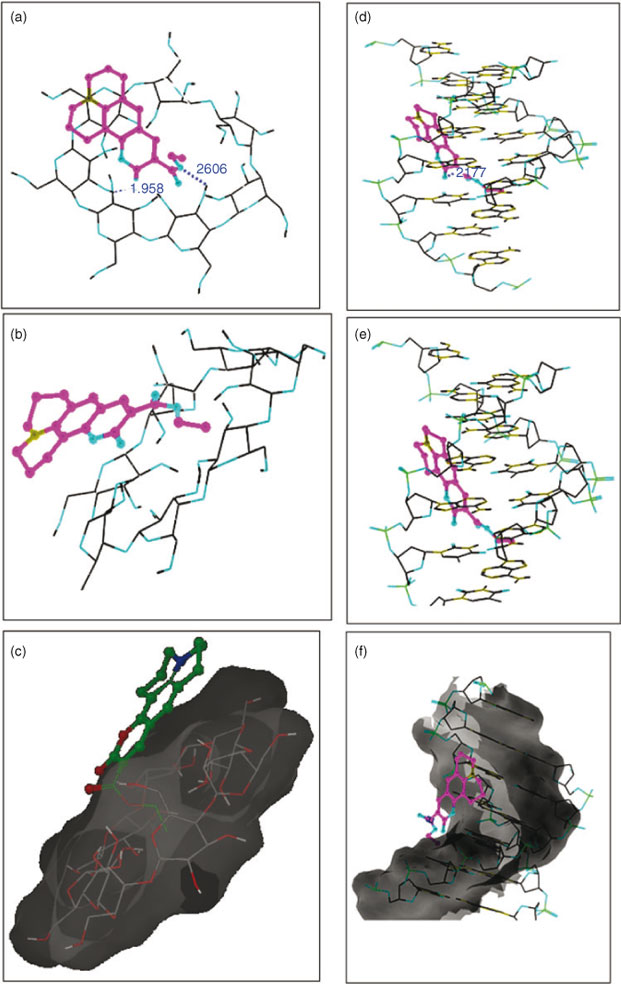
An additional correlation peak is circled in Fig. 6. This corresponds to the interaction of methylene protons of an ester chain of C314 with the H4 proton of the β-CD. This correlation is in accordance with the previous discussion of the red shifted absorption bands in absorptimetry titration, and is supported by the molecular modelling study. Modelling poses are shown in Fig. 8: hydrogen bonding (Fig. 8a), electrostatic (Fig. 8b), and hydrophobic interactions (Fig. 8c) are involved between the ester chain of C314 and β-CD.
|
The Influence of β-CD on the Binding of C314 with ctDNA
Two absorption bands centred at 273 and 449 nm were observed in the titration of C314 with various concentrations of ctDNA (Fig. 9). An enhancement in the absorbance was observed at band 273 nm by increasing the concentration of ctDNA. The absorption maximum shifted to the blue region by 9 nm (changing from 273 to 264 nm). This is due to the binding of C314 with ctDNA and the linearity (inset of Fig. 9) of the plot of A0/A–A0 vs 1/[ctDNA] is obtained from Eqn 6.[27] The binding constant was calculated as 1.03 × 10⁵ mol–1 dm3 (correlation coefficient, 0.99).
where A0 and A are the absorbance of the free guest and the apparent one, and ϵG and ϵH-G are their absorption coefficients, respectively.
|
The titration of C314 with ctDNA was carried out in the presence of 4 × 10⁻³ mol dm–3 of β-CD. The absorption bands shifted from 273 and 449 nm to 271 and 455 nm respectively (Fig. 10). This significant blue shift might be due to the entry of C314 from a polar to the non-polar environment of β-CD. Along with the shift of absorption, an increase in absorbance was also observed. The binding constant of C314–β-CD with ctDNA was calculated from the absorbance changes to be 3.46 × 10⁴ mol–1 dm3. The linear plot of A0/A–A0 vs 1/[ctDNA] for the binding is given in the inset of Fig. 10. The decrease in the binding affinity of C314 with ctDNA in the presence of β-CD might be due to (i) the competitive interaction of sites of C314 for ctDNA and β-CD or (ii) the extraction of C314 from the ctDNA environment by binding of C314 by β-CD. In a variation in the method of experiment, the β-CD was added to the C314 bound ctDNA (at the concentration of C314 and ctDNA in which the binding was complete) to ensure the inclusion of the exposed part of C314. Addition of β-CD to C314–ctDNA resulted in enhancement of the absorption band shown in Fig. 11. The plot between 1/AS–A0 and 1/[β-CD] is shown in the inset of Fig. 11. The linearity in the plot suggested a 1 : 1 stoichiometry with a binding constant of 2.37 × 10² mol–1 dm3 for the binding of β-CD with the exposed part of C314–ctDNA. No change in the stoichiometry on the interaction of C314 with β-CD was observed in the absence and the presence of ctDNA. Based on the complexation results of C314–β-CD discussed earlier, we conclude that the β-CD included quinolizidine part of C314 does not influence the C314 binding with ctDNA. However, the change in binding affinity of C314 with ctDNA in the presence of β-CD leads to the conclusion that the ester moiety of C314 might be involved in competitive binding with β-CD and ctDNA.
|
|
Competitive interaction of C314 with the model dye, methylene blue (MB), for binding with ctDNA was analysed by titration of MB-bound ctDNA with increasing concentrations of C314 from 0 to 20 × 10–6 mol dm–3. The absorption spectra are shown in Fig. S2 in the Supplementary Material. Competitive binding between ctDNA and MB was inferred by the formation of new species and the progressive increase in the intensity of the peak which appeared in the range of 300 to 360 nm. Moreover, there was no significant alteration in the position of the band at 664 nm which indicated the existence of an electrostatic interaction between C314 with ctDNA. To comprehend the mode of binding, the possibility of the presence of various kinds of interactions such as hydrogen bonding, electrostatic, and hydrophobic interactions were optimised by a theoretical model of the interaction of C314 with DNA (Fig. 8d, e, and f respectively]. The results suggested that the ester part of C314 was involved in binding with β-CD and DNA. Hence the competition might have occurred in the interaction of C314 with β-CD and ctDNA. This might have resulted in the decrease in the binding constant of C314–ctDNA in the presence of β-CD.
Fluorescence spectroscopy was used to further analyse the interaction of C314 with ctDNA both in the absence and the presence of β-CD. There was an intense band centred at 494 nm and a weak band at 365 nm. Both in the absence and the presence of β-CD, as the concentration of ctDNA increased, the emission of C314 increased with no considerable shift of the emission maximum (Figs 12 and 13). This change in the emission of C314 with respect to ctDNA added to the argument that C314 bound with ctDNA. C314 should interact with ctDNA in a relatively non-polar environment compared with water. The observation of an increase in the intensity of fluorescence of C314 and C314-β-CD with ctDNA might be due to the decrease in the collision frequency of the solvent molecules with C314 molecules due to the planar aromatic backbone of C314 stacking between adjacent base pairs of ctDNA.[28] Based on the above arguments, the possible mode of binding of C314 with ctDNA is shown schematically in Fig. 7b.
|
|
Conclusions
The UV-Vis absorption spectrum of C314 is enhanced, with a significant red shift, upon interaction with β-CD. The fluorescence spectrum on the other hand, is unusually quenched. The Stern–Volmer plot for the quenching of fluorescence showed a downward curve indicating two fluorophore populations and that at low concentrations the C314 molecule is accessible by β-CD and the excess β-CD molecules cannot be accessed by C314.The relative amplitude of the shorter lifetime state decreases with an increase of the longer lifetime state. The calculated ground state pKa for the neutral–monocation equilibrium of C314 in water is 1.73 and the excited state pKa is 2.4. The C314 molecule becomes more basic in the excited state. The results suggest that the formation of the inclusion complex is through the quinolizidine part of C314 to the β-CD molecule. Also the red shifted absorption bands are due to the surfactant action of the hydroxyls of β-CD involved with the ester part of C314. Binding of C314 to ctDNA in the presence of β-CD resulted in a lower binding constant than in the absence of β-CD. Hence competition might have occurred in the interaction of C314 with β-CD and ctDNA. Thus, β-CD forms an inclusion complex with the quinolizidine part of C314 allowing the ester group to bind with ctDNA.
Supplementary Material
The length and breadth of the C314 molecule measured by RasMol, and the absorption spectra of competitive binding of methylene blue dye with ctDNA with varying concentrations of C314 are available on the Journal’s website.
Acknowledgements
We thank the SERB–Department of Science and Technology, Government of India for financial support (SR/FT/CS-062/2009). The authors also thank the National Center for Ultrafast Processes, Chennai, for support in time-resolved fluorescence studies.
References
[1] D. C. Hooper, J. S. Wolfson, G. L. McHugh, M. B. Winters, M. N. Swartz, Antimicrob. Agents Chemother. 1982, 22, 662.| Crossref | GoogleScholarGoogle Scholar | 1:CAS:528:DyaL3sXhtVCisLY%3D&md5=67454a49d81d83f2321aa177a8458d99CAS | 6295263PubMed |
[2] N. A. Nemkovich, H. Reis, W. Baumann, J. Lumin. 1997, 71, 255.
| Crossref | GoogleScholarGoogle Scholar | 1:CAS:528:DyaK2sXjtlWmtrk%3D&md5=76b2946c4b249c8a412160c47fa16aeeCAS |
[3] J. M. Domagala, S. E. Hagen, E. T. Lunney, D. Bradly, Warner Lambert Co., US Patent 5510375, 1996, A23.
[4] A. I. Eid, F. A. Ragab, S. L. El-Ansary, S. M. El-Gazayerly, F. E. Mourad, Arch. Pharm. 1994, 327, 211.
| Crossref | GoogleScholarGoogle Scholar | 1:CAS:528:DyaK2cXktlGntLk%3D&md5=1243fb7b96c2f161e4b15c8a67f08321CAS |
[5] B.-C. Yip, H.-K. Fun, K. Sivakumar, Z.-Y. Zhou, O. B. Shawkataly, S.-G. Teoh, Acta Crystallogr. C 1995, 51, 956.
| Crossref | GoogleScholarGoogle Scholar |
[6] T. Honda, I. Fujii, N. Hirayama, N. Aoyama, A. Miike, Acta Crystallogr. C 1996, 52, 395.
| Crossref | GoogleScholarGoogle Scholar |
[7] D.-W. Choi, C.-W. Lim, S.-H. Sohn, Optik 2003, 114, 347.
| Crossref | GoogleScholarGoogle Scholar | 1:CAS:528:DC%2BD2cXms1ynsg%3D%3D&md5=290904bbc196d88888c85a8cd69689b7CAS |
[8] K. Brunner, J. A. E. H. van Haare, B. M. W. Langeveld-Voss, H. F. M. Schoo, J. W. Hofstraat, A. van Dijken, J. Phys. Chem. B 2002, 106, 6834.
| Crossref | GoogleScholarGoogle Scholar | 1:CAS:528:DC%2BD38XksVKntrY%3D&md5=469a9696c18ee6c950ed88ce06812c9eCAS |
[9] P. Haring Bolivar, C. Wegmann, R. Kersting, M. Deussen, U. Lemmer, R. F. Mahrt, H. Bässler, E. O. Göbel, H. Kurz, Chem. Phys. Lett. 1995, 245, 534.
| Crossref | GoogleScholarGoogle Scholar | 1:CAS:528:DyaK2MXptlCnt7Y%3D&md5=aa565a77ccff62d92408337987875702CAS |
[10] E. A. McArthur, K. B. Eisenthal, J. Am. Chem. Soc. 2006, 128, 1068.
| Crossref | GoogleScholarGoogle Scholar | 1:CAS:528:DC%2BD28XitV2nuw%3D%3D&md5=5dee46c25ff1abf1fe0ee59ef06d279fCAS | 16433510PubMed |
[11] Y. Rao, M. Xu, S. Jockusch, N. J. Turro, K. B. Eisenthal, Chem. Phys. Lett. 2012, 544, 1.
| Crossref | GoogleScholarGoogle Scholar | 1:CAS:528:DC%2BC38XhtFOkt7bO&md5=95d60663d8f44b6f6493c8a8759731f0CAS |
[12] X. Shang, K. Nguyen, Y. Rao, K. B. Eisenthal, J. Phys. Chem. C 2008, 112, 20375.
| Crossref | GoogleScholarGoogle Scholar | 1:CAS:528:DC%2BD1cXhsVKisLvF&md5=afc62a6b9353bf8859f53a709af4c2d3CAS |
[13] J. A. Organero, L. Tormo, M. Sanz, A. Roshal, A. Douhal, J. Photochem. Photobiol. Chem. 2007, 188, 74.
| Crossref | GoogleScholarGoogle Scholar | 1:CAS:528:DC%2BD2sXjs1Cmurc%3D&md5=4c5bc42fa2777a9261c89bc366ab1677CAS |
[14] A. Wu, Q. Chen, K. Xia, T. Hou, X. Shen, H. Gao, X. Xu, J. Photochem. Photobiol. Chem. 2006, 182, 174.
| Crossref | GoogleScholarGoogle Scholar | 1:CAS:528:DC%2BD28Xnt1Kksrg%3D&md5=e20742aa832414ea39dc1561815225d8CAS |
[15] A. Wu, X. Shen, H. Gao, J. Photochem. Photobiol. Chem. 2007, 185, 144.
| Crossref | GoogleScholarGoogle Scholar | 1:CAS:528:DC%2BD2sXhtFeh&md5=75cd594cf28ea4f8537724718dac98a1CAS |
[16] I. V. M. V. Enoch, S. Yousuf, J. Solution Chem. 2013, 42, 470.
| Crossref | GoogleScholarGoogle Scholar | 1:CAS:528:DC%2BC3sXjtlWmtro%3D&md5=9367703cb558ee50f79e8c55b3d87924CAS |
[17] I. V. M. V. Enoch, M. Swaminathan, J. Incl. Phenom. Macrocycl. Chem. 2005, 53, 149.
| Crossref | GoogleScholarGoogle Scholar | 1:CAS:528:DC%2BD28XmtlOjtrk%3D&md5=0de3a1f4c5c1b890117029ccda84fe46CAS |
[18] I. V. M. V. Enoch, M. Swaminathan, J. Lumin. 2007, 127, 713.
| Crossref | GoogleScholarGoogle Scholar | 1:CAS:528:DC%2BD2sXptFyksbY%3D&md5=48a85bec38b7b6e75b8a43c728577cfcCAS |
[19] S. Agarwal, D. K. Jangir, R. Mehrotra, J. Photochem. Photobiol. B 2013, 120, 177.
| Crossref | GoogleScholarGoogle Scholar | 1:CAS:528:DC%2BC3sXks1Sns78%3D&md5=7a8c486191fd7b15ea45b2e288934413CAS | 23266050PubMed |
[20] G. Zhang, X. Hu, P. Fu, J. Photochem. Photobiol. B 2012, 108, 53.
| Crossref | GoogleScholarGoogle Scholar | 1:CAS:528:DC%2BC38XhvVCnt7s%3D&md5=d3cae5d3eed112087d4656fa514b52d1CAS | 22245468PubMed |
[21] A. Wenting, G. Xiliang, S. Shaomin, D. Chuan, J. Photochem. Photobiol. Chem. 2005, 173, 36.
| Crossref | GoogleScholarGoogle Scholar |
[22] I. V. M. V. Enoch, M. Swaminathan, J. Fluoresc. 2006, 16, 501.
| Crossref | GoogleScholarGoogle Scholar | 1:CAS:528:DC%2BD28XmvFShtLs%3D&md5=9aaa897f755a3465f3b4b2056b19818bCAS |
[23] S. Yousuf, I. V. M. V. Enoch, AAPS PharmSciTech 2013, 14, 770.
| Crossref | GoogleScholarGoogle Scholar | 1:CAS:528:DC%2BC3sXosFyis74%3D&md5=488666c5b287595c569eb95ee2a86c10CAS | 23625651PubMed |
[24] Y. Lu, G.-K. Wang, J. Lv, G.-S. Zhang, Q.-F. Liu, J. Fluoresc. 2011, 21, 409.
| Crossref | GoogleScholarGoogle Scholar | 1:CAS:528:DC%2BC3MXhtlehs78%3D&md5=29672e47b7e608337cdc499dd6037560CAS | 20953826PubMed |
[25] H. J. Bernstein, RasMol 2.7.5.2 2011. Molecular graphics visualisation tool based on RasMol 2.6 by Roger Sayle, Biomolecular Structures Group, Glaxo Welcome Research & Development, Stevenage, Hertfordshire, UK.
[26] J. R. Lakowicz, Principles of Fluorescence Spectroscopy, 3rd edn 2000 (Springer: Singapore).
[27] A. A. Ensafi, R. Hajian, S. Ebrahimi, J. Braz. Chem. Soc. 2009, 20, 266.
| Crossref | GoogleScholarGoogle Scholar | 1:CAS:528:DC%2BD1MXjtVyqtrw%3D&md5=39fc0fd5ee7903a74c1db315fae4b2e8CAS |
[28] J. K. Barton, J. M. Goldberg, C. V. Kumar, N. J. Turro, J. Am. Chem. Soc. 1986, 108, 2081.
| Crossref | GoogleScholarGoogle Scholar | 1:CAS:528:DyaL28XhsVGjs7w%3D&md5=affedb9d4dc22e74fbf96f0c253302b5CAS |