

Hydrological and water-use efficiency implications of geomorphological stratification in palæochannels in the Northern Murray–Darling Basin
C. P. Vanags A C and R. W. Vervoort B CA School for Science and Math, Vanderbilt University, Tennessee 37206, USA.
B Hydrology and Geo-Information Sciences Laboratory, Faculty of Agriculture and Environment, The University of Sydney, NSW 2006, Australia.
C Corresponding authors. Emails: willem.vervoort@sydney.edu.au; chris.vanags@vanderbilt.edu
Crop and Pasture Science 64(12) 1182-1194 https://doi.org/10.1071/CP13168
Submitted: 13 May 2013 Accepted: 13 September 2013 Published: 11 November 2013
Journal Compilation © CSIRO Publishing 2013 Open Access CC BY-NC-ND
Abstract
Regional climactic variability coupled with an increasing demand on water has placed an even greater pressure on managers to understand the complex relationships between surface water and groundwater in the Murray–Darling Basin. Based on limited soil sampling combined with geophysical observations, past research has suggested that relic subsurface drainage features (also known as palæochannels) have a higher risk of deep drainage and lateral flow, particularly where water is impounded or applied as irrigation. The aim of this study was to investigate the hydrological behaviour of an irrigated 25-ha site in North-western New South Wales in more detail to predict deep drainage risk in the presence of palæochannel systems. Several years of direct and indirect observations, including soil sampling and groundwater measures, were collected. Coupling the field data with one- and two-dimensional water balance models revealed a more complex behaviour where a palæochannel functions like a large underground drain. In contrast to other studies, this study suggests that the actual palæochannel does not pose a higher drainage risk, but the combination of the palæochannels with the surroundings soils does have a higher deep drainage risk.
Additional keywords: deep drainage risk, groundwater, palæochannel, soil data, water balance modelling.
Introduction
The agriculture-dominated floodplains of the Murray–Darling Basin (MDB) in Southeast Australia are an important part of the Australian economy, contributing (39%) of the gross value of Australian agriculture (ABS 2008). This fertile landscape, consisting mainly of heavy clay soils is ideally suited for agriculture, but it is intersected by abandoned stream or river beds, commonly referred to as palæochannels (Stannard and Kelly 1968; Wray 2009). These structures occur throughout the MDB and are commonly associated with active floodplains, but mostly occur in low-lying landscapes.
Because of limited surface expression, and management simplification, smaller palæochannels are commonly incorporated into large irrigated cotton fields, which, in Australia, often rely on the use of traditional furrow-irrigation techniques. In this hydrological regime, these features are thought to pose a high risk of deep drainage (Triantafilis et al. 2003), and therefore can have low irrigation water-use efficiency. Movement of related agrochemicals and nutrients (Yoder et al. 2001) and rising local saline groundwater (Timms et al. 2001) can further exacerbate environmental issues and lead to long-term negative consequences (Willis et al. 1997).
Severe drought conditions in the MDB between 2001 and 2009 have brought issues about the fate and transport of water and salts through the vadose zone to the fore (Quiggin et al. 2010). Recent studies have therefore tried to elucidate the effects of crop rotation (Hulugalle et al. 2012; Weaver et al. 2013), irrigation methods and timing (Gunawardena et al. 2011; Ringrose-Voase and Nadelko 2011) land-use patterns (Silburn et al. 2011; Tolmie et al. 2011) and regional hydrogeology (Acworth and Timms 2009) on these water and salt flows. Therefore, of particular interest to this study are: (i) what are the specific contrasting biophysical and hydraulic properties that make palæochannels potential risk zones for irrigation management; and (ii) what management strategy is needed to maximise irrigation resources and minimise ecological impact.
Despite the potential loss of water resources and the related long-term impacts on water quality, there have been few efforts to characterise and quantitatively assess the hydrological characteristics and behaviour of palæochannels in more detail. Older work in Eastern Australia has mainly concentrated on larger channels and primarily on the soil properties or stratigraphy from a geomorphological perspective (Stannard and Kelly 1968; Page et al. 1996; Rogers et al. 2002; Young et al. 2002; Wray 2009). These studies are a good initial step in developing a working model of these structures, but are currently lacking in the practical implications of the features, which requires a full hydrological characterisation of palæochannels (Vervoort and Annen 2006). An important development was the use of rapid inference methods, which allowed the development of hazard and risk maps (Triantafilis et al. 2003, 2004). However, these methods depend on a robust database of field biophysical property data, which is currently lacking in many remote agricultural settings.
Studies of irrigated Vertosols have shown that soil water pathways vary considerably under different moisture regimes (Willis et al. 1997) and land-use practices (Silburn et al. 2011). As such, numerous models have been suggested to explain the resulting hydrological response as a function of environmental conditions. Whereas bypass flow dominates during drier conditions, once wet, the soil swells and reduces further water infiltration (Smedema 1984; Timms et al. 2001). This effect is particularly pronounced in flood-irrigated fields where seasonal moisture regimes can significantly change infiltration rates (Gunawardena et al. 2011). Conversely, where coarser materials and kaolinitic clays are found as inclusions in the landscape, micropore-dominated flux is thought to occur, regardless of moisture content (Larsson and Jarvis 1999).
Abrupt changes in the subsurface sediments can complicate these models. It has been suggested that when infiltrating water encounters coarse-textured materials at depth, it may preferentially flow into a coarse-textured palæochannel under saturated conditions, or around the channel under unsaturated conditions due to the low potential in the coarse sands (Hendrickx et al. 2003). If infiltrating water enters the palæochannel, it is assumed that the channel will carry the water down gradient after it reaches saturated conditions (Fetter 2001). Due to variable connectedness to present water courses, a nearby watercourse may or may not receive this water in the process (Sophocleous 1991; Rogers et al. 2002).
Based on the literature and the earlier work on palæochannels (Triantafilis et al. 2003, 2004; Vervoort and Annen 2006; Woodforth et al. 2012) we hypothesised that palæochannel areas would pose a deep drainage risk and would limit water-use efficiency in irrigated fields. Based on this information, this paper aims to describe the measured physical and hydraulic characteristics of a small palæochannel system adjacent to a previous study by Vervoort and Annen (2006) and Triantafilis et al. (2003) and simulate how these features impact deep drainage risk and water-use efficiency under irrigated agriculture.
Methods
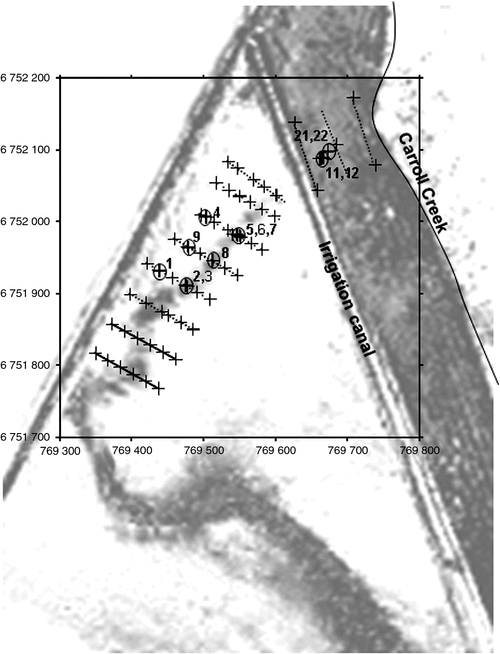
The field study site is located in Northern New South Wales on an irrigated cotton farm located on the floodplain of the Gwydir River. The 25-ha site consists of cropped and uncropped land, including the northern half of an irrigated cotton paddock and an additional 5 ha of land on the floodplain of Carroll Creek, which forms the north-east boundary of the site (Fig. 1). On average, the site receives 585 mm of summer-dominated rainfall with potential evapotranspiration ranging from 9.7 mm day–1 in December to 2.3 mm day–1 in July. Depending on rainfall and potential crop yield, annual irrigation amounts have varied between no irrigation to ~10 ML ha–1.
|
The site is mostly overlain by black Vertosols, with uniform (smectitic) clay contents down several metres. These aeolian and alluvial sediments were derived from the nearby basaltic Nandewar Range and are thought to have weathered in situ (Stannard and Kelly 1968; Young et al. 2002). Several paddocks on this farm have shown irregularities in irrigation efficiency, which appear to be due to the presence of coarse textured palæochannels throughout the farm (Huckel 2001; Triantafilis et al. 2003; Vervoort and Annen 2006), which are thought to have been abandoned late in the Quaternary (Young et al. 2002; Wray 2009).
Soil sampling
Soil samples were collected to characterise the topsoil and deeper sediments inside and outside the irrigated paddock. Fifty-six locations were cored to 1.5 m and sampled at 50-cm intervals. Additionally, six locations were cored to 9 m and subsampled every 15 cm using a split spoon corer. Two 6-m holes and two 20-m holes were later sampled at 50-cm intervals using a 10-cm rotary drill in the native vegetation between the field and the creek (Fig. 1).
Particle size analysis was performed for each soil sample using the pipette method (Gee and Bauder 1986). The electrical conductivity (EC) and pH of each sample was determined using a 1 : 5 soil to water suspension (Raymond and Higginson 1992). Both measurements were made from the same suspension using calibrated electrodes. Soluble chloride was extracted using a different 1 : 5 soil to water suspension. After spinning the sample at 20 000 rpm for 20 min to settle the soil colloids, the sample was decanted. The extract was then mixed with mercuric thiocyanate and analysed colourmetrically using a FOSS FIAstar 5000 (Hillerød, Denmark) flow injection analyser (ESS Method 140.4).
Additionally, intact samples from the split spoon cores were used to calculate bulk densities (ρb), which allowed for an estimation of the specific yield (γs) using:

where, ρs is the particle density, estimated at 2.65 g cm–3, and θfc is the water content at field capacity, estimated at –10 kPa using pedotransfer functions (Minasny and McBratney 2003).
Hydrological investigation
In 2004, six piezometers were installed in the field and four additional piezometers were installed between the field and the nearby creek by the Department of Natural Resources (New South Wales) (Fig. 1). Of the six in the field, four piezometers were installed within and below the palæochannel sediments [locations (piezos) 2 and 5 at 9-m depth and locations 3 and 6 at 6-m depth, respectively], as a nested set at two locations. As a result, soil samples for piezos 2 and 3 and piezos 5 and 6 overlap. Two further piezometers (locations 1 and 4) were installed outside the palæochannel sediments (at 9-m depth). These initial six piezometers (hereafter named piezo 1–6) were instrumented using pressure transducers, which measured water heights up to 5 m.
Slug and pump tests were used to directly measure aquifer transmissivity based on hydraulic conductivity and aquifer thickness. In December 2004, slug tests were performed on piezometer 5 and 6 using ~10 L of water for the slug. The pressure transducers were used to measure the fall in head at 1-min intervals for the duration of the test.
The Hvorslev method (Fetter 2001) was used to predict hydraulic conductivity Ks from the water level recessions measured in some of the piezometers based on the assumption that the piezometers were placed in unconfined aquifers with a water table that penetrates the well screen.

Here, r is the radius of the well casing, R is the radius of the well screen, (which in our case equals r), Le is the length of the screened interval, and t37 is the time for the well to recover to 37% of its initial changed state.
Soil water crop modelling
To quantify the water balance in these systems in more detail a one-dimensional (1-D) SWAP model (Kroes et al. 2008) was used to simulate typical crop management and rotations in the area. In the model analysis, we were particularly interested in two things:
-
How the different estimates of hydraulic conductivities that were derived from the groundwater and soil affected the simulated deep drainage estimates.
-
How the differences in hydraulic properties between palæochannel and non-palæochannel sediments impact the water-use efficiency and deep drainage.
To help validate the model simulations, recharge was estimated from water level rises in the piezometers using the specific yield method:

where, Re is the estimated recharge, γ is the estimate specific yield and dH/dt represents the rise in the water level (H) in the piezometer over time t. This method can provide a lower range estimate of actual recharge as some of the recharge can become lateral flow from a point source (Glendenning and Vervoort 2010). The recharge estimates were compared with the calculated drainage from the bottom of the profiles in the 1-D modelling.
All simulations were performed using 1996–2007 climate data to overlap with the field research. The system was modelled as a simple 1-D soil column down to 4 m, with a constant groundwater table at 6 m as was consistent with field observations. As such, lateral flow in the channel was assumed to be sufficient to maintain a constant groundwater level, even with drainage inputs. Based on long-term field observations this case was unlikely (as demonstrated later), so a second scenario was developed to test the effects of a fixed groundwater table on drainage. The sampled soil profile data was lumped into six soil layers: (0–30, 30–60, 60–100, 100–200, 200–300 and 300–400 cm). The soil data was subsequently split into locations sampled within the palæochannel and outside the surface expression of the palæochannel (channel and no channel). For this simulation, hydraulic conductivity was estimated using slug tests and piezometer data and pedotransfer functions based on the program Neurotheta (Minasny and McBratney 2003) were used to derive the water retention curve for SWAP analysis.
We have spatially sampled the palæochannel and other sediments, and have aggregated these observations into two 1-D locations in the model (palæochannel and no channel). To capture this spatial variation into the 1-D model, 50 simulations were run at each location, which randomly sampled the hydraulic properties from the different depth increments in the field data. In some cases there were many samples for a depth increment, but generally less than 50, while in other situations there were very limited samples for a depth increment (3 was the minimum). By repeating the random allocation 50 times, all most probable sequences were modelled and thus the overall variability of hydraulic parameters was analysed for both the palæochannel and no-channel locations.
Dryland wheat and an irrigated continuous cotton rotation were used to define crops in order to cover all extremes. For both strategies a sequence of 2 years of crops and one year fallow was defined within the 10 years of the simulation. A ponding depth of 50 mm was allowed in the irrigation scenario. Surface irrigation, which is common in the area, was based on the soil water deficit where irrigation was applied when the soil water deficit reached half of the total available water in the profile. The amount of irrigation applied filled the soil back up to field capacity and over irrigated 10 mm per irrigation. The extra 10 mm is because some over irrigation is generally needed due to spatial variation of properties across an irrigation field. This scenario simulates a careful irrigation strategy based on using soil moisture information. This method does not include rainfall forecasts and therefore tends to overestimate applied irrigation, as a rational irrigator would include forecasts in the irrigation decision. In some cases, irrigation could be applied before a rainfall event, causing runoff and deep drainage. However, this same problem occurs for both the palæochannel and no-channel simulations.
Two-dimensional modelling
Because lateral flow and the spatial arrangement of the sediments in the field can affect the estimates of the 1-D model, a two-dimensional model (2-D) was parameterised to represent a cross-section of the palæochannel and irrigated field system. The model VS2Di (Hsieh et al. 2000) was used to simulate a short-term irrigation scenario (5 days). The model consisted of a topsoil and subsoil layer, followed by a lower sediment layer in the palæochannel and a layer below the palæochannel (see Supplementary figures S2 as available on the journal’s website). The overall system was a bit smaller than the field observations, where the main palæochannel sediments were simulated between 2-m depth and ending at 3.5-m depth. The soil properties for the different layers were based on the average values of the field data for the different depths (Supplementary Table S2) with average specific yield values derived from the field data (Table 2). The bottom boundary was set at a 6-m-deep water table and initial conditions were based on an equilibrium profile for this depth with a minimum soil water potential of –30 kPa. The groundwater table was fixed, as the results from the 1-D modelling (discussed later) suggested that varying the groundwater table would only change the magnitude of the effect rather than fundamentally changing the flow behaviour.
Three separate stress periods were defined for the model:
-
– a warm-up, drainage period of 24 h, in which the top boundary was a no-flow boundary, this period was excluded from the results;
-
– followed by an irrigation period of 12 h in which the top boundary was set to 10 mm of pressure (water); and
-
– finally an evaporation transpiration period of 96 h, where the top boundary was defined as a simplified plant transpiring down to 1.2-m root depth with a potential ET of 5 mm day–1.
Results
Within the results, the term palæochannel is used for the area in the field in which the presence of such a feature was directly observed through coring or inferred from the aerial photograph. This term is sometimes shortened to channel. In contrast the surrounding area is designated as no channel where uniform clay-rich deposits were directly observed down to 6 m. The term topsoil is used to refer to the top 1.5 m of the solum over the entire field, while the term regolith is reserved to the area below 1.5-m depth.
Pedology and stratigraphy
Based on soil cores from the areas outside of the managed paddock, the topsoils found in this site can be classified as black Vertosols, or red Vertosols (above the palæochannel). The soil appears to be self-mulching, with moderate to firm subangular blocky structure throughout the solum. Shrink-swell characteristics are also evident with large cracks developing in the dried profile (including the soil above the palæochannel) (Table S1).
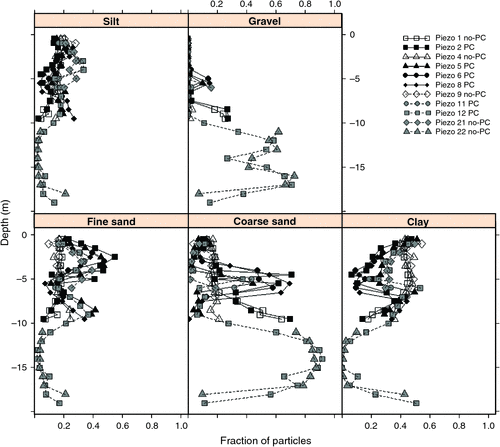
The key difference between the samples from the surrounding Vertosol deposit and the samples from the bore holes in the palæochannel system is the sharp increase in sand (Fig. 2) between 2- and 6-m depth, very similar to the system found nearby (Vervoort and Annen 2006) (Figure S1). We therefore believe that this is the main palæochannel deposit. Geomorphic features such as gravel pockets, sand stringers, and clay lenses occur throughout the palæochannel deposit, with the deposits vary in thickness from 1 to 5 cm. In general, the sand stringers and clay lenses appear well sorted, unlike the bulk of the palæochannel deposit, which is highly mixed. The exception is the coarse sand and gravel deposit between 2 and 4.2 m in piezometer 2 (Fig. 2), which is relatively well sorted.
|
In general, soil textures inside (2–6 m) and below (6–9 m) the palæochannel range from sandy loam to gravely coarse sandy clay, while outside the palæochannel, textures are predominantly clay. Although the clay content abruptly decreases above the palæochannel (Fig. 2), there is a considerable amount of variability in clay content due to the channel stratigraphy (such as the inclusion of small-scale clay lenses and sand stringers). In the main palæochannel deposit, clay content ranges from 0.06 to 0.39 g g–1 and increases along the length of the deposit from piezometer 2 (with an average of 0.23 g g–1) towards Carroll Creek in piezometer 12 (0.34 g g–1) (Fig. 2). Compared with the surrounding Vertosols, there is significantly less clay inside the palæochannel (Table 1), and significantly more fine and coarse sand. We also inferred from the samples that a 1–2-m-thick deposit of fine sand conformably overlies the coarse sand in the channel and also extends several metres to either side (Fig. 2) (see also Vervoort and Annen 2006).

|
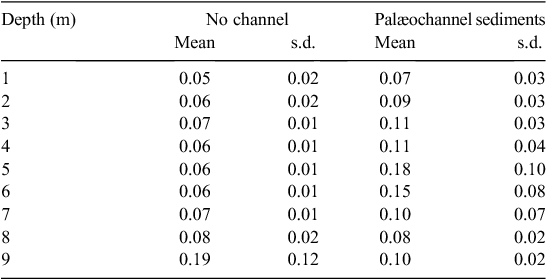
As a result of these differences, specific yield values also differed between the palæochannel sediments and the surrounding areas (Table 2). The largest differences in specific yield occurred around the fine and coarse sand regolith (3–6 m), but based on the calculated standard deviations in the palæochannel sediments, these differences are not considered statistically significant.
|
A coarse gravel deposit underlies much of the site at 9 m below the surface, which is best observable in drill holes 21 and 22 outside the irrigated paddock (Fig. 2). This gravel is thought to be the top of the Narrabri formation, an unconfined aquifer which extends through much of the Gwydir and Namoi Valleys (Young et al. 2002; Vervoort and Annen 2006). The 20-m cores taken outside the paddock show that this deposit is ~7 m thick and rests on top of heavy clays (Fig. 2).
Pedogenic features appear throughout the profiles and are mostly comprised of calcium (and possibly sodium) carbonates and, to a lesser extent, gypsum nodules. These features are assumed to be pedogenic, due to their dull white colour and crumbly texture (Booltink et al. 1988). In most profiles, the nodules appear below 1 m and do not appear to be correlated with the presence of the palæochannel.
A reduced clay layer exists beneath the palæochannel, which contains coarse gravel and oxidised nodules. A similar deposit occurs in several bore holes outside of the channel at 5–6 m (i.e. at piezometer 1), but the deposit is not as reduced and lacks the oxidised nodules found below the channel. Similar to most sands found outside the palæochannel, the fine sand found in this deposit lacks iron oxide coatings.
Transient soil chemical properties
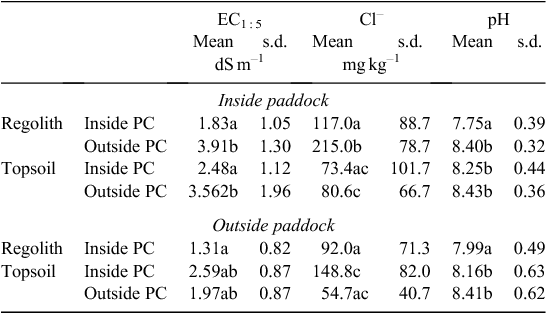
The field samples show clear changes in EC1 : 5 across the topsoil and with depth. The topsoil samples above the palæochannel are significantly less conductive than the rest of the topsoil samples within the paddock. There is also a general increase in the topsoil EC1 : 5 to the north-west (down slope) of the palæochannel (data not shown). In the area of natural vegetation, the topsoil samples indicate a reversed trend, with the samples within the palæochannel being more conductive than those outside (Table 3). In the deep cores, the sediments inside the channel in the paddock had significantly lower EC1 : 5 values than those outside the channel (Table 3).
|
Unlike other soil properties, the Cl content is not significantly different in the topsoil overlying the palæochannel compared with the rest of the paddock or inside versus outside the paddock (Table 3). In the deep cores, there is significantly less Cl inside the palæochannel compared with outside the channel (Table 3).
The topsoil pH ranges from 7.2 to 9.2, with significantly lower values associated with the soil overlying and in the palæochannel (Table 3), which is probably due to differences in depositional history and oxidation and reduction history. There is no significant difference between the sediments inside and outside the paddock. Several values are above the solubility product of calcium carbonate (8.4), which could indicate the presence of sodium bicarbonate due to excess sodium in the profile. The majority of the high pH values occur ~1–1.5 m below the soil surface coinciding with the presence of calcium carbonate nodules.
Groundwater measurements
Monitoring of the water table inside and below the palæochannel indicated perched water tables occurring intermittently in all the regolith corresponding to rainfall and irrigation events, in agreement with prior qualitative observations in a previous study (Vervoort and Annen 2006) (Fig. 3). Due to field operations only limited groundwater data were recorded. Continuous data were collected in 2005–06 during the irrigation season, but in 2006–07 only some of the piezometers gave reasonable data (Fig. 3). The hydrological response to the irrigation and rainfall events was almost immediate, with large pulses of water raising the water table up to 1.5 m. However, the recession was different between piezometers and this is attributed to the Ks of the surrounding sediments. For example, in the palæochannel deposit, water levels quickly fell over the course of a couple hours (not visible in the average daily data). In contrast, water levels in the piezometers below the channel fell much slower, taking several days to reach the level before the event.
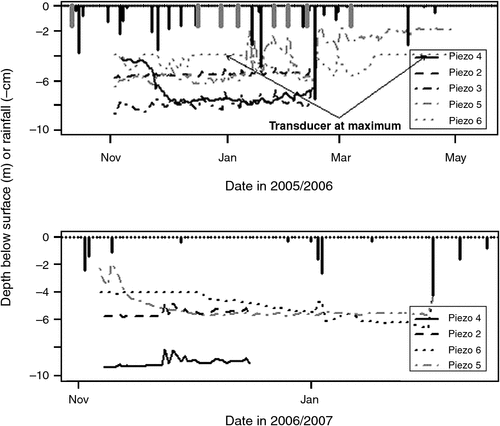
|
Outside the palæochannel, the responses to rainfall and irrigation events were even more subdued. Heavy rainfall events in the absence of irrigation also created a clear response in 2006–07 (Fig. 3). Piezometers close to the irrigation channel appear to respond quicker to rainfall than piezometers further away from the irrigation channel. This is most likely due to the combined effect of rainfall and water in the irrigation channel with some of the transducers reaching their maximum range (Fig. 3).
Based on slug tests, the Ks in the palæochannel deposit was estimated at 49.8 mm day–1 (piezometer 6), while the sediment below the palæochannel had a lower Ks of 5.5 mm day–1 (piezometer 5) (Table 4).
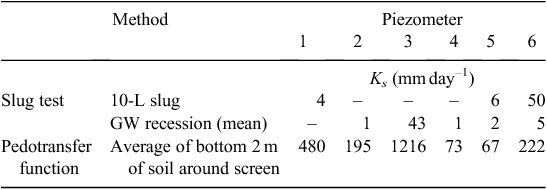
|
The Horslev analysis of the recession leg of the piezometer hydrographs estimated the average Ks of the sediments below the palæochannel at 9 mm day–1 with a coefficient of variation of 5.5 from the six events used for the prediction (Table 4). Only one event was available to make a prediction in the piezometers outside the palæochannel resulting in a Ks of 4 mm day–1.
Inside the palæochannel a much higher Ks of 43.4 mm day–1 was predicted. This prediction varied from 36.7 to 74.2 mm day–1 from the four events used, with a coefficient of variation of 0.23. Throughout the irrigation season in 2005, the water table slowly rose by ~0.25 m month–1 in the deeper piezometers (2 and 4) below and outside the palæochannel (Fig. 5). This was not the case inside the palæochannel (piezometer 3), where the periodic water table rises receded within 24 h.
In contrast to the field tests, the pedotransfer functions predicted much greater Ks values and indicate only slight differences between the palæochannel and the rest of the sediments, taking into account the standard deviations. The pedotransfer functions in Neurotheta and particularly for Vertosols (Vervoort et al. 2003, 2006) are biased towards surface soils, and this means that the functions do not take into account overburden pressure (Philip 1969; Talsma 1977). This means that the pedotransfer functions probably over predict the true hydraulic conductivities in the regolith. This difference may affect the absolute values of some of the water balance components in the simulation results; however, it should not affect the difference between the modelled scenarios.
Water balance simulation results
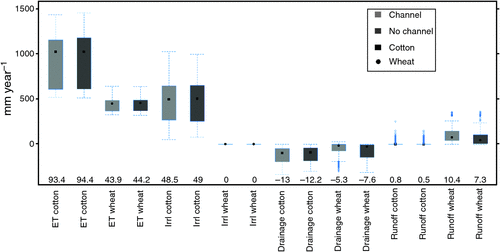
Throughout the simulated time period of 1996–2007, the average annual rainfall was 600.3 mm with a standard deviation of 166.5 mm. The lowest rainfall was 277.4 mm, while the highest was 847.4 mm. The overall average annual water balance results from the simulations indicated that there was little difference between the palæochannel and no-channel sites. This indicates that, in the simulations, the local variability in hydraulic properties introduces more variation in the water balance than the differences between palæochannel or no-channel soil properties.
The model output further suggests that the channel site required slightly more irrigation and generated slightly more runoff in the dryland scenario (Fig. 4), which agrees with local farm management observations. Finally, the model output suggests that on the average there is little difference in the deep drainage between the two crop systems trialled in the simulations, with the main water balance differences in ET and runoff. In contrast to other research (Petheram et al. 2002), the local variation in hydraulic properties creates greater variation in the deep drainage then the crop system.
|
|
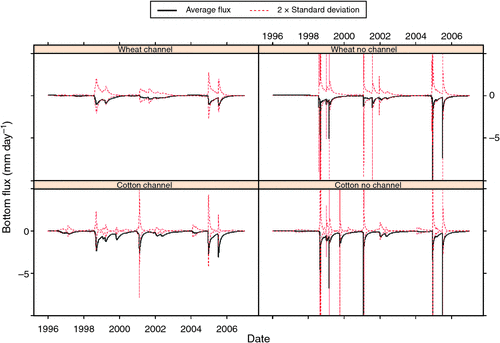
Disaggregating the simulated drainage annual values into daily values reveals that the locations outside the palæochannel indicate much higher variation and higher daily simulated drainages values than the locations inside the palæochannel (Fig. 5).
By examining depths of the initial water table, from 4 down to 8 m in 1-m increments, a logical sequence is presented where upward fluxes increase with shallower water tables and downward fluxes also increase (as on average now the soil is wetter as a result of the upward fluxes). More importantly, the difference in simulated drainage values between the palæochannel and no-channel locations (Fig. 5) did not change. Furthermore, investigating the simulated saturation (defined as the water content/saturated water content) at different depths in the profile (Fig. 6), it can be observed that the palæochannel sediments below 2 m are in fact drier in the simulation than the no-channel sediments, which would slow down the deep drainage depending on the local hydraulic conductivity curve. This is likely reflected in the highly oxidised nature of the sediments above the palæochannel sediments giving rise to the redder hues observed in these deposits. There is some indication that the upper sediments in the palæochannel are slightly wetter in the simulation, but the difference is minor.
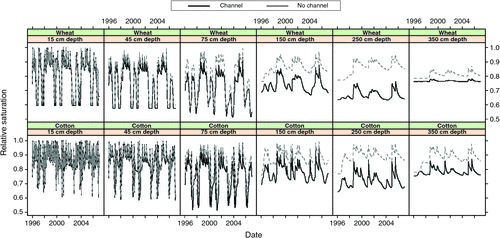
|
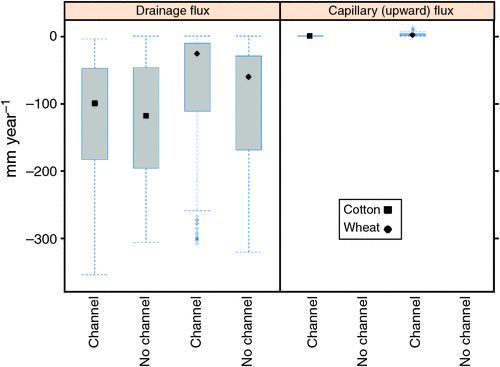
Of notable interest is that at 4-m depth (with a groundwater table at 6-m depth) predicted fluxes can be either positive or negative depending on the moisture regime (Fig. 7). Under wetter conditions, the flux is downward, but this switches to an upward flux under drier conditions. In general, predicted upward fluxes are very small and occur only in the palæochannel locations, while downward fluxes are larger (Fig. 7), specifically in the no-channel locations. Overall, given the hydraulic property variability there is no significant difference in the simulated drainage values, but it is clear that the distributions are much wider for the no-channel locations than for the palæochannel locations (Fig. 7).
|
These results point to a different hydrological behaviour than has been suggested so far in the literature. Based on direct observations from Stannard and Kelly (1968) several researchers (Triantafilis et al. 2003, 2004; Vervoort and Annen 2006), utilised geophysical data to suggest that the palæochannel sediments are high risks areas for deep drainage. It is possible that on the paddock scale, a field containing a palæochannel feature is less water efficient than surrounding fields, or back floodplain, sediments. However, in the simulations, the actual palæochannel sediments appear to have lower deep drainage losses (Fig. 7), but possibly higher irrigation requirements and higher runoff in dryland situations (Fig. 4).
This behaviour seems to be contradicted by the Cl and EC1 : 5 field data (Table 3), which indicates a typical decrease in Cl and EC1 : 5 in the palæochannel sediments relative to the surrounding sediments, which would also indicate these areas as having higher drainage (Triantafilis et al. 2003; Vervoort and Annen 2006). In contrast, the simulated behaviour suggests less drainage and thus less leaching in the channel locations, combined with more capillary upflow, which would lead to a higher concentration of salts in the palæochannel locations.
The predicted limited drainage also seems to contradict the piezometer responses observed during the field study (Fig. 3). Here, the piezometers placed in the palæochannel sediments responded more rapidly to the rainfall and irrigation events than the piezometers outside and below the palæochannel sediments, suggesting greater deep drainage.
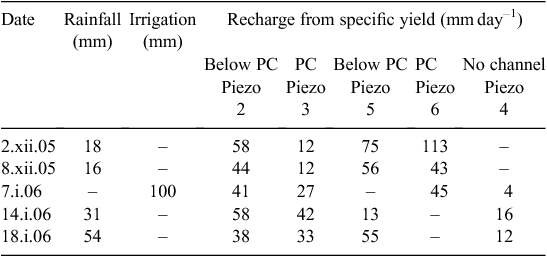
Moreover, the recharge estimates derived from the water level changes in the piezometers (Eqn 3) suggest that recharge generally exceeds the actual rainfall or irrigation amount in depth terms (mm). This either suggests that the derived specific yield values grossly overestimate the true specific yield, or that lateral flows influence the rise in the piezometer. This could also explain the lower EC values in the channel. Given the layout of the study field there are two obvious sources of lateral flow. The first is the irrigation channel running on the Carroll Creek side of the field (Fig. 1), which intersects the palæochannel sediments. Lateral flow from this irrigation channel could particularly influence the water table rises in piezometer 5 and 6 and less so in piezometer 2 and 3 (Fig. 1). The other possible source is lateral flow seeping from the clays surrounding the palæochannel.
2-D modelling results
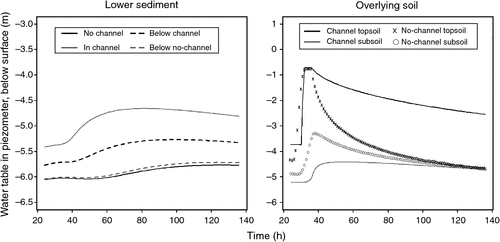
The results of the 2-D VS2Di simulations confirm the 1-D results from SWAP. In the topsoil (right-hand panel, Fig. 8) locations over the palæochannel tend to be wetter (the water levels in an imaginary simulated piezometer at this location are higher) compared with topsoil locations outside the channel, confirming the qualitative farm management observations.
|
Moving into the subsoil above the actual palæochannel sediments (0.5–2 m), the soil appears to be drier than the surrounding locations, leading to lower deep drainage losses. Based on this, there appears to be a drier soil buffer in the subsoil above the palæochannel, limiting water flow downwards (Hendrickx et al. 2003). This scenario can be explained by the higher fine sand content and lower clay content in the palæochannel sediments (locations 2, 3, 5, 6, 7 and 8 in Fig. 2), compared with the surrounding soil. The presence of this sand influences the hydraulic parameters related to the soil water characteristic more than Ks. As a result, during unsaturated flow, the sediments overlying the coarser palæochannel sediments have a lower unsaturated conductivity than the surrounding sediments. This is reversed under saturated conditions.
Based on the simulation with a 6-m water table in the palæochannel, the regolith remains saturated forming a raised water table up to 3-m depth above the 6-m-deep water table (Figure S4). This can be explained by the higher Ks of the coarser sediments relative to the surrounding and underlying sediments. The palæochannel therefore draws in water from the surrounding sediments and the imaginary piezometer in the palæochannel sediments responds more quickly than the piezometers outside and below the palæochannel (Fig. 8 left panel). The same response is seen in the field data (Fig. 3), which partly explains the higher recharge estimates from the specific yield method. In contrast to the situation in Glendenning and Vervoort (2010), where diverging lateral flow caused an underestimation, here the recharge is overestimated due to converging lateral flow.
Piezometer 5 and 6, closer to the irrigation channel, generally respond quicker (Fig. 3) and give greater recharge estimates (Table 5) than piezometer 2 and 3. This observation suggests that leakage from the irrigation channel also contributes to rising groundwater in the palæochannel.
|
As a result of the geomorphological layering of the sediments, water drains into and is stored locally in the palæochannel sediments. These sediments therefore act as a small underground aquifer (Young et al. 2002), but this seepage would bring in salts from the surrounding clays. However, because of the coarser saturated sediments, the palæochannel also acts as a conduit for lateral flow and salt and chemical transport in the landscape along the palæochannel gradient. The lower EC and Cl content of most of the palæochannel samples is then explained by the lateral flows along the channel, rather than the downward movement into the channel as suggested by earlier research (Triantafilis et al. 2003).
Summary and management implications
Based on the field and modelling a revised interpretation of the hydrological behaviour of palæochannels can be developed.
As has been described earlier, palæochannels are the remnants of streams (prior streams) from earlier periods. The layering in sediments observed in the regolith and topsoil in this study matches the picture of a waning stream with increasingly finer sediments going up towards the surface. The top of this deposit is conformably overlain by fine sand, which extends outside the palæochannel feature. This feature is similar to the original description by Stannard and Kelly (1968) and this was thought to be a result of regional aeolian activity on the leeward side of the channel. In this case, the original sediments have most likely been covered by a thin layer of more recent fine sediments originating from the periodic flooding of Carroll Creek. Mixing of the top 50 cm during agricultural operations has made the channel sediments visible on the aerial photograph (Fig. 1). Because of field operations (both the mixing of the topsoil sediment and the addition of a nearby irrigation channel) it is unclear how these structures would have behaved under natural conditions over the last 10 000 years. However, the ubiquitous presence of CaCO2 nodules inside and outside of the palæochannel is a possible indication that these soils were not hydrologically different following deposition of the overlying sediments as these pedogenic features require thousands of years to develop in areas with similar precipitation rates (Nordt et al. 1998).
The identification of palæochannels as conduits of shallow groundwater flow by previous studies holds true, meaning that management focusing on these channels as catchment-scale preferential flow paths is essential. In the observed geologic feature presented in this paper, the slightly coarser top soils overlying the palæochannel stay wetter and take in more water during irrigation events, making the areas less water efficient. However, the drier and coarser subsoil prevents this water from draining to the underlying palæochannel. As a result there is limited deep drainage from the soils just above the palæochannel, and this also means that the topsoil remains wetter. In drier periods, this could benefit the local crops.
In contrast, the surrounding soils and regolith drain more water and this flows laterally into the palæochannel. This is because the palæochannel operates as an efficient underground drain (Ritzema 1994). As a result the palæochannel increases deep drainage from the surrounding field by effectively draining the area. This means that the actual deep drainage impact of the palæochannel is much greater than the lighter coloured sediments observable in the field. Using Hooghoudt’s drainage formula (Ritzema 1994), assuming isotropic and homogeneous soils and a Ks value of 5 mm day–1, the actual distance away from the palæochannel that would drain towards it, ranges from 15 to 70 m. The variation is determined by assumptions about the daily recharge, with smaller recharge values being related to smaller distances from the palæochannel. Variations in hydraulic conductivity and layering of the soil would all affect these rough estimates (Ritzema 1994) but the general principle remains the same.
Overall this process results in a shallow perched water table in the palæochannel, which in this specific field study case is probably exacerbated by the lateral flow from the irrigation channel, which will eventually drain following the slope of the coarse palæochannel sediments.
There are two management issues that arise from this analysis. The first is the on-field management of water including the irrigation supply channel. Previous research would suggest that this needs to focus on the areas of lighter soil, which are difficult to manage in the landscape. However, this research shows that management of the overall water inputs to the field to manage drainage remains essential, rather than just focusing on the palæochannel sediments. From a farm management perspective this is generally easier. In the case of irrigation this could be accomplished by changing to lower input irrigation systems, such as overhead, trickle or drip systems (Gunawardena et al. 2011). In dryland situations, managing the water balance during fallow periods is essential, as these periods are recognised as the highest drainage periods for dryland cropping systems (Asseng et al. 2001).
The second issue is related to catchment-scale management of flows in palæochannels. Given that these landscape features operate as drainage systems for the landscape, the actual spatial flow pattern and possible water quality implications need to be managed. This means that the slope, connectivity and drainage pattern of the channels needs to be mapped and overall fluxes understood. The draining water also leaches and transports salts and possible agrochemicals as shown previously through geophysical investigation (Yoder et al. 2001) and direct sampling of soil water (Gunawardena et al. 2011; Weaver et al. 2013). Hydrologically, this means that palæochannels are preferential flow paths in the landscape possibly providing rapid fluxes of water and chemicals to the catchment outlet in the same way as in soil profiles (Flury et al. 1994). It is conceivable that over time, ecological groundwater-dependent communities have developed that rely on the water in these channels.
Conclusions
In contrast to earlier work on palæochannels, this research found that these locations have lower deep drainage than surrounding soils. However, because the palæochannel operates as a large agricultural drain, the overall recharge from a field containing such features is probably higher than without. In addition, because palæochannels are essentially preferential flow paths for water and associated salts and chemicals, both landscape-scale and field-scale management needs to be developed. For irrigated production, this means moving to a lower intensity irrigation system such as trickle, drip or overhead irrigation rather than furrow-based systems.
Acknowledgements
The authors would like to thank the staff at Auscott Ltd and particularly Messrs T. Richards and S. Boland, for their assistance in this study. This research was funded by the Cotton Catchment Communities CRC and its predecessor the Australian Cotton CRC under project no. 1.02.07, and further additional funding from the Gwydir-Border Rivers CMA. The first author, CV, was the recipient of an EIPR scholarship through the University of Sydney.
References
ABS (2008) ‘Water and the Murray–Darling Basin – a statistical profile, Australia 2000–06.’ (Australian Bureau of Statistics: Canberra)Acworth RI, Timms WA (2009) Evidence for connected water processes through smectite-dominated clays at Breeza, New South Wales. Australian Journal of Earth Sciences 56, 81–96.
| Evidence for connected water processes through smectite-dominated clays at Breeza, New South Wales.Crossref | GoogleScholarGoogle Scholar | 1:CAS:528:DC%2BD1MXkvVWks7c%3D&md5=56d5b6cf7cea4719a53fd3cbed373a07CAS |
Asseng S, Fillery IRP, Dunin FX, Keating BA, Meinke H (2001) Potential deep drainage under wheat crops in a Mediterranean climate. I. Temporal and spatial variability. Australian Journal of Agricultural Research 52, 45–56.
| Potential deep drainage under wheat crops in a Mediterranean climate. I. Temporal and spatial variability.Crossref | GoogleScholarGoogle Scholar |
Booltink HWG, van Breemen N, Bongers N, Waringa N, van Grinsven JJM, Dirksen C (1988) Automated in situ measurement of unsaturated soil water flux. Soil Science Society of America Journal 52, 1215–1218.
| Automated in situ measurement of unsaturated soil water flux.Crossref | GoogleScholarGoogle Scholar |
Fetter CW (2001) ‘Applied hydrogeology.’ 4th edn. (Prentice Hall: Upper Saddle River, NJ)
Flury M, Fluhler H, Jury WA, Leuenberger J (1994) Susceptibility of soils to preferential flow of water: a field study. Water Resources Research 30, 1945–1954.
| Susceptibility of soils to preferential flow of water: a field study.Crossref | GoogleScholarGoogle Scholar |
Gee GW, Bauder JW (1986) Particle size analysis. In ‘Methods of soil analysis. Part 1 – physical and mineralogical methods’. (Ed. A Klute) pp. 383–411. (American Soil Science Society: Madison, WI)
Glendenning CJ, Vervoort RW (2010) Hydrological impacts of rainwater harvesting (RWH) in a case study catchment: the Arvari River, Rajasthan, India. Part 1: field-scale impacts. Agricultural Water Management 98, 331–342.
| Hydrological impacts of rainwater harvesting (RWH) in a case study catchment: the Arvari River, Rajasthan, India. Part 1: field-scale impacts.Crossref | GoogleScholarGoogle Scholar |
Gunawardena TA, McGarry D, Robinson JB, Silburn DM (2011) Deep drainage through Vertosols in irrigated fields measured with drainage lysimeters. Soil Research 49, 343–354.
| Deep drainage through Vertosols in irrigated fields measured with drainage lysimeters.Crossref | GoogleScholarGoogle Scholar |
Hendrickx JMH, Phillips FM, Harrison JB (2003) Water flow processes in arid and semi-arid vadose zones. In ‘Understanding water in a dry environment’. (Ed. I Simmers) pp. 151–204. (A. A. Balkema Publishers: Lisse, The Netherlands)
Hsieh PA, Wingle W, Healy RW (2000) ‘VS2DI – a graphical software package for simulating fluid flow and solute or energy transport in variably saturated porous media.’ USGS, No. 99-4130. (USGS: Lakewood, CO)
Huckel AI (2001) Estimating clay content and deep drainage at the field scale in the lower Gwydir River Valley. MSc Agric. Thesis, The University of Sydney, NSW, Australia.
Hulugalle NR, Weaver TB, Finlay LA (2012) Soil water storage, drainage, and leaching in four irrigated cotton-based cropping systems sown in a Vertosol with subsoil sodicity. Soil Research 50, 652–663.
| Soil water storage, drainage, and leaching in four irrigated cotton-based cropping systems sown in a Vertosol with subsoil sodicity.Crossref | GoogleScholarGoogle Scholar |
Kroes JG, van Dam JC, Groenendijk P, Hendriks RFA, Jacobs CMJ (2008) ‘SWAP version 3.2: Theory description and user manual.’ Report No. 1649. (Alterra: Wageningen)
Larsson MH, Jarvis NJ (1999) Evaluation of a dual-porosity model to predict field-scale solute transport in a macroporous soil. Journal of Hydrology 215, 153–171.
| Evaluation of a dual-porosity model to predict field-scale solute transport in a macroporous soil.Crossref | GoogleScholarGoogle Scholar | 1:CAS:528:DyaK1MXhtFWmsbw%3D&md5=bdc7ea1d0690fb6945f270177fd32651CAS |
Minasny B, McBratney AB (2003) ‘NeuroTheta, pedotransfer function for predicting soil hydraulic properties for Australian soil.’ (Australian Centre for Precision Agriculture, The University of Sydney: Sydney, NSW)
Nordt LC, Hallmark CT, Wilding LP, Boutton TW (1998) Quantifying pedogenic carbonate accumulations using stable carbon isotopes. Geoderma 82, 115–136.
| Quantifying pedogenic carbonate accumulations using stable carbon isotopes.Crossref | GoogleScholarGoogle Scholar |
Page KJ, Nanson GC, Price D (1996) Chronology of Murrumbidgee river palaeochannels on the riverine plain southeastern Australia. Journal of Quaternary Science 11, 311–326.
| Chronology of Murrumbidgee river palaeochannels on the riverine plain southeastern Australia.Crossref | GoogleScholarGoogle Scholar |
Petheram C, Walker GR, Grayson RB, Thierfelder T, Zhang L (2002) Towards a framework for predicting impacts of land use on recharge: 1. A review of recharge studies in Australia. Australian Journal of Soil Research 40, 397–417.
| Towards a framework for predicting impacts of land use on recharge: 1. A review of recharge studies in Australia.Crossref | GoogleScholarGoogle Scholar |
Philip JR (1969) Hydrostatics and hydrodynamics in swelling soils. Water Resources Research 5, 1070–1077.
| Hydrostatics and hydrodynamics in swelling soils.Crossref | GoogleScholarGoogle Scholar |
Quiggin J, Adamson D, Chambers S, Schrobback P (2010) Climate change, uncertainty, and adaptation: the case of irrigated agriculture in the Murray–Darling Basin in Australia. Canadian Journal of Agricultural Economics 58, 531–554.
| Climate change, uncertainty, and adaptation: the case of irrigated agriculture in the Murray–Darling Basin in Australia.Crossref | GoogleScholarGoogle Scholar |
Raymond GE, Higginson FR (1992) ‘Australian laboratory handbook of soil and water chemical methods.’ (Inkata Press: Melbourne)
Ringrose-Voase A, Nadelko T (2011) Deep drainage in a Vertosol under irrigated cotton. In ‘Soil solutions for a changing world. Proceedings 19th World Congress of Soil Science’. (Eds R Gilkes, N Prakongkep) pp. 27–30. (ISSS: Brisbane)
Ritzema HP (Ed.) (1994) Subsurface flow to drains. In ‘Drainage principles and applications’. 2nd edn. Vol. 162. pp. 263–282. (ILRI: Wageningen)
Rogers MP, Christen EW, Khan S (2002) Aquifer identification and characterisation for salinity control by shallow groundwater pumping. CSIRO Land and Water, No. 16/02, Griffith, NSW.
Silburn DM, Tolmie PE, Biggs AJW, Whish JPM, French V (2011) Deep drainage rates of Grey Vertosols depend on land use in semi-arid subtropical regions of Queensland, Australia. Soil Research 49, 424–438.
| Deep drainage rates of Grey Vertosols depend on land use in semi-arid subtropical regions of Queensland, Australia.Crossref | GoogleScholarGoogle Scholar |
Smedema LK (1984) Furrow irrigation design for vertisols. Agricultural Water Management 9, 211–218.
| Furrow irrigation design for vertisols.Crossref | GoogleScholarGoogle Scholar |
Sophocleous MA (1991) Stream-floodwave propagation through the Great Bend alluvial aquifer, Kansas – field-measurements and numerical simulations. Journal of Hydrology 124, 207–228.
| Stream-floodwave propagation through the Great Bend alluvial aquifer, Kansas – field-measurements and numerical simulations.Crossref | GoogleScholarGoogle Scholar |
Stannard ME, Kelly ID (1968) ‘Irrigation potential of the Lower Gwydir Valley.’ (Water Conservation and Irrigation Commission: Sydney)
Talsma T (1977) Measurement of the overburden component of total potential in swelling field soils. Australian Journal of Soil Research 15, 95–102.
| Measurement of the overburden component of total potential in swelling field soils.Crossref | GoogleScholarGoogle Scholar |
Timms W, Acworth RI, Berhane D (2001) Shallow groundwater dynamics in smectite dominated clay on the Liverpool Plains of New South Wales. Australian Journal of Soil Research 39, 203–218.
| Shallow groundwater dynamics in smectite dominated clay on the Liverpool Plains of New South Wales.Crossref | GoogleScholarGoogle Scholar |
Tolmie PE, Silburn DM, Biggs AJW (2011) Deep drainage and soil salt loads in the Queensland Murray–Darling Basin using soil chloride: comparison of land uses. Soil Research 49, 408–423.
| Deep drainage and soil salt loads in the Queensland Murray–Darling Basin using soil chloride: comparison of land uses.Crossref | GoogleScholarGoogle Scholar |
Triantafilis J, Huckel AI, Odeh IOA (2003) Field-scale assessment of deep drainage risk. Irrigation Science 21, 183–192.
Triantafilis J, Odeh IOA, Jarman AL, Short MG, Kokkoris E (2004) Estimating and mapping deep drainage risk at the district level in the lower Gwydir and Macquarie valleys, Australia. Australian Journal of Experimental Agriculture 44, 893–912.
| Estimating and mapping deep drainage risk at the district level in the lower Gwydir and Macquarie valleys, Australia.Crossref | GoogleScholarGoogle Scholar |
Vervoort RW, Annen YL (2006) Palaeochannels in Northern New South Wales: inversion of electromagnetic induction data to infer hydrologically relevant stratigraphy. Australian Journal of Soil Research 44, 35–45.
| Palaeochannels in Northern New South Wales: inversion of electromagnetic induction data to infer hydrologically relevant stratigraphy.Crossref | GoogleScholarGoogle Scholar |
Vervoort RW, Cattle SR, Minasny B (2003) The hydrology of Vertosols used for cotton production: I Hydraulic, structural and fundamental soil properties. Australian Journal of Soil Research 41, 1255–1272.
| The hydrology of Vertosols used for cotton production: I Hydraulic, structural and fundamental soil properties.Crossref | GoogleScholarGoogle Scholar | 1:CAS:528:DC%2BD3sXpsFentLk%3D&md5=b378d0068e7e2c3c64a2ebf8383062adCAS |
Vervoort RW, Minasny B, Cattle SR (2006) The hydrology of Vertosols used for cotton production: II. Pedotransfer functions to predict hydraulic properties. Australian Journal of Soil Research 44, 479–486.
| The hydrology of Vertosols used for cotton production: II. Pedotransfer functions to predict hydraulic properties.Crossref | GoogleScholarGoogle Scholar |
Weaver TB, Hulugalle NR, Ghadiri H, Harden S (2013) Quality of drainage water under irrigated cotton in Vertisols of the Lower Namoi Valley, New South Wales, Australia. Irrigation and Drainage 62, 107–114.
| Quality of drainage water under irrigated cotton in Vertisols of the Lower Namoi Valley, New South Wales, Australia.Crossref | GoogleScholarGoogle Scholar |
Willis TM, Black AS, Meyer WS (1997) Estimates of deep percolation beneath cotton in the Macquarie valley. Irrigation Science 17, 141–150.
| Estimates of deep percolation beneath cotton in the Macquarie valley.Crossref | GoogleScholarGoogle Scholar |
Woodforth A, Triantafilis J, Cupitt J, Malik R, Subasinghe R, Ahmed M, Huckel A, Geering H (2012) Mapping estimated deep drainage in the lower Namoi Valley using a chloride mass balance model and EM34 data. Geophysics 77, WB245–WB256.
| Mapping estimated deep drainage in the lower Namoi Valley using a chloride mass balance model and EM34 data.Crossref | GoogleScholarGoogle Scholar |
Wray RAL (2009) Palaeochannels of the Namoi River Floodplain, New South Wales, Australia: the use of multispectral Landsat imagery to highlight a Late Quaternary change in fluvial regime. The Australian Geographer 40, 29–49.
| Palaeochannels of the Namoi River Floodplain, New South Wales, Australia: the use of multispectral Landsat imagery to highlight a Late Quaternary change in fluvial regime.Crossref | GoogleScholarGoogle Scholar |
Yoder RE, Freeland RS, Ammons JT, Leonard LL (2001) Mapping agricultural fields with GPR and EMI to identify offsite movement of agrochemicals. Journal of Applied Geophysics 47, 251–259.
| Mapping agricultural fields with GPR and EMI to identify offsite movement of agrochemicals.Crossref | GoogleScholarGoogle Scholar |
Young RW, Young ARM, Price DM, Wray RAL (2002) Geomorphology of the Namoi alluvial plain, northwestern New South Wales. Australian Journal of Earth Sciences 49, 509–523.
| Geomorphology of the Namoi alluvial plain, northwestern New South Wales.Crossref | GoogleScholarGoogle Scholar |