

Effects of long-term rotation and tillage practice on grain yield and protein of wheat and soil fertility on a Vertosol in a medium-rainfall temperate environment
R. D. Armstrong A C D , R. Perris A , M. Munn A , K. Dunsford A , F. Robertson B , G. J. Hollaway A and G. J. O’Leary AA Agriculture Victoria Research, Grains Innovation Park, Private Bag 260, Horsham, Vic. 3400, Australia.
B Agriculture Victoria Research, Australia.
C Department of Animal, Plant and Soil Sciences, Centre for AgriBioscience, La Trobe University, Bundoora, Vic. 3086, Australia.
D Corresponding author. Email: Roger.Armstrong@ecodev.vic.gov.au
Crop and Pasture Science 70(1) 1-15 https://doi.org/10.1071/CP17437
Submitted: 28 November 2017 Accepted: 29 October 2018 Published: 17 December 2018
Abstract
Fundamental changes in farming systems occurred throughout the medium-rainfall zone of southern Australia during the late 1990s. Pulse and canola crops replaced pastures and long-fallowing, and minimal-tillage practices were increasingly adopted. An experiment was established in 1998 to examine long-term effects of these changes on crop productivity and soil fertility. Nine rotation–tillage treatments based on 3- and 6-year cycles were compared by using wheat (Triticum aestivum) as a bioassay crop over 2001–17. Seasonal conditions during the study ranged from the Millennium Drought to the top rainfall decile.
Averaged across the 17 seasons, wheat yields were significantly lower in rotations based on continuous wheat (1.73 t/ha) or 3 years of perennial lucerne (Medicago sativa) (1.93 t/ha) and highest after traditional long-fallow (2.92 t/ha) or vetch (Vicia sativa) green manure (2.57 t/ha). Wheat yields following a pulse (2.23 t/ha) or canola (Brassica napus) (2.21 t/ha) were intermediate. Whereas rotation effects varied with seasonal rainfall, there was a long-term trend for relative yields in continuous wheat rotations to decline and those following a green manure or fallow to differ increasingly from other treatments. Compared across the same rotation (canola–wheat–pulse), average wheat yields under no-tillage (2.09 t/ha) were significant lower (P < 0.05) than under reduced (2.22 t/ha) and conventional (2.29 t/ha) tillage. By contrast, grain protein concentration increased with increasing proportion and type of legumes (green manure and pasture > pulse) in the rotation via their effect on soil mineral nitrogen (N). Lowest protein was recorded in continuous wheat and highest where at least one-third of the rotation contained a non-pulse legume, i.e. vetch green manure, lucerne or annual medic (Medicago truncatula). Soil-borne cereal fungal pathogens and nematodes generally had little effect on grain yields. Soil organic carbon (SOC) and total N stocks declined in all treatments over time, except in the lucerne and green manure treatments, where total N was maintained. Greatest declines in SOC and total N occurred in the fallow treatment.
Results from the first 20 years of experimentation suggest that differences in grain yield (and protein) of wheat were most likely the result of treatment (rotation and tillage practice) effects on soil nitrate and water (growing-season rainfall and fallow storage) rather than disease. We found no evidence that current farming systems based on use of pulses, canola and reduced tillage are less able to maintain intervening cereal yields than traditional systems. On the contrary, practices such as long-fallowing are expected to have increasing negative influence on productivity in the longer term via decreased soil C and N fertility.
Additional keywords: continuous cropping, fallowing, pasture legumes, pulses, soil carbon.
Introduction
From the 1950s to latter part of the 20th Century farming systems in temperate areas of southern Australia were dominated by legume pasture–fallow–wheat (Triticum aestivum L.) rotations (Leeper 1964; Connor et al. 2011). This rotation system provided benefits in terms of weed and disease control, the build-up of mineral nitrogen (N) and, to a lesser extent, accumulation of soil water to the cereal phase (Hannah and O’Leary 1995). During the 1990s, however, cropping systems underwent fundamental changes in response to concurrent financial and technological developments. Decreases in livestock prices relative to grains following the collapse of prices for wool during the early 1990s (Angus 2001), combined with the development of blackleg (Leptosphaeria maculans)-resistant canola (Brassica napus L.) and the release of new, profitable pulse cultivars of chickpeas (Cicer arietinum L.), lentils (Lens culinaris Medik.) and field peas (Pisum sativum L.), resulted in a change from the traditional pasture–fallow–cereal rotation to continuous cropping. These high-value broadleaf crops provided agronomic benefits in the form of disease and weed breaks, as well as being of direct economic value as a commodity compared with the traditional practice of fallowing before a cereal phase of wheat or barley (Hordeum vulgare L.). Commercialisation of effective selective and non-selective herbicides allowed a steady transition from the use of mechanical cultivation for weed control to reduced tillage (RT)/stubble retention systems. Introduction of these systems reduced costs while being less detrimental to the soil resource and provided productivity gains for some soil types and environments. By 2010, 90% of Australian grain growers were using some form of no-tillage system (Llewellyn et al. 2012).
Soil fertility and disease regimes resulting from such changes in farming practices often take many years to become apparent (Hannah and O’Leary 1995). The effect of these changes on the long-term productivity of farming systems in southern Australia is unclear. A recent review of the effect of high-value, non-cereal crops (referred to as ‘break crops’) indicated that the short-term (1–5-year) benefit to wheat yields was in the order oats (Avena sativa L.) < canola < pulses (field peas, lentils and chickpeas) and fallowing (Angus et al. 2015). These benefits were attributed to disease control, N nutrition and water supply, although there were also ‘inexplicable rotation effects’ (Kirkegaard et al. 2008). The effects of tillage and residue retention on crop yields and soil fertility, especially in southern Australia, appear to depend on interactions between soil type (especially structure) and climate, as well as other factors such as weed control and diseases such as Rhizoctonia root rot (caused by Rhizoctonia solani) (O’Leary and Connor 1997a, 1997b; Kirkegaard 1995; Kirkegaard et al. 2014; Flower et al. 2017). The consensus appears to be that no-tillage/stubble retention provides long-term benefits in terms of moisture retention and grain yields in low–medium-rainfall environments. The effect of RT/stubble retention on the quality of cropping soils involves complex interactions between soil N and carbon (C) but generally provides positive (if small) benefits such as reducing the rate of loss of soil organic C rather than maintaining or increasing it, at least on acid soils in higher rainfall regions (Heenan et al. 2004; Chan et al. 2011; Conyers et al. 2015). Similarly, evidence from long-term experiments in the low- and medium-rainfall areas of Victoria indicated variable responses of soil C to management (positive response to rotation with legumes and stubble management and negative response to fallowing). These differences appeared most likely due to differences in soil N and water availability, but the exact cause required further investigation (Robertson et al. 2015). There is an increasing recognition, however, of the need for ‘strategic tillage’ to manage issues such as herbicide-tolerant weeds (Dang et al. 2015).
Long-term experiments provide the opportunity to assess the productivity and sustainability of particular farming systems in an environment (Poulton 1995), especially with regard to soil properties (Powlson and Johnson 1994). Long-term experiments also provide the basis to validate modelling predictions of the year-to-year variability in crop performance in response to seasonal conditions (Latta and O’Leary 2003). In this paper, we present selected data from a long-term experiment, SCRIME (Sustainable Cropping Rotations in Mediterranean Environments), established in 1998. The general aim of SCRIME was to examine how changes in crop types, rotation and tillage that occurred to farming systems in the late 1990s and early 2000s affected crop productivity, grain quality and soil C and N over the longer term. The hypotheses tested were: (i) incorporating a high-value pulse or oilseed such as canola in the rotation can maintain long-term wheat yields at levels similar to, or greater than, traditional rotations based on fallowing or continuous cereals; (ii) tillage practice will have minimal effects on grain yields on this soil type (Vertosol); and (iii) the effect of rotation and tillage practice on wheat yields reflects differences in soil N fertility rather than disease.
Methods
Site
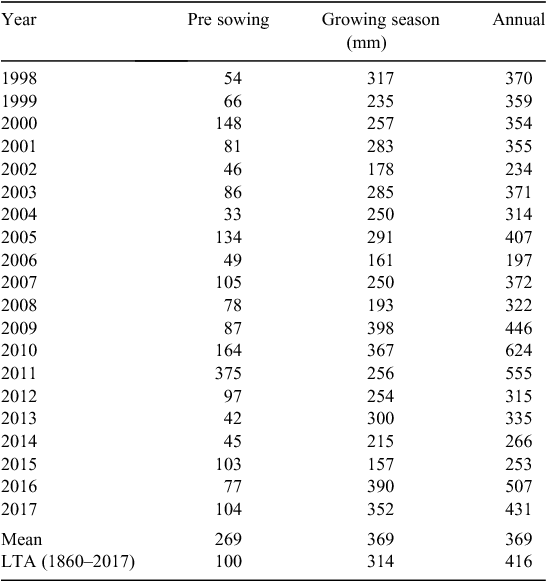
The SCRIME experiment was established in 1998 at Longerenong (36.8400°S, 142.8180°E; elevation 155 m a.m.s.l.; average annual rainfall (1860–2017) 415 mm) in the Wimmera region of western Victoria on a flat (<2%) slope. The soil profile is characterised as an alkaline self-mulching Grey Vertosol (Isbell 2002). The topsoil (0–10 cm) is a light clay that is dark grey in colour with a moderately alkaline pH. This soil provides an excellent seedbed for plant establishment over a large range of water content (0.15–0.45 g/cm3). The upper subsoil (10–35 cm) is a dark greyish brown medium clay that is strongly alkaline. Below 35 cm, the soil profile becomes very strongly alkaline and has large accumulations of fine-earth carbonates (i.e. lime). General soil physical and chemical properties are presented in Table 1. Meteorological data were obtained from the Bureau of Meteorology station (079028) at Longerenong, <1 km from the experimental site (Table 2).

|
|
Design
Australian farming systems rarely follow set rotations, rather crop and pasture sequence and length vary according to biophysical and financial signals (Kirkegaard et al. 2011). A design that was phase-replicated (i.e. each component of the rotation represented each year to account for the effect of different seasonal conditions on different phases of a rotation) and spatially replicated was originally used comprising 10 treatments (rotation–tillage practice) with three replicates. Each plot was 14 m wide by 36 m long. This design allowed comparison between repeated 3- and 6-year phased rotation treatments. A wheat phase was used as a reference crop to assess the effect of the different rotation–tillage treatments. Data presented in this paper focused on nine of the treatments (the tenth treatment, pulse–wheat–pulse, was discontinued in 2010 owing to inability to control weeds). Data were collected between 2001 and 2017, i.e. years 4–18 of the experiment. The nine treatments (T1–T9) were:
-
Wheat–wheat–wheat (WWW), RT
-
Pulse–wheat–barley (PWB), RT
-
Vetch (Vicia sativa L.)/fallow (green manure)–wheat–barley (GmWB), RT
-
Canola–wheat–pulse (CWP), zero-till (ZT)
-
Canola–wheat–pulse (CWP), RT
-
Canola–wheat–pulse (CWP), conventional tillage (CT)
-
Fallow–wheat–pulse (FWP), RT
-
Vetch (green manure)–canola–pulse–annual medic (Medicago truncatula Gaertn.)–wheat–barley (GmCPMWB), RT
-
Lucerne (Medicago sativa L.)–lucerne–lucerne/fallow–canola–wheat–pulse (LLLCWP), RT
Selection of treatments allowed comparison among different break options (fallow, oilseed, pulse, green manure) in any 3-year rotation (T2, T3, T5, T7), and between 1-in-3- and 1-in-2-year legume phases (T8, T9), and for these treatments to be assessed against continuous wheat (T1). In addition, T4–T6 enabled comparison of three tillage treatments (i.e. ZT, RT and CT).
‘Pulse’ was a generic description because the particular crop type used was reassessed at the end of each 3-year cycle. An outbreak of Ascochyta blight (Ascochyta rabiei) in chickpeas during 1998, and the lack of tolerant cultivars, required a switch to field peas in the following year; a chickpea variety with moderate tolerance was used from 2001.
The CT treatment comprised mechanical tillage, using a disc plough and scarifier/harrows as required after grain harvest and before sowing in the following year. Stubble was physically incorporated in the CT treatment. Stubble was retained on the surface in the ZT treatment, T4 (CWP ZT), which did not commence until after the 2003 harvest when suitable sowing equipment was acquired (these plots were previously a WWW high-fertiliser treatment). Stubble was burnt in RT treatments if required, following lifting of fire bans and before sowing in April (e.g. no burning occurred after a drought because of low quantities of stubble). RT treatments were not cultivated other than during sowing. In fallow plots (T7), a knockdown herbicide (glyphosate) was applied as required, except in 2006 when the soil was cultivated once to minimise soil loss by wind erosion. A narrow-point drill (row spacing 30.5 cm) was used for seeding across all cropping treatments. Descriptions of the different tillage treatments are those commonly used when the experiment commenced; it is acknowledged that the term ‘zero-tillage’ is increasingly associated with the use of a disc seeder rather than narrow points.
Descriptions of cultivars used for each crop, and sowing dates, are presented in Supplementary Materials table 1 (available at the journal’s website). Wheat was sown at 81 kg seed/ha (target population 165 plants/m2), barley at 65 kg/ha (175 plants/m2), canola at 5 kg/ha (60 plants/m2), field pea at 120 kg/ha (75 plants/m2), chickpea at 118 kg/ha (30 plants/m2), and lentil at 50 kg/ha (150 plants/m2). Field pea was used as the main ‘pulse’ phase in T2 and T4–T9 from 2001 to 2012, lentils from 2013 to 2015, and field pea again in 2016. Chickpea was used in the pulse phase of T7 up to 2012, lentils from 2013 to 2015, and field pea from 2016. Lucerne (cv. Pioneer L90, 1998–2016) was sown at 5.5 kg/ha, annual medic (cv. Mogul, 1998–2009; cv. Cavilier, 2010–16) at 20 kg/ha, and vetch (cv. Popany) at 25 kg/ha. Lucerne (first year of 3-year phase only), annual medic and vetch were sown in late April–early May each year. Crops were sown dry if moisture was not present.
Crop data were not collected from the wheat phase of T7 in 2010 and 2011 owing to an error in treatment imposition for the fallow in 2009 and 2010.
Phosphorus (P) and N management
Phosphorus fertilisers were applied as mono-ammonium phosphate (MAP) to wheat and canola at 11.3 kg P/ha, as single superphosphate to lucerne at 9.9 kg P/ha in the first year of the 3-year rotation only, and as ‘Grain legume P’ (Incitec-Pivot Ltd, Geelong, Vic.) to the pulse phase at 16 kg P/ha. The P fertilisers were banded with the seed (~0.05 m depth) at sowing to each of the cropping phases. From 1998 to 2009, a basal application of 35 kg N/ha was applied to all cereal and canola crops as Pivot 15 (Incitec Pivot, Melbourne; 15% N) and urea (46% N). From 2010 onwards, the basal urea application was discontinued, with N applied only as MAP (87 kg/ha = 9 kg N/ha), following several crop failures due to drought and no (or negative) responses to the additional N strip in the wheat phase. An additional application of urea (equivalent to 23 kg N/ha) was applied to a narrow strip (2.4 m wide by 36 m long) in the wheat (phase 2) plots only, to assess the potential responsiveness to N. Until 2009 this additional N was applied at sowing; thereafter, N was applied at mid-tillering via topdressing (in line with commercial practice).
Agronomic management
The green manure (T3 and T8) was disced into the soil at flowering time. Lucerne was mechanically cut when plants began to flower. The number of cuts varied with seasonal conditions; generally cuts to lucerne occurred once per year, but in 2011, 2012 and 2016, it was cut three times during the season owing to growth resulting from above-average seasonal conditions. The cut lucerne was retained on the soil surface, except immediately before commencing a cropping phase when it was ploughed into the soil with a disc.
All plots receive a knockdown application of herbicide (carfentrazone-ethyl, glyphosate and triclopyr) before sowing. A post-sowing, pre-emergence application of pyroxasulfone was applied to wheat plots; terbuthylazine to field pea and chickpea plots; and trifluralin and diquat + paraquat to medic, lucerne, barley, vetch and canola plots (except ZT plots, where triallate was applied). All plots were treated with chlorpyrifos at emergence to control insect pests. Post-emergence, bromoxynil + MCPA ester and clopyralid were applied to barley and wheat; bromoxynil + diflufenican to lucerne; diflufenican to field peas; tralkoxydim to barley; atrazine to canola (since 2004); clethodim and haloxyfop to field peas, chickpeas, canola, vetch, medic, lucerne and clover; and imazapic + MCPA to wheat. Tebuconazole was used to control leaf and stripe rusts (caused by Puccinia triticina and P. striiformis) on wheat, and alpha-cypermethrin for control of Bruchus pisorum on field peas and chickpeas as required. Prior to harvest, field peas were desiccated with diquat dibromide. Baits for snails and mice were applied as required (especially in 2001, 2004, 2005, 2008, 2010, 2011 and 2016).
Measurements
Biomass was measured by collecting three 1-m rows (cereals, pulses and canola) at two representative points within each plot at both anthesis and grain maturity. In pasture plots (lucerne, medic or vetch), biomass was measured by collecting four 0.25 m2 (0.25 m by 0.25 m) quadrats before slashing the remainder of the plot. The plant material was dried to constant water content at 70°C and weighed. At maturity, grain from these quadrats was separated by threshing and weighed (to estimate harvest index) before determining 1000-seed weight (wheat plots only). Both the grain and straw sample were then ground (<0.5 mm) and total N concentration was determined with a combustion analyser (LECO, St. Joseph, MI, USA). Grain protein was calculated from the N concentration of grain by using the conversion factor 5.7. Total N content (kg N/ha) was estimated from 2004 onwards and calculated as the sum of N in the grain and that in the remainder of the shoot sample collected at maturity. Grain yield was measured by harvesting a 20-m length of plot (1.37 m wide), using a Hege (Waldenburg, Germany) plot harvester from 1998 to 2005 and a Kingaroy Engineering Works (Kingaroy, Qld) experimental header (1.6 m wide) from 2006 onwards.
Soil mineral N
Three soil cores were collected from selected treatments and phases in April before sowing by using 42-mm-diameter, thin-walled tubes and a hydraulic ram. Soil cores were divided into depth increments of 0–10, 10–20, 20–40, 40–80 and 80–120 cm, and the three samples were pooled. The soil was dried at 40°C, ground (<2 mm) and then extracted in 2 m KCl for 60 min in an end-over-end shaker. The extract was filtered (Whatman No. 42 filter paper) and frozen. Extracts were then analysed for nitrate on a flow injection analyser (Lachat, Loveland, CO, USA). Nitrate was reduced to nitrite through a copperised-cadmium column, and the nitrite was measured colourimetrically at 520 nm (Searle 1984; Rayment and Lyons 2011). The volumetric nitrate content for the soil profile (0–120 cm) was then calculated by adjusting for a common set of bulk-density values for each depth across all treatments and converted to kg N/ha.
Soil total N and organic C
Fifteen cores (depth 0.1 m) were collected at randomly selected positions within each plot in March 2014 by using a hydraulic soil sampler and sampling tubes with 44-mm internal diameter, using procedures as reported in Robertson et al. (2015). Treatment 8 was not sampled. An archived soil sample representative of the entire experimental site collected in March 1998 before the experiment was analysed for comparison. Soil samples were dried at 40°C and then crushed in a Jaw Crusher (Retsch, Haan, Germany) before passing through a 2-mm sieve. Subsamples were then finely ground in a Restch MM400 mill before analysing for total N and total C by using dry combustion on a LECO analyser. Soil samples were tested for the presence of inorganic C by using hydrochloric acid, and if necessary, inorganic C was removed from a second subsample by treating with sulfurous acid and the total C analysis was repeated. Soil organic C (SOC) was calculated as total C – inorganic C. The analytical methods for determining total C and inorganic C are described by Baldock et al. (2013).
Root disease
During 2009, 2012 and 2017, a subset of treatments was soil-sampled to assess the density of a range of soil-borne pathogens. During 2009, the wheat phases of T1, T2, T5 and T8 were sampled; during 2012, the wheat phases of T1–T4 and T6–T9 were sampled; and in 2017, all phases of T1, T2, T6 and T7 were sampled. Plots were sampled during August 2009, May 2012 and April 2017. At each sampling, soil was taken from each plot by using a 10-mm-diameter Accucore sampler (Spurr Soil Probes) to a depth of 150 mm. Forty cores were taken in 2009 and 2012 and 20 cores in 2017 from arbitrary points in each plot, targeting the previous cereal row (when visible), and included any plant residues retained with the soil sample. Soil from all cores in a plot was placed in a sealed plastic bag and dispatched for analysis.
At the Root Disease Testing Service (SARDI) in Adelaide, soil samples were assayed for concentrations of DNA of the wheat pathogens causing take-all (Gaeumannomyces graminis var. tritici), Rhizoctonia (Rhizoctonia solani AG8) and crown rot (Fusarium pseudograminearum and F. culmorum), as well as cereal cyst nematode (Heterodera avenae) and root lesion nematodes (Pratylenchus thornei and P. neglectus). qPCR assays were based on rDNA (TaqMan) probe sequences specific to each pathogen and were applied to the total DNA extracted from the whole oven-dried sample, which generally weighed ~300–500 g before processing (Ophel-Keller et al. 2008). Results were converted, using quantitative DNA standards, to pg fungal DNA per g dry soil for fungal pathogens and to number per g dry soil for nematodes.
Calculations and statistical analyses
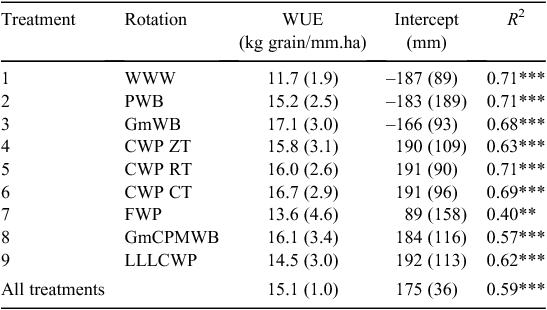
Water-use efficiency (WUE, kg/mm.ha) was determined by fitting a straight-line regression to the relationship between grain yield (kg/ha) and rainfall (mm). This method does not account for any water that may have been present in the soil profile at the beginning and end of this period. In contrast to other studies, we based estimates on rainfall between the preceding November and the November of the crop, because preliminary analysis found must stronger relationships than the more commonly used growing-season rainfall (GSR, April–November). The intercept on the x-axis of the regression estimated mean seasonal soil evaporation (mm), and WUE (slope) can be approximately determined as the transpiration efficiency.
The approach of Angus et al. (2015) was used to determine the relative effects of different treatments on subsequent wheat grain yields compared with those of wheat in T1, using linear regression based on the mean of the replicated plots for that treatment. A Model 2 regression was used to account for variation in both the x- and y-axes.
Analysis of variance (ANOVA) was performed with a linear mixed-effect model fitted by the restricted maximum likelihood approach. Interactions between treatments (rotation and tillage practice) and year were assessed for grain yield, grain protein concentration, harvest index and crop N uptake. For analysis of distribution of soil nitrate-N with depth, differences between treatments were assessed for each depth separately to account for potential auto-correlation between adjacent depths. When necessary, data were transformed (usually using log of the y-variate) to ensure normality and equality of variance. All analyses were conducted by using Genstat Release 18.1 (VSN International, Hemel Hempstead, UK). Unless otherwise stated, differences were considered significant if P ≤ 0.05, and least significant differences (l.s.d.) were used to compare means.
Results
Annual rainfall between 2001 and 2017 ranged from 197 to 624 mm (long-term (1860–2017) average 416 mm) and GSR from 157 to 398 mm (long-term average 314 mm). The timeframe presented in this paper (2001 to 2017) reflects a full range of seasonal conditions ranging from the Millennium Drought (2002–09) to top-decile GSR and flood (Table 2; Supplementary Materials table 2).
Grain yield
Grain yield response of wheat to the different rotation and tillage treatments (Table 3) varied significantly with year (treatment × year interaction, P < 0.001), strongly reflecting the influence of annual rainfall. There were four crop failures (2004, 2006, 2007, 2008), poor yields in 2014 and 2015, above-average yields in 2010–13, and average yields in the remaining years. Overall, wheat grain yields ranged from an average of <0.5 t/ha in five of the 17 years up to 4.89 t/ha in 2010 and 5.04 t/ha when supplementary N was applied in 2011. High yields in 2010 and 2011 were the result of above-average rainfall in the proceeding fallow period rather than GSR (Table 2). Wheat yields in 2009 averaged only 2.81 t/ha, reflecting very dry conditions during grainfill in late September–October despite GSR of 398 mm; this resulted in low average harvest index values of 0.31 (Supplementary Materials table 3). In 2016, GSR was 390 mm but late frost in the post-anthesis period significantly reduced yields.

|
Lowest average wheat yields were generally recorded for continuous wheat (T1, average 1.73 t/ha) and for the rotation following the perennial legume lucerne (T9, average 1.91 t/ha). By contrast, wheat yields following the traditional long-fallow (T7, 3.06 t/ha) and green manure (T3, 2.68 t/ha) were consistently higher (P < 0.05). Average wheat yields following a pulse (T2) or canola crop (T4, T5 and T6) were intermediate between these high- and low-yielding options. When compared across the same rotation (CWP), average wheat yields under ZT (2.09 t/ha) were significantly lower (P < 0.05) than under RT (2.22 t/ha) and CT (2.29 t/ha).
Grain yield responses of wheat to supplementary applications of N (23 kg N/ha) were not significant (P > 0.05) in 2001–03, 2005, 2010, 2012, 2013, 2015 or 2017, and were negative in 2004, 2008 and 2009 (Table 3); no assessments were undertaken in 2006 and 2007 owing to lack of suitable rainfall. In 2014, there was a significant supplementary N application × rotation interaction (P = 0.011), with N fertiliser significantly (P < 0.05) increasing wheat yield in T1 and T4 (CWP ZT) but decreasing wheat yield in the green manure rotation (T3). In that year, adding N significantly increased (P < 0.05) wheat yields by 0.41 t/ha (38%) under ZT (T4), whereas under CT (T6), the yield response was 0.32 t/ha, or 26%. Supplementary N produced significant (P < 0.01) grain yield increases of 0.77 t/ha (or 18%) in 2011 and 0.46 t/ha (or 14%) in 2016 across all treatments.
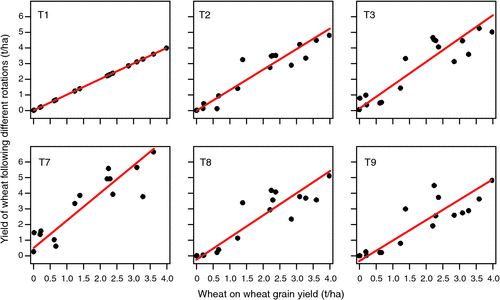
Compared with continuous wheat (T1), long-fallowing (T7) produced a yield benefit in dry years (e.g. 2004), as well as average and wet years (e.g. 2001). This is demonstrated in Fig. 1, where wheat grain yield after fallow showed an average 0.55 t/ha increase during dry years, with an overall advantage of 74% across all seasons (R2 = 0.81). Wheat following a legume always showed higher average grain yields than wheat after wheat, ranging from a 30.4% increase in T9 (R2 = 0.78) to 31.2% in T2 (R2 = 0.90) and 48.8% in T3 (R2 = 0.82). However, when the size of the relative yield response was considered (as indicated by the intercept of the regression; see Fig. 1), the nature of the legume became significant. There were negative effects of rotating with a legume (compared with continuous wheat) in low-yielding (drier) seasons following an annual (medic) (T8, –0.26 t/ha) or perennial lucerne (T9, –0.33 t/ha) pasture rotation. The greatest benefit to wheat yield from a previous legume rotation was with a green manure (T3, 0.11 t/ha); wheat yield following a pulse (T2, 0.03 t/ha) was intermediate.
|
Treatment strongly affected WUE of the wheat phase (Table 4), but treatment differences in WUE were less pronounced than observed for grain yield. Lowest WUE was recorded in the continuous wheat (T1, 11.7 kg/mm.ha). Despite large differences in grain yield, there was little difference in WUE of wheat following a long fallow (T7, 13.6 kg/mm ha) or green manure (T3, 17.1 kg/mm ha) compared with continuous cropping treatments (T2, 15.2 kg/mm.ha; T4–T6, 15.8–16.7 kg/mm.ha). While the grain yield of wheat following 3 years of Lucerne was significantly lower than other treatments, the WUE of this treatment (14.6 kg/mm.ha) was only marginally different (Fig. 1).
|
When graphed as 3-year moving averages to minimise seasonal effect in any one year, there was a trend for grain yields in the continuous wheat (T1) to become pronouncedly lower, and those following fallow (T7) and, to a lesser extent a green manure (T3), to increase relative to other treatments (Fig. 2).

|
Grain protein
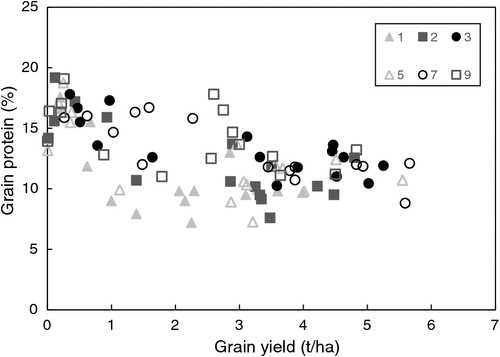
Grain protein concentrations of wheat were relatively high throughout most of the study, averaging 13.6% (Supplementary Materials table 4). By contrast, grain protein was consistently increased by supplemental N fertiliser, often to very high concentrations, for example to >19% during 2014 in T9 (LLLCWP) and T8 (GmCPMWB), reflecting a haying-off effect and significantly decreased harvest index (Supplementary Materials table 3), which translated to poor grain yields (see Table 3). Averaged across the study period, grain protein concentration was lowest in the continuous wheat (T1) treatment and highest where 50% (T8) or more (T9) of the rotation phases were leguminous (T8 and T9). There was a trend for grain protein concentration to be negatively related to grain yield (R2 = 0.375, P <0.001; Fig. 3 and Supplementary Materials table 6), reflecting the effect of water availability (fallow rainfall and GSR), but there was no relationship with mineral N at sowing (R2 = 0.06; data not presented).
|
Wheat N content
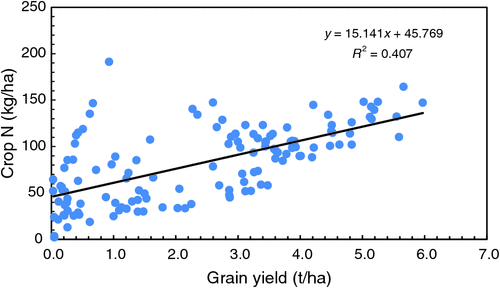
Similar to grain yield, the N content in the aboveground compartment (grain + straw) of wheat at maturity varied markedly between years, ranging from an average of 4.2 kg N/ha in 2006 (reflecting zero yields in all treatments except green-manuring and long-fallow) to 125 kg N/ha in 2009, with an average for all treatments × years of 81.7 kg N/ha (Supplementary Materials table 5: 2004–17 data for each treatment). Crop N content differed significantly (P < 0.05) with treatment, with the lowest average N content in T1 (except for 2007) and generally the highest in T3 (GmWB) and T7 (FWP). Of the 10 seasons (from 2008 onwards) when N uptake was measured in plots both with and without supplementary fertiliser N, there was significant (P < 0.05) negative response in one year (16% in 2008) and a positive response (across all treatments) in two years (23% or nearly 12 kg N/ha in 2014, and 28% or 24.4 kg N/ha in 2016). Tillage practice had no effect (P > 0.05) on N content. Crop N content was positively related (R2 = 0.48) to grain yield (Fig. 4).
|
Soil mineral N
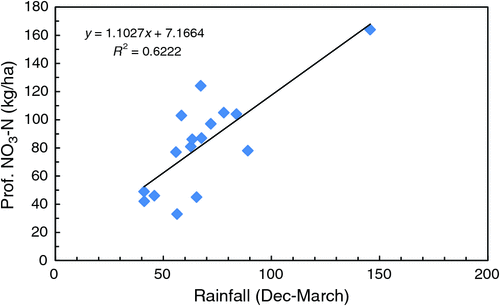
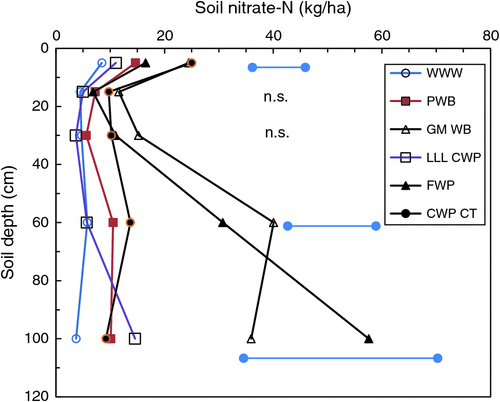
Profile (0–120 cm) soil nitrate-N measured before sowing each year is presented in Table 5. There were significant (P < 0.05) treatment effects in all years except 2004, with profile nitrate-N generally highest following a fallow (T7), green manure (T3) or lucerne (T9) phase and lowest in continuous wheat (T1). The amount of nitrate-N in the profile (averaged across all treatments) was related to rainfall (mm) in the preceding summer fallow period (December–March) (R2 = 0.622; Fig. 5), except when very large, episodic rainfall events occurred e.g. January–February 2011. Similarly, there was a trend for the relative amount of profile nitrate-N in T3 and T9 to be reduced following a dry season (e.g. 2003, 2005, 2006, 2016). Differences in the total amount of nitrate-N in the profile were reflected in differences in the depth at which it was located. Most soil nitrate-N before sowing was in the top 20 cm of the soil profile (data not presented). An exception occurred in 2011, when 375 mm of rainfall was received in the previous 4-month summer fallow (Supplementary Materials table 2); consequently, there was a significant bulge of nitrate-N at 60–120 cm following green manure (T3) and fallow (T7) compared with other continuously cropped treatments or lucerne (T9) (Fig. 6). There was no relationship between the amount of nitrate-N in the profile and subsequent N content of wheat (R2 = 0.061, data not presented).

|
|
|
Soil organic C, total N and C : N ratio
Results of the assessment of SOC and total N concentration in the topsoil (0–10 cm) undertaken in February 2014 are listed in Table 6. Initial analysis indicated no significant (P < 0.05) effect of phase within a rotation, so data was pooled across treatments. SOC was greatest (P < 0.05) in the green manure (T3) and lucerne (T9) treatments and lowest in the FWP rotation (T7). Among the CWP rotations, SOC was significantly greater (P < 0.05) under CT (T6) than under RT (T5), but there was no difference between either of these treatments and ZT (T4). Similar patterns were evident in soil total N, with highest concentrations in the lucerne (T9) and green manure (T3) treatments, followed by CWP CT (T6), with significantly (P < 0.05) less total N in the FWP rotation (T7). Among the CWP treatments, soil total N was significantly (P < 0.05) greater under CT than either RT or ZT. Soil C : N ratio was lowest in the lucerne treatment (T9) and highest in CWP ZT (T4) and the PWB rotation (T2). Soil C : N ratio was significantly (P < 0.05) higher under ZT (T4) than either RT (T5) or CT (T6).

|
Root disease
In the assessment of root disease pathogen density in 2009, all of the important cereal root fungal and nematode pathogens were either not detected or present at a low density (Table 7) regardless of treatment. Testing in 2012 again showed that fungal pathogens of the diseases take-all, Rhizoctonia root rot, and crown rot were either not detected or present at low densities, but there were higher levels of nematode pests (Table 7). Cereal cyst nematodes were present at levels ranging from below detection to high, related to the intensity of susceptible cereals in the rotation. Root lesion nematodes (P. thornei and P. neglectus) were present at low levels and the density of P. neglectus was affected by rotational treatments.

|
In 2017, all soil-borne fungal and nematode pathogens were either not detected or present at low densities (Table 7). Because there were no effects of cultivation on inoculum density within T2, T6 and T7, results were presented as years since the last wheat crop. There were treatment effects on densities of root lesion nematode relating to prior crop history; P. neglectus densities were highest following canola and lowest following continuous wheat, whereas P. thornei densities were highest following wheat and lowest following field peas or canola.
Discussion
High-value break crops such as canola and pulses have largely replaced pastures/livestock and long-fallows in the rotation in medium-rainfall areas such as the Wimmera. Not only are pulses and canola important commodities in their own right—an example being the exceptional high prices received for lentils in 2016—they also are effective break crops for cereals, which remain the primary grain commodity in these cropping systems. Questions about this change have been raised (Kirkegaard et al. 2014) because of the greater susceptibility of these crops to dry seasonal conditions, high variable-input costs required for their production and increasing problems with reliance on chemicals for weed control (e.g. herbicide resistance). The present study highlights some of the advantages and disadvantages resulting from this change on both crop productivity and other factors such as soil fertility.
The study focused on the cereal (wheat) phase as a biological indicator of long-term productivity and soil fertility in these new rotational/tillage systems compared with traditional practices. In commercial practice, farmers do not use ‘fixed’ rotations but consider a range of economic, logistical and seasonal factors. However, this experiment was designed to assess specific rotation and tillage treatments effects over the long-term rather than to duplicate commercial conditions. Wheat was used as a common ‘bioassay’ of treatment effects; consequently, it comprised one-third of the rotation. This contrasts with commercial conditions in southern Australia where cereals comprise an average of 80% of crops sown (ABS 2011). A wide range of seasonal conditions were experienced during this study, ranging from long-term drought to large episodic rainfall events. This not only provides an insight into the effects of different rotation and tillage practices on wheat across the full range of seasons but may also provide insight into impacts of climate change, under which winter and spring rainfall is predicted to be reduced and large, episodic summer events are predicted to become more frequent.
Rotation and wheat productivity
Despite the experimental evidence for the advantages of rotations, many growers still grow consecutive wheat crops (Robertson et al. 2010), with reports that up to 50% of wheat crops were sown after wheat in southern Australia during the Millennium Drought (Kirkegaard et al. 2014). In our study, grain yields in continuous wheat (T1) generally were not significantly lower than average yields of the other treatments in the earlier years of the experiment up to 2010 (except for 2005), after which grain yields in this rotation declined relative to other rotations including those based on the use of pulses, canola and no-tillage practices (Fig. 2), which supports hypothesis 1. This relative reduction in yield of continuous wheat coincided with better seasonal (rainfall) conditions and was first thought to be due to root disease (hypothesis 3). Initial assessments of the major cereal root diseases in 2009, however, suggested that they were unlikely to have affected yields in any treatment (Table 7), although subsequent assessments (in 2012) indicated that disease may have had some minor effect on grain yield in some treatments (Table 7). Soil profile mineral-N levels in the continuous wheat treatment (T1) tended to be lower than in other continuous cropping rotations, and particularly lower than treatments with a high proportion of legumes or a fallow in the rotation, from 2009 onwards. This pattern coincided with lower grain protein concentrations (Supplementary Materials table 4). We suggest that N deficiency and other factors (i.e. ‘the rotation effect’, Kirkegaard et al. 2008) such as increasing prevalence of annual weeds, rather than disease, were primarily responsible for this yield disadvantage (supporting hypothesis 3). This is exemplified by the relatively greater grain yield response to supplementary N fertiliser in continuous wheat (T1) than other continuous cropping treatments in 2014.
Wheat consistently produced the highest yields following a long-fallow (T7). Previous studies in the Victorian Mallee noted the justification for fallowing in terms of agronomic sustainability (Latta and O’Leary 2003), but this practice is much less efficient in the Wimmera (O’Leary et al. 2011), as exemplified by the fallow’s WUE (Table 4). Although the value of long-fallowing to subsequent wheat has been attributed primarily to increases in soil N availability and control of diseases rather than increased water supply, at least in Mallee environments, this may be only part of the explanation in the present study. Root-disease monitoring suggested that none of the major cereal pathogens were present at levels that could significantly impact on grain yields, except in 2012 in T1 (continuous wheat) and to a lesser extent T2 and T3, where the use of a susceptible wheat variety at the time would have potentially caused some minor yield loss due to cereal cyst nematode. Fallowing certainly provided a benefit in terms of extra mineral-N in the profile (Table 5), but the largest yield benefits of fallowing compared with continuous wheat (nearly 1 t/ha: Fig. 1) occurred in low-yielding (dry) seasons. One possible explanation is that Wimmera Vertosols have much greater water-holding capacity that Mallee Calcarosols (O’Leary and Connor 1997a), and in general tend to have fewer subsoil physicochemical constraints that can impact on root growth (Incerti and O’Leary 1990). This highlights the need to assess changes in soil water across a range of seasonal rainfall scenarios when assessing the effect of management practices such as fallowing on crop productivity.
Even when a previous phase contained a pulse such as field peas or lentils (T2), the impact on the grain yield and quality (protein) of the subsequent wheat phase was small compared with when annual (non-pulse) legume options of vetch green manure (T3) or medic pasture (T8) were used. McCallum et al. (2000) found that although field peas generally fixed a greater amount of N than either annual medic or lucerne pasture in this environment, the subsequent grain responses of annual crops were smaller. This was attributed to the amount of N exported from the field pea crop as grain, whereas in SCRIME, all of the N produced by either medic or green manure was retained in the plots. Evans et al. (2001) also noted that field peas could produce a net N benefit ranging from –46 to 181 kg N/ha (mean 40 kg N/ha) on soil N balance in south-eastern Australia.
Green (and brown) manures have been demonstrated to provide a range of benefits to cereal production in Mediterranean environments, including weed control, disease reduction and improvement of soil quality (Roper et al. 2012). The vetch green manure produced, on average, the second-greatest yield benefit to subsequent wheat crops (after the long-fallow treatment), with a tendency to provide greater relative yield benefits in drier years than the annual medic or pulse rotation but with no significant effect in average or above-average seasons. This pattern of yield benefit compared with pulses may reflect the timing of termination of the vetch (T3) and medic (T8) in relation to spring rainfall and summer fallow rainfall (Fig. 2). Interestingly, there was a gradual trend for wheat following the green manure to outyield wheat following medic from 2011 onwards (Table 3, Fig. 2), possibly reflecting a trend for increased broadleaf weed pressure in the annual medic, a pattern exacerbated by having two broadleaf rotation phases preceding the annual medic.
Despite the potential advantage of perennial lucerne pastures to soil mineral-N supply (and SOC and total N), wheat grown in this rotation (T9) consistently yielded less than in other rotations except continuous wheat (T1), especially in drier seasons. This negative effect appears due to the impact of lucerne on soil-water balance. Profile soil water content under lucerne-based pastures has been found to remain consistently drier than under continuous annual cropping (McCallum et al. 2001). Using simulation modelling, McCallum et al. (2001) predicted the median yield penalty for the first wheat crop after lucerne to be 0.4 t/ha (15%). The risk of this yield penalty decreased during a cropping phase with each year after lucerne as the soil profile progressively recharged with water. This indicates that it could take as long as 5 years for the profile to recharge with water to the same level as under continuous cropping (McCallum et al. 2001). Although the negative effect of the lucerne phase was not as pronounced in ‘wetter’ years such as 2009–11, it was still apparent on subsequent crops. This highlights the value of water deep in the profile to grain yield (Lilley and Kirkegaard 2007). This ‘deep water’ is highly valued on this soil type (deep Vertosol) in this environment owing to its high clay content and ability to store large amounts of water (O’Leary and Connor 1997a). This advantage is reduced if subsoil physicochemical constraints are present that may limit the ability of the subsequent crop to utilise this ‘deep water’ (Adcock et al. 2007).
Nitrogen response
Since 2004, there were only 3 years during which the grain yield of wheat responded to additional N fertiliser (23 kg N/ha), with N application having either no effect in other years or a significant negative effect such as in 2009. In 2014, grain yields in T1 (continuous wheat) and the ZT/stubble retained treatment (T4) were significantly increased by N application (there were either no or a negative effect on yield in other treatments), and in 2011 and 2016 there was a significant grain yield response to additional N across all treatments. Although positive vegetative responses to the additional N fertiliser were observed in other seasons (data not presented), these responses did not translate to increased grain yield. Responses of grain yield to N fertiliser are highly variable in Australia (Angus 2001), and small or even negative yield responses to N are common during ‘dry’ seasons (Angus et al. 2014). The low average harvest index values, especially after additional N was applied in some years (Supplementary Materials table 3), suggested that ‘haying off’ (van Herwaarden et al. 1998) occurred in many years of this experiment. Grain yield responses to added N, however, coincided with low mineral levels at sowing (see Table 5 and later discussion) and a steady trend for reductions in grain protein since 2010 (Supplementary Materials table 4). In all other years, there was either no significant response or a negative effect to supplemental N. This finding is somewhat at odds with the general perception that cereals (and canola) grown in the Wimmera are responsive to N. However, the Millennium Drought (2002–09) significantly reduced grain yield potential (and therefore demand for N). Furthermore, a relatively late sowing date (in line with commercial practice when the experiment first commenced) for wheat was used up to 2010, which also would have reduced yield potential (especially in seasons with dry finishes during grain filling) and thus affected crop demand for N. The extent to which the change to earlier sowing times (in line with trends in current commercial practice) and the return of better seasons from 2011 onwards contributed to greater responsiveness to N fertiliser remains unclear. It is noteworthy, though, that average grain yields in 2015 were greater than in 2002, despite lower GSR in 2015.
An analysis of soil collected before commencing this experiment in 1998 indicated moderate fertility levels (0–10 cm: SOC 1.13%, total N 0.090%). Tuohey and Robson (1980) proposed a critical soil total N concentration of 0.11% on the same soil type as the SCRIME site, beyond which grain yields of wheat are unlikely to increase in any season. This critical value was based on a depth of 0–15 cm; if it were based on 0–10 cm it would be even higher. Soil total N levels had declined further from this initial starting concentration across all treatments by 2014 (Table 6), making them significantly below this designated threshold value for likely N-fertiliser responses. In this study, the rate of decline in soil N fertility would have been partially minimised by the use of a greater proportion of N2-fixing legume phases in the rotation (1-in-2 and 1-in-3, depending on the treatment), compared with the 1-in-4 or 1-in-5 used in commercial farming rotations on similar Wimmera Vertosol soils. However, the N supplied by legume fixation was insufficient to offset losses of N via grain export or other loss mechanisms such as denitrification. Angus (2001) suggested that widespread responses to N fertiliser did not occur in southern New South Wales until yield constraints posed by disease were overcome. It is possible that, in the case of SCRIME, the use of wheat cultivars with relatively high tolerance to common root diseases and application of seed fungicide dressings, compared with those available in the 1970s when the Tuohey and Robson (1980) research was undertaken, may have altered this critical soil N concentration. Nonetheless, the most likely cause of the lack of general responsiveness to N in SCRIME up to 2010 was the repeated occurrence of dry seasonal conditions, which greatly reduced yield potentials not only in this experiment but across most of southern Australia. This leads us to conclude that there is little opportunity for experimenting with multiple fertiliser applications, unless sufficient deep-stored water is known to exist (Cantero-Martinez et al. 1999).
Soil C and N
There has been significant recent interest in the role of agricultural management such as rotation and tillage practice in soil C storage/sequestration. A previous assessment of SOC stocks (Robertson et al. 2015) was undertaken in 2010 in SCRIME, 4 years before the current sampling (2014) and before the marked improvement in seasonal conditions that occurred between 2010 and 2014. Our results showed similar trends to those of Robertson et al. (2015), whereby SOC was greater in both the lucerne (T9) and green manure (T3) rotations and lowest where a fallow phase was included in the rotation (T7). Our study further confirms the role that improved N supply to the soil (via N2 fixation by either lucerne or vetch) plays in soil C dynamics. In contrast to a previous (shorter term) study (McCallum et al. 2000), perennial lucerne pasture significantly increased both soil SOC and total N in SCRIME, more than rotations containing annual legume crops (where N was exported as grain). There was no evidence that reducing tillage provided any benefit to SOC or total N in the absence of stubble removal (McCallum et al. 2001). The present study supports the previous observation that SOC was greater in the stubble-incorporated CT treatment (T6) than under RT (T5), where stubble was regularly burnt following high-yielding crops to minimise the build-up of mice populations and facilitate sowing in line with regional commercial practice. Furthermore, as discussed previously, no treatment (pasture legume, green manure or ZT) appeared able to maintain initial SOC concentrations.
Nitrogen contributed by legumes is an important component of soil mineral-N supply to cereal and oilseed crops in southern Australia (Heenan and Chan 1992; Peoples et al. 2017). Legume presence in the rotation significantly affected both SOC and total N, which in turn improved soil nitrate supply to the following wheat crop and therefore yield (supporting hypothesis 3). Nitrate-N supply following both green-manuring and the lucerne rotation was consistently greater than in the continuously cropped treatments, even when those cropped treatments contained a pulse. Often, the relative effects of the different legume treatments on subsequent soil nitrate varied markedly from year to year, in part reflecting the impact of the dry-matter production of the previous legume phase, i.e. increased legume dry-matter production was associated with greater quantities of N fixed and therefore increased N supply to the following crop (Peoples et al. 2017). However, this was not always the case. The greatest quantities of soil nitrate occurred in 2010, yet grain yields and dry-matter production were close to the regional average, suggesting that other factors such as rainfall and soil-water availability during the latter part of the growing season limited the crop’s ability to convert the soil N supply fully into grain yield. The exception in terms of nitrate-N supply was the fallow treatment (T7), where SOC and total N were significantly lower than in most other treatments (Table 6) but where soil mineral-N supply was often equal to that of the vetch green manure (T3) or lucerne (T9) rotation. The combination of greater amounts of soil nitrate, and presumably soil water, that accumulated during the long-fallow enabled T7 to produce the highest grain yields consistently (suggesting that hypotheses 3 was partially supported).
Soil mineral-N supply before sowing was positively related to the amount of rainfall during the summer–autumn fallow (Fig. 5). When account was made of the additional rainfall received in the long-follow treatment, which effectively started 18 months before the wheat phase, the relationship was much poorer (data not presented), suggesting an overall poor fallow use efficiency. The positive relationship between nitrate supply in April and the amount of rainfall occurring during the immediate preceding fallow period (December–March) across all treatments is not surprising. Warm temperatures over the summer fallow, combined with moist soils, would encourage N mineralisation (Heenan and Chan 1992). In a recent review, Peoples et al. (2017) also found a significant relationship between soil N benefits from legumes and summer fallow rainfall across south-eastern Australia. Although fallowing may produce greater amounts of soil mineral N (and water) to the following crop in the short–medium term (O’Leary and Connor 1997b), this management practice was inherently exploitative of the long-term soil nutrient pool and thus non-sustainable in the longer term, (Angus and Grace 2017), as illustrated by the reduced levels of SOC and total N recorded in the present study (Table 6). Ultimately, fallowing would be expected to produce low levels of plant-available N in the longer term (>20 years), even when every second annual crop planted is an N2-fixing pulse, owing to the increased rundown of soil total N and SOC. In line with other studies (e.g. Heenan and Chan 1992; O’Leary and Connor 1997b), tillage practice had no consistent effect on N mineralisation and soil nitrate supply, which are more influenced by seasonal rainfall conditions (Hoyle and Murphy 2011).
There were noticeable differences in the vertical distribution of soil nitrate-N between the different treatments in some seasons. For example, 375 mm of rainfall was recorded in the 4-month summer fallow preceding sowing in 2011. In both the FWP (T7) and the vetch green manure (T3) treatments, a pronounced bulge of nitrate was found in the lower parts of the potential root-zone, compared with a more even distribution of N throughout the profile in other treatments (Fig. 6). A more even vertical distribution of mineral N through the soil profile can have agronomic advantages in some circumstances. The co-location of N with water deeper in the soil profile provides a better synchronisation of N supply to crops, especially during a dry spring when the topsoil (and any N located there) generally dries out (Armstrong et al. 1999). This bulge of soil mineral N in the middle–lower parts of the root-zone may lead to potential losses of N below the root-zone through leaching. This leaching can be a problem in sandy soils (e.g. Mallee dune systems, O’Leary and Connor 1997b) but was not initially considered a problem on this grey Vertosol where the clay content is >45% throughout most of the profile. Fallowing (T7) and, to a lesser extent, green-manuring (T3) where soil water has accumulated have the potential to cause the greatest leaching losses in seasons with high fallow rainfall. Interestingly, although soil total N concentrations were generally higher in T9, the long period of perennial lucerne reduced residual soil water, thus reducing the potential for leaching losses.
Tillage practice
A gradual trend towards implementing ‘reduced’ and ‘no-till’ systems has been occurring across Australia since the 1970s (Llewellyn et al. 2012). When SCRIME commenced, narrow tillage points were regarded as standard practice for implementing ZT in southern Australia. Disc-seeding implements are now considered by some growers and advisers as a requirement. As such, the ZT treatment used in SCRIME would now be termed ‘no-till’ rather than ‘zero-till’. Kirkegaard et al. (2014) argue that no-till/direct-till practices provide undisputed benefits over conventional cultivation in terms of time, labour and fuel. Although up to 90% of Australian grain growers in most regions use no-tillage, the rate of adoption varies significantly between regions (Llewellyn et al. 2012). The rate of adoption of ‘zero-till’ in the Wimmera has been much lower, with a recent trend back to traditional stubble-management methods in response to when there are heavy stubble loads or there are concerns over mice (F. Pritchard, pers. comm.). In SCRIME, there was no consistent impact (beneficial or negative) of tillage on yield, although CT significantly outyielded ZT when averaged over the 17 crops examined (rejecting hypothesis 2). Previous long-term studies (Kirkegaard 1995) have also indicated potential negative impacts of no-till on yield (due to disease) as well as benefits (of stubble retention) via increased infiltration of rainfall (Cantero-Martinez et al. 1995; Bissett and O’Leary 1996; O’Leary and Connor 1997c). As Kirkegaard et al. (2014) point out, the impact of tillage systems on productivity involves a complex interaction between soil type, environment, yield potential and management system. In our study, where the soil was characterised by a naturally high structural stability, tillage practice has little impact on productivity, at least in a medium (18-year) time frame.
Disease
Assessments (2009, 2012 and 2017) of density of inoculum of important soil-borne wheat diseases showed that, overall, pathogens were either not detected or present at low densities (Table 7). The exception was cereal cyst nematode, which was detected at densities varying from low to high during 2012 (Table 7), related to the length of break since the last susceptible cereal. In the preceding years, wheat cv. Clearfield JNZ and barley cv. Gairdner, which are susceptible to cereal cyst nematode, were grown. Where the industry recommendation to have at least a 2-year break between susceptible cereals was followed (Vanstone et al. 2008), cereal cyst nematodes were below detection levels. Densities were lower where there had been a 1-year break than where there had been no break since the last susceptible cereal. Following the detection of higher densities, the wheat cultivar was changed to resistant cv. Grenade CL Plus. This change contributed to the reduction in cereal cyst nematode densities detected in 2017 (Table 7).
Testing of soil-borne pathogens in April 2017 showed that although root lesion nematodes were present at low densities, their number was affected by the previous crop (Table 7). Densities of P. neglectus were highest following canola, which is susceptible to this species (Taylor et al. 2000). By contrast, densities of P. thornei were lowest following field peas and canola, both of which have some resistance to this nematode (Hollaway et al. 2000). The findings demonstrate the role of crop choice in managing nematode densities. If a suitable tolerant cultivar was used, there was no evidence that soil-borne disease influenced grain yields of wheat across the different treatments in SCRIME (hypothesis 3).
Conclusions
The productivity of wheat in this medium-rainfall environment was strongly influenced by seasonal rainfall, making it challenging to assess the impact of any one rotation or tillage treatment on productivity in a season. Different management strategies such as continuous cropping with wheat and use of zero-tillage had no discernible effect in the short term. Management practice (especially rotation) did, however, have longer term effects on the soil system, particularly in the form of a gradual decrease in soil N and SOC that had started to limit productivity by the end of the present study. Despite using a relatively high frequency of pulses in the rotation, only non-pulse legume options such as lucerne, annual medic and vetch green manure had a significant influence on the key soil-fertility indicators total N and SOC in the longer term. Because this study did not specifically assess the rate of change in these soil indicators, especially across the whole soil profile, it is uncertain whether these legume treatments increased, maintained or only slowed the rate of decrease in soil fertility. This is an important question that needs to be addressed in future studies. It appears likely that fallowing had a strong negative effect on long-term soil fertility, even though this was masked by a significant positive effect on soil mineral N supply to date.
In contrast to rotation, tillage practice had little effect on wheat production at this site, possibly reflecting the inherently high soil-structural qualities of the Vertosol soil. Whether this lack of tillage effect applies to other soil types, especially the poorly structured Sodosols and Calcarosols that dominate large areas used for grain production in Victoria and South Australia, is unclear.
Ultimately, financial performance, logistical constraints and attitudes to risk remain key considerations for many growers when assessing management options. The relative merits of different management choices, such as use of continuous cropping with high-value pulse and oilseed crops v. use of fallows or even a return to greater emphasis on livestock production and pastures, will vary with each farm and with longer term seasonal conditions. This experiment demonstrated the significant impact that seasonal conditions can have on productivity and performance of different management (rotation and tillage) practices. There is a clear need to assess the effect of the different management treatments on soil-water balances and to extrapolate results to much longer time periods as well as different seasonal (climate change) scenarios by using simulation modelling (e.g. Liu et al. 2014). Experience in other cropping systems, e.g. soil-nutrient depletion in the northern grains region, has demonstrated that the negative effects of certain management practices can be extremely expensive, almost financially prohibitive, to rectify once a certain tipping point is passed; this is exasperated in environments where seasonal conditions are highly variable such as south-eastern Australia.
Conflicts of interest
The authors declare no conflicts of interest.
Acknowledgements
We acknowledge the long-term support that the Victorian Government (through Agriculture Victoria) has given to the Long-Term Agronomic Experiments Network. We also acknowledge the Agriculture Victoria technical staff, including Greg Antonoff, Bernard Noonan, Russel Argall and Liana Warren, who have contributed to the running of SCRIME since 1998. We are also grateful to Carole Wright for formulating the experimental design, to Dr Jenny Smith for the development of an ACCESS database to manage data and to the Wimmera Catchment Management Authority for funding the analysis of the data and assistance in the preparation of this paper.
References
ABS (2011) Agricultural Commodities, Australia 2009–10. Commonwealth of Australia. Australian Bureau of Statistics, Canberra, ACT.Adcock D, McNeill AM, McDonald GK, Armstrong RD (2007) Subsoil constraints to crop production on neutral and alkaline soils in south-eastern Australia: A review of current knowledge and management strategies. Australian Journal of Experimental Agriculture 47, 1245–1261.
| Subsoil constraints to crop production on neutral and alkaline soils in south-eastern Australia: A review of current knowledge and management strategies.Crossref | GoogleScholarGoogle Scholar |
Angus JF (2001) Nitrogen supply and demand in Australian agriculture. Australian Journal of Experimental Agriculture 41, 277–288.
| Nitrogen supply and demand in Australian agriculture.Crossref | GoogleScholarGoogle Scholar |
Angus JF, Grace PR (2017) Nitrogen balance in Australia and nitrogen use efficiency on Australian farms. Soil Research 55, 435–450.
| Nitrogen balance in Australia and nitrogen use efficiency on Australian farms.Crossref | GoogleScholarGoogle Scholar |
Angus JF, Gupta VVSR, Pitson GD, Good AJ (2014) Effects of banded ammonia and urea fertiliser on soil properties and the growth and yield of wheat. Crop & Pasture Science 65, 337–352.
| Effects of banded ammonia and urea fertiliser on soil properties and the growth and yield of wheat.Crossref | GoogleScholarGoogle Scholar |
Angus JF, Kirkegaard JA, Hunt JR, Ryan MH, Ohlander L, Peoples MB (2015) Break crops and rotations for wheat. Crop & Pasture Science 66, 523–552.
| Break crops and rotations for wheat.Crossref | GoogleScholarGoogle Scholar |
Armstrong RD, McCosker K, Millar G, Kuskopf B, Johnson S, Walsh K, Probert ME, Standley J (1999) Legume and opportunity cropping systems in Central Queensland. 2. Effect of legumes on following crops. Australian Journal of Agricultural Research 50, 925–936.
| Legume and opportunity cropping systems in Central Queensland. 2. Effect of legumes on following crops.Crossref | GoogleScholarGoogle Scholar |
Baldock JA, Hawke B, Sanderman J, Macdonald LM (2013) Predicting contents of carbon and its component fractions in Australian soils from diffuse reflectance mid-infrared spectra. Soil Research 51, 577–595.
Bissett MJ, O’Leary GJ (1996) Effects of conservation tillage and rotation on water infiltration in two soils in south-eastern Australia. Australian Journal of Soil Research 34, 299–308.
| Effects of conservation tillage and rotation on water infiltration in two soils in south-eastern Australia.Crossref | GoogleScholarGoogle Scholar |
Cantero-Martinez C, O’Leary GJ, Connor DJ (1995) Stubble retention and nitrogen fertilisation in a fallow-wheat rainfed cropping system. 1. Soil water and nitrogen conservation, crop growth and yield. Soil & Tillage Research 34, 79–94.
| Stubble retention and nitrogen fertilisation in a fallow-wheat rainfed cropping system. 1. Soil water and nitrogen conservation, crop growth and yield.Crossref | GoogleScholarGoogle Scholar |
Cantero-Martinez C, O’Leary GJ, Connor DJ (1999) Soil water and nitrogen interaction in wheat in a dry season under a fallow-wheat cropping system. Australian Journal of Experimental Agriculture 39, 29–37.
| Soil water and nitrogen interaction in wheat in a dry season under a fallow-wheat cropping system.Crossref | GoogleScholarGoogle Scholar |
Chan KY, Conyers MK, Li GD, Helyar KR, Poile G, Oates A, Barchia IM (2011) Soil carbon dynamics under different cropping and pasture management in temperate Australia: Results of three long-term experiments. Soil Research 49, 320–328.
| Soil carbon dynamics under different cropping and pasture management in temperate Australia: Results of three long-term experiments.Crossref | GoogleScholarGoogle Scholar |
Connor DJ, Loomis RS, Cassman KG (2011) Crop ecology. In ‘Production and management in agricultural systems’. (Cambridge University Press: Cambridge, UK)
Conyers M, Liu DL, Kirkegaard J, Orgill S, Oates A, Li G, Poile G, Kirkby C (2015) A review of organic carbon accumulation in soils within the agricultural context of southern New South Wales, Australia. Field Crops Research 184, 177–182.
| A review of organic carbon accumulation in soils within the agricultural context of southern New South Wales, Australia.Crossref | GoogleScholarGoogle Scholar |
Dang YP, Seymour NP, Walker SR, Bell MJ, Freebairn DM (2015) Strategic tillage in no-till farming systems in Australia’s northern grains-growing regions: I. Drivers and implementation. Soil & Tillage Research 152, 104–114.
| Strategic tillage in no-till farming systems in Australia’s northern grains-growing regions: I. Drivers and implementation.Crossref | GoogleScholarGoogle Scholar |
Evans J, McNeill AM, Unkovich MJ, Fettell NA, Heenan DP (2001) Net nitrogen balances for cool-season grain legume crops and contributions to wheat nitrogen uptake: a review. Australian Journal of Experimental Agriculture 41, 347–359.
| Net nitrogen balances for cool-season grain legume crops and contributions to wheat nitrogen uptake: a review.Crossref | GoogleScholarGoogle Scholar |
Flower KC, Ward PR, Cordingley N, Micin SF, Craig N (2017) Rainfall, rotations and residue level affect no-tillage wheat yield and gross margin in a Mediterranean-type environment. Field Crops Research 208, 1–10.
| Rainfall, rotations and residue level affect no-tillage wheat yield and gross margin in a Mediterranean-type environment.Crossref | GoogleScholarGoogle Scholar |
Hannah MC, O’Leary GJ (1995) Wheat yield response to rainfall in a long-term multi-rotation experiment in the Victorian Wimmera. Australian Journal of Experimental Agriculture 35, 951–960.
| Wheat yield response to rainfall in a long-term multi-rotation experiment in the Victorian Wimmera.Crossref | GoogleScholarGoogle Scholar |
Heenan DP, Chan KY (1992) The long-term effects of rotation, tillage and stubble management on soil mineral nitrogen supply to wheat. Australian Journal of Soil Research 30, 977–988.
| The long-term effects of rotation, tillage and stubble management on soil mineral nitrogen supply to wheat.Crossref | GoogleScholarGoogle Scholar |
Heenan DP, Chan KY, Knight PG (2004) Long-term impact of rotation, tillage and stubble management on the loss of soil organic carbon and nitrogen from a Chromic Luvisol. Soil & Tillage Research 76, 59–68.
| Long-term impact of rotation, tillage and stubble management on the loss of soil organic carbon and nitrogen from a Chromic Luvisol.Crossref | GoogleScholarGoogle Scholar |
Hollaway GJ, Taylor SP, Eastwood RF, Hunt CH (2000) Effect of field crops on density of Pratylenchus in southeastern Australia; Part 2: P. thornei. Journal of Nematology 32, 600–608.
Hoyle FC, Murphy DV (2011) Influence of organic residues and soil incorporation on temporal measures of microbial biomass and plant available nitrogen. Plant and Soil 347, 53–64.
| Influence of organic residues and soil incorporation on temporal measures of microbial biomass and plant available nitrogen.Crossref | GoogleScholarGoogle Scholar |
Incerti M, O’Leary GJ (1990) Rooting depth of wheat in the Victorian Mallee. Australian Journal of Experimental Agriculture 30, 817–824.
| Rooting depth of wheat in the Victorian Mallee.Crossref | GoogleScholarGoogle Scholar |
Isbell RF (2002) ‘The Australian Soil Classification.’ (CSIRO Publishing: Melbourne)
Kirkegaard JA (1995) A review of trends in wheat yield responses to conservation cropping in Australia. Australian Journal of Experimental Agriculture 35, 835–848.
| A review of trends in wheat yield responses to conservation cropping in Australia.Crossref | GoogleScholarGoogle Scholar |
Kirkegaard J, Christen O, Krupinsky J, Layzell D (2008) Break crop benefits in temperate wheat production. Field Crops Research 107, 185–195.
| Break crop benefits in temperate wheat production.Crossref | GoogleScholarGoogle Scholar |
Kirkegaard JA, Peoples MB, Angus JF, Unkovich MJ (2011) Diversity and evolution of rainfed farming systems in southern Australia. In ‘Rainfed farming systems’. (Eds P Tow, I Cooper, I Partridge, C Birch) pp. 715–754. (Springer: Dordrecht, The Netherlands)
Kirkegaard JA, Conyers MK, Hunt JR, Kirkby CA, Watt M, Rebetzke GJ (2014) Sense and nonsense in conservation agriculture: principles, pragmatism and productivity in Australian mixed farming systems. Agriculture, Ecosystems & Environment 187, 133–145.
| Sense and nonsense in conservation agriculture: principles, pragmatism and productivity in Australian mixed farming systems.Crossref | GoogleScholarGoogle Scholar |
Latta J, O’Leary GJ (2003) Long-term comparison of rotation and fallow tillage systems of wheat in Australia. Field Crops Research 83, 173–190.
| Long-term comparison of rotation and fallow tillage systems of wheat in Australia.Crossref | GoogleScholarGoogle Scholar |
Leeper GW (1964) ‘An introduction to soil science.’ 4th edn (Melbourne University Press: Melbourne)
Lilley JM, Kirkegaard JA (2007) Seasonal variation in the value of subsoil water to wheat: simulation studies in southern New South Wales. Australian Journal of Agricultural Research 58, 1115–1128.
| Seasonal variation in the value of subsoil water to wheat: simulation studies in southern New South Wales.Crossref | GoogleScholarGoogle Scholar |
Liu DL, Anwar MR, O’Leary G, Conyers MK (2014) Managing wheat stubble as an effective approach to sequester soil carbon in a semi-arid environment: Spatial modelling. Geoderma 214–215, 50–61.
| Managing wheat stubble as an effective approach to sequester soil carbon in a semi-arid environment: Spatial modelling.Crossref | GoogleScholarGoogle Scholar |
Llewellyn RS, D’Emden FH, Kuehne G (2012) Extensive use of no-tillage in grain growing regions of Australia. Field Crops Research 132, 204–212.
| Extensive use of no-tillage in grain growing regions of Australia.Crossref | GoogleScholarGoogle Scholar |
McCallum MC, Peoples MB, Connor DJ (2000) Contributions of nitrogen by field pea (Pisum sativum L.) in a continuous cropping sequence compared with a lucerne (Medicago sativa L.)-based pasture ley in the Victorian Wimmera. Australian Journal of Agricultural Research 51, 13–22.
| Contributions of nitrogen by field pea (Pisum sativum L.) in a continuous cropping sequence compared with a lucerne (Medicago sativa L.)-based pasture ley in the Victorian Wimmera.Crossref | GoogleScholarGoogle Scholar |
McCallum MH, Connor DJ, O’Leary GJ (2001) Water use by lucerne and effects on crops in the Victorian Wimmera. Australian Journal of Agricultural Research 52, 193–201.
| Water use by lucerne and effects on crops in the Victorian Wimmera.Crossref | GoogleScholarGoogle Scholar |
O’Leary GJ, Connor DJ (1997a) Stubble retention and tillage in a semi-arid environment: 1. Soil water accumulation during fallow. Field Crops Research 52, 209–219.
| Stubble retention and tillage in a semi-arid environment: 1. Soil water accumulation during fallow.Crossref | GoogleScholarGoogle Scholar |
O’Leary GJ, Connor DJ (1997b) Stubble retention and tillage in a semi-arid environment: 2. Soil mineral nitrogen accumulation during fallow. Field Crops Research 52, 221–229.
| Stubble retention and tillage in a semi-arid environment: 2. Soil mineral nitrogen accumulation during fallow.Crossref | GoogleScholarGoogle Scholar |
O’Leary GJ, Connor DJ (1997c) Stubble retention and tillage in a semi-arid environment: 3. Response of wheat. Field Crops Research 54, 39–50.
| Stubble retention and tillage in a semi-arid environment: 3. Response of wheat.Crossref | GoogleScholarGoogle Scholar |
O’Leary GJ, Walker S, Joshi NL, White J (2011) Water availability and use in rainfed farming systems: their relationship to system structure, operation and management. In ‘Rainfed farming systems. Part 1. Principles and their application’. Ch. 4. (Eds P Tow, I Cooper, I Partridge, C Birch) pp. 101–132. (Springer Science+Business Media B.V: London)
Ophel-Keller K, McKay A, Hartley D, Herdina , Curran J (2008) Development of a routine DNA-based testing service for soilborne diseases in Australia. Australasian Plant Pathology 37, 243–253.
| Development of a routine DNA-based testing service for soilborne diseases in Australia.Crossref | GoogleScholarGoogle Scholar |
Peoples MB, Swan AD, Goward L, Kirkegaard JA, Hunt JR, Li GD, Schwenke GD, Herridge DF, Moodie M, Wilhelm N, Potter T, Denton MDI, Browne C, Phillips LA, Khan DF (2017) Soil mineral nitrogen benefits derived from legumes and comparisons of the apparent recovery of legume or fertiliser nitrogen by wheat. Soil Research 55, 600–615.
| Soil mineral nitrogen benefits derived from legumes and comparisons of the apparent recovery of legume or fertiliser nitrogen by wheat.Crossref | GoogleScholarGoogle Scholar |
Poulton PR (1995) The importance of long-term trials in understanding sustainable farming systems: the Rothamsted experience. Australian Journal of Experimental Agriculture 35, 825–834.
| The importance of long-term trials in understanding sustainable farming systems: the Rothamsted experience.Crossref | GoogleScholarGoogle Scholar |
Powlson DS, Johnson AE (1994) Long-term field experiments: their importance in understanding sustainable land use. In ‘Soil resilience and sustainable land use’. (Eds DJ Greenland, I Szabolcs) pp. 367–394. (CAB International: Wallingford, UK)
Rayment GE, Lyons D (2011) ‘Soil chemical methods—Australasia.’ (CSIRO Publishing: Melbourne)
Robertson MJ, Lawes RA, Bathgate A, Byrne F, White P, Sands R (2010) Determinants of the proportion of break crops on Western Australian broadacre farms. Crop & Pasture Science 61, 203–213.
| Determinants of the proportion of break crops on Western Australian broadacre farms.Crossref | GoogleScholarGoogle Scholar |
Robertson F, Armstrong R, Partington D, Perris R, Oliver I, Aumann C, Crawford D, Rees D (2015) Effect of cropping practices on soil organic carbon: evidence from long-term field experiments in Victoria, Australia. Soil Research 53, 636–646.
| Effect of cropping practices on soil organic carbon: evidence from long-term field experiments in Victoria, Australia.Crossref | GoogleScholarGoogle Scholar |
Roper MM, Milroy SP, Poole ML (2012) Green and brown manures in dryland wheat production systems in Mediterranean-type environments. Advances in Agronomy 117, 275–313.
Searle PL (1984) The Bertholet or indophenol reaction and its use in the analytical chemistry of nitrogen. Analyst 109, 549–568.
| The Bertholet or indophenol reaction and its use in the analytical chemistry of nitrogen.Crossref | GoogleScholarGoogle Scholar |
Taylor SP, Hollaway GJ, Hunt CH (2000) Effect of field crops on population densities of Pratylenchus neglectus and P. thornei in southeastern Australia; Part 1: P. neglectus. Journal of Nematology 32, 591–599.
Tuohey CL, Robson AD (1980) The effect of cropping after medic and non-medic pastures on soil total N, and on the grain yield and nitrogen content of wheat. Australian Journal of Experimental Agriculture and Animal Husbandry 20, 220–228.
| The effect of cropping after medic and non-medic pastures on soil total N, and on the grain yield and nitrogen content of wheat.Crossref | GoogleScholarGoogle Scholar |
van Herwaarden AF, Farquhar GD, Angus JF, Richards RA, Howe JN (1998) ‘Haying-off’, the negative grain yield response of dryland wheat to nitrogen fertiliser. I. Biomass, grain yield, and water use. Australian Journal of Agricultural Research 49, 1067–1081.
| ‘Haying-off’, the negative grain yield response of dryland wheat to nitrogen fertiliser. I. Biomass, grain yield, and water use.Crossref | GoogleScholarGoogle Scholar |
Vanstone VA, Hollaway GJ, Stirling GR (2008) Managing nematode pests in the southern and western regions of the Australian cereal industry: continuing progress in a challenging environment. Australasian Plant Pathology 37, 220–234.
| Managing nematode pests in the southern and western regions of the Australian cereal industry: continuing progress in a challenging environment.Crossref | GoogleScholarGoogle Scholar |