

Genetic diversity among wild and cultivated germplasm of the perennial pasture grass Phalaris aquatica, using DArTseq SNP marker analysis
Washington J. Gapare A B , Andrzej Kilian C , Alan V. Stewart D , Kevin F. Smith E and Richard A. Culvenor A F
A F
A CSIRO Agriculture and Food, GPO Box 1700, Canberra, ACT 2601, Australia.
B Present address: Grains Research and Development Corporation, PO Box 5367, Kingston, ACT 2604, Australia.
C Diversity Arrays Technology, Building 3, Level D, University of Canberra, Monana St., Bruce, ACT 2617, Australia.
D PGG Wrightson Seeds Ltd, Lincoln, New Zealand.
E Faculty of Veterinary and Agricultural Sciences, University of Melbourne, Private Bag 105, Hamilton, Vic. 3300, Australia.
F Corresponding author. Email: Richard.Culvenor@csiro.au
Crop and Pasture Science 72(10) 823-840 https://doi.org/10.1071/CP21112
Submitted: 15 February 2021 Accepted: 24 May 2021 Published: 14 September 2021
Journal Compilation © CSIRO 2021 Open Access CC BY-NC
Abstract
Phalaris aquatica L. (phalaris) is a cool-season perennial grass originating from the Mediterranean Basin, north-west Africa and Middle Eastern regions that is used for livestock agriculture mainly in temperate areas with dry summers. It has been the subject of breeding programs in Australia, South America, New Zealand and the USA. Increased knowledge of relationships between wild and cultivated germplasm through use of molecular markers has the potential to facilitate future breeding gains. For this purpose, we conducted an analysis of P. aquatica by using 3905 polymorphic DArTseq SNP markers. Genetic diversity as measured by expected heterozygosity was similar for wild (HE = 0.14; n = 57) and cultivated (HE = 0.13; n = 37) accessions. Diversity in wild germplasm was generally continuous in nature, largely related to geographical location, with a division at the broadest scale into eastern and western clades, with more admixture in the western than the eastern clade. Structure analysis of wild germplasm indicated six subpopulations consistent with country of origin, with some admixture among subpopulations likely resulting from natural and human influences. There were nine subpopulations among wild and cultivated accessions combined. This population structure should be considered if genomic selection is applied in P. aquatica. Analysis of molecular variance indicated that 71% of the genetic variation occurred within subpopulations and 29% among subpopulations. Genetic distances were low among cultivated germplasm from most countries except the USA, which was more distinct. Evaluation of material from the US pool by breeding programs in other countries, and additional material from the less utilised eastern clade, may be worthwhile.
Keywords: AMOVA, bulbous canary grass, DArTseq, Diversity Arrays Technology, genetic diversity, genotyping-by-sequencing, Phalaris aquatica, perennial grass, wild ecotype.
Introduction
Phalaris aquatica L. (phalaris, Hardinggrass, Toowoomba canary grass, bulbous canary grass) is a cool-season perennial grass belonging to the Old World group of species in the genus Phalaris whose centre of origin and present natural distribution resides in the Mediterranean Basin (Baldini 1993; Voshell et al. 2011; Voshell and Hilu 2014). As a commercial forage grass, P. aquatica is valued for its high production and nutritive quality in the autumn–winter–spring period, and for its high persistence through regular summer droughts and exceptional drought events too severe for reliable use of perennial ryegrass (Lolium perenne L.) (Carlson et al. 1996; Oram et al. 2009). P. aquatica is one of the most important forage species for livestock agriculture in southern Australia, where its value as a broadacre, sown pasture grass was first recognised (Oram et al. 2009). It is also a commercial species in several South American countries, notably Argentina, and has been used in New Zealand, USA, South Africa and, to limited extent, in northern Africa and southern Europe. P. aquatica has been studied as a renewable biofuel for Mediterranean regions due to its high potential for biomass production (Karapatsia et al. 2014; Pappas et al. 2014).
P. aquatica is an outcrossing species that is largely wind pollinated. It is considered to be a segmental allotetraploid (2n = 4x = 28) (Putievsky et al. 1980). Baillie et al. (2017) reported that the genome of P. aquatica is likely to be large and complex but similar in size to that of P. arundinacea, due to a prevalence of moderately to highly repetitive DNA and the likelihood of significant homoeologous (between sub-genomes) and paralogous (between duplicated gene copies) sequence variation (e.g. Kaur et al. 2012). The size of P. arundinacea was reported as 4009.8 Mbp/C (4.1 pg in 978 Mbp/pg equivalent; Dolezel and Bartos 2005). Information about genome size is important for designing molecular markers and genetic maps. Some meiotic irregularities have been observed in crosses between widely separated ecotypes of P. aquatica but not to the extent of preventing recombination for breeding purposes (Putievsky et al. 1980). This suggests that P. aquatica is in the process of speciation, a point noted by taxonomists, considering that ecotypes from north-west Africa with hairy glumes previously have been described as var. hirtiglumis (Anderson 1961) or even as a separate species (P. elongata Braun-Blanq.; Baldini 1995). Oram et al. (2009) argued against this being a separate species, in part because cultivars bred in Australia and elsewhere are based on populations created by intercrossing ecotypes from both P. aquatica and var. hirtiglumis/P. elongata.
P. aquatica is one of the few species in the genus Phalaris that has been subjected to selection and breeding. The first commercial cultivar of the species, now called cv. Australian, is believed to be an Italian ecotype (Trumble 1935; Oram et al. 2009). However, uncertainty surrounds its origin (Scurfield and Biddiscombe 1966; McWilliam et al. 1971) and some early workers even hypothesised a hybrid origin (Jenkin and Sethi 1932; Anderson 1961). Although variation for agronomic characters such as flowering date and seedling growth rate is present in cv. Australian (Latter 1965), the greater variation observed in studies of wild ecotypes (Cooper and McWilliam 1966) resulted in Australian breeders pursuing the creation of breeding populations based on diverse accessions. McWilliam and Latter (1970) describe the top-crossing of 26 ecotypes from northern Africa, southern Europe and Israel to the adapted cv. Australian and a morphologically similar ecotype from Turkey (CPI 15022). This broadly based population became the basis for the Commonwealth Scientific and Industrial Research Organisation (CSIRO) phalaris breeding program and the release of so-called ‘winter-active’ cultivars Sirosa, Sirolan, Holdfast and Landmaster. Later cultivars bred for specific stress tolerances, Advanced AT for acid soils and Holdfast GT for grazing tolerance, are also related to the early broad populations. The CSIRO program also released several more summer-dormant cultivars for dry marginal areas (Sirocco, Atlas PG and Horizon) based on largely Moroccan germplasm including the US cultivar Perla Koleagrass, itself bred from a Moroccan ecotype (Adams et al. 1974).
An important domestication step in the CSIRO program was the discovery of a rare mutant in cv. Australian that completely held its seed. This ‘intact rachilla’ mechanism of seed retention was thought to be controlled by four recessive genes (McWilliam and Gibbon 1981). The mutant was used to form a cultivar (cv. Uneta) and later to introduce intact-rachilla seed retention into the main winter-active breeding pool through several cycles of outcrossing seed-retaining plants to winter-active germplasm to reduce inbreeding and regain the winter-active phenotype such as in cv. Holdfast (Oram and Schroeder 1992). All CSIRO cultivars released since cv. Holdfast possess this trait.
Cultivar Australian was exported to the USA and South America where further selection for local adaptation gave rise to cultivars such cv. Hardinggrass and probably cv. TAM Wintergreen in the USA, and cv. Pergamino El Gaucho in Argentina (Oram et al. 2009). Several lines from Pergamino, Argentina, also form the basis of the New Zealand cultivar, Grasslands Maru (Rumball 1980), and cv. Seedmaster was selected from cv. El Gaucho in Australia (McWilliam and Schroeder 1965). Part of the breeding pool in several countries is therefore likely to be related through the cv. Australian pool.
Cultivars based on a much broader range of ecotypes have also been produced in the USA, such as cv. AU Oasis and the germplasm AU1 for Alabama and similar environments (Pedersen et al. 1983, 1984). More recently, The Noble Foundation screened a wide range of ecotypes and introductions under heavy grazing pressure for adaptation to the southern Great Plains environment, which resulted in adapted populations formed from plants in persistent accessions (Mian et al. 2005; Hopkins et al. 2006). Several cultivars of P. aquatica have been produced in Argentina and Uruguay (Oram et al. 2009). At least one, cv. Maté, resulted from cycles of selection in the Australian winter-active cultivar Sirosa for productivity under local conditions, whereas another, cv. Estanzuela Urunday, was bred from local and Mediterranean ecotypes (Oram et al. 2009).
It appears that the Australian, US and South American breeding pools of P. aquatica share historical relationships but selection has been conducted for local adaptation in isolation from the environment in other countries. The relationships of these pools to each other and to wild germplasm, and the extent to which they have diverged from each other, are of interest for future breeding.
Studies of population genetic diversity based on molecular markers are valuable in exploring relationships between germplasm within and among species and provide important knowledge for planning effective plant breeding programs. A species closely related to P. aquatica, P. arundinacea L., was the subject of a detailed molecular diversity study (Jakubowski et al. 2011), and a comparative analysis of P. aquatica and P. arundinacea based on the chloroplast genome has been published (Xiong et al. 2020). A reference transcriptome of P. aquatica was published by Baillie et al. (2017). Mian et al. (2005) conducted a genetic diversity study in P. aquatica using AFLP markers and concentrating on 22 populations displaying persistence and vigour under evaluation in Oklahoma, USA. Wild accessions from Morocco, Algeria, Italy, Greece and Turkey were included with two cultivars and four breeding populations. Moroccan accessions were found to cluster separately from the remaining germplasm, suggesting the presence of structure in the species based on geographic location.
The present study in P. aquatica examined diversity in a much larger number (n = 57) of wild accessions than used in the study of Mian et al. (2005). These accessions covered much of the natural range of the species and therefore allow more robust examination of the relationship between genomic variation and geographical distribution. ‘Wild’ in this sense indicates that an accession was collected in the natural range of the species and was unlikely to be a sown cultivar or landrace. This does not preclude the possibility that an accession arose from naturalised material. The study also included a much wider range of cultivated germplasm from the main breeding pools worldwide, including Australia, USA, South America and New Zealand.
The study is the first to utilise DArTseq markers to explore genomic variation in P. aquatica. DArTseq markers are a relatively low-cost but high density and throughput marker technology, and have been used successfully in diversity studies of many organisms (e.g. Sansaloni et al. 2011; Kilian et al. 2012; Cruz et al. 2013; Raman et al. 2014; Edet et al. 2018; Farahani et al. 2019; Abbasov et al. 2020). The specific objectives of this study were (i) to examine the relationships among wild and cultivated germplasm, and between the main breeding pools; and (ii) to examine population genetic structure of the P. aquatica material. The knowledge generated will be beneficial to traditional breeding, and when forming training populations for genomic selection should greater resources become available for phalaris breeding in the future.
Materials and methods
Germplasm
In total, 94 wild and cultivated (cultivars, breeding populations) accessions of P. aquatica were included in the study. All 57 wild accessions originated from the Mediterranean and Middle Eastern homeland of the species (Table 1, Fig. 1). Accessions were sourced from the CSIRO collection, Margot Forde Germplasm Centre, Agriculture Victoria (Cunningham Collection; Cunningham et al. 1997) and New South Wales Department of Primary Industries (Graeme Sandral Collection, now in the Australian Pastures Genebank), or direct from institutions and companies. Cultivated germplasm (n = 37) was represented by 27 cultivars and eight commercial breeding populations from five countries, and one New Zealand ecotype probably arising from a commercial line (Table 1). Cv. Australian was entered twice, using seed from 1971 and 2003, to check for stability. Information on the cultivated germplasm is presented in Appendix 1.

|

|
DNA extraction and SNP genotyping
A bulking strategy was employed to reduce the cost of sampling the high level of genetic variation among individuals expected in an outcrossing tetraploid species such as P. aquatica. Bulking has been shown to give similar results to sampling individuals in diversity studies of outcrossing species as long as bulks of at least 20–30 individuals are formed (Guthridge et al. 2001; Kopecký et al. 2011; Bolibok-Brągoszewska et al. 2014; Liu et al. 2018). Detection of rare alleles is reduced in bulks of this size but is enhanced by sampling individuals or small bulks (Liu et al. 2018). For each accession, we therefore randomly sampled bulks of size n = 30 supplemented with three separate individuals.
DNA extraction, sequencing and quality analysis of markers were performed by using procedures developed by Diversity Arrays Technology Pty Ltd (DArT PL, Canberra, ACT). Individual seeds and bulks of 30 seeds were pulverised in a Geno/Grinder (SPEX SamplePrep, Metuchen, NJ, USA) and the DNA was extracted using the NucleoMag (MACHEREY-NAGEL, Düren, Germany) system. After lysis of the flour for 2 h, the lysate was mixed with beads, gently agitating the reservoir at all times. The deep well plate was then transferred to a Tecan 100 robot (Tecan, Männedorf, Switzerland) where the final extraction steps (washing and elution into elution buffer) were performed by using a 96 tip head and DArT PL proprietary script.
Based on testing several enzyme combinations for complexity reduction, the SbfI–HpaII method was selected for Phalaris. DNA samples were processed in digestion/ligation reactions principally as per Kilian et al. (2012). The SbfI-compatible adaptor was designed to include a flow cell attachment sequence (Illumina, San Diego, CA, USA), sequencing primer sequence and ‘staggered’ varying-length barcode regions, similar to the sequence reported by Elshire et al. (2011). Only ‘mixed fragments’ (SbfI–HpaII) were effectively amplified in 30 rounds of PCR. PCR equimolar amounts of amplification products from each sample were then bulked and applied to the cBot (Illumina) bridge PCR followed by sequencing on Illumina Hiseq2500. Sequences generated from each lane were processed by using proprietary DArT PL analytical pipelines. Outputs were used in a secondary pipeline for proprietary SNP and SilicoDArT (presence/absence of restriction fragments in representation) calling algorithms (DArTsoft14). For SNP calling, all tags from all libraries included in the DArTsoft14 analysis were clustered by using DArT’s C++ algorithm at the threshold distance of 3, followed by parsing of the clusters into separate SNP loci using a range of technical parameters, especially the balance of read counts for the allelic pairs. Multiple samples were processed from DNA to allelic calls as technical replicates, and scoring consistency was used as the main selection criterion for high quality/low error rate markers. Calling quality was assured by high average read depth per locus (average across all markers was >20 reads/locus).
Two types of data are generated by DArTseq: SNP and SilicoDArT. SNP markers are nucleotide polymorphisms present in the restriction fragments that are co-dominant, whereas SilicoDArT markers are dominant. In this study, we used only SNP markers because dominant markers add little information for population genetics studies. Prior to quality control measures, 28 020 SNPs were identified with call rates ranging from 0.20 to 1. The dataset was filtered for minor allele frequency (MAF) <0.1 and for missing data >10% (e.g. Alam et al. 2018; Farahani et al. 2019). Quality of SNP markers was determined by the parameters ‘reproducibility ≥0.95’ and ‘call rate at 70%’. Overall, 3905 SNP markers remained for analysis of genetic diversity and population structure with 99% reproducibility. The large number of markers that are simultaneously assayed by the DArT platform provides a high level of resolution in genetic diversity studies (Kilian et al. 2005). Preliminary analysis of genetic diversity and population structure showed consistent results between datasets from individuals and bulks. Subsequent analysis was based on the combined data, considering the data from the bulks as a fourth sample.
Quality analysis of marker data
Quality analysis of the markers included tests for call rate (%), reproducibility (%), one ratio and polymorphism information content (PIC). We used the package ‘dartR’ in R (The R Foundation for Statistical Computing, Vienna: https://www.R-project.org/) for the quality control measures at thresholds of 70% for the call rate and one ratio. The one ratio constitutes the proportion of the samples for which genotype scores equalled 1. This resulted in reproducibility ranging from 0.95 to 1. PIC is the degree of diversity of the marker in the population. Based on a call rate of 70%, initially, 6744 SNP markers were returned, and after quality control (discarding of markers with >30% missing values and a MAF <0.05, as well as filtered monomorphic loci, which do not provide information for population structure), 3905 SNPs remained for analysis with 99% reproducibility.
Population analyses
Genetic relationships among accessions, population structure and genetic diversity analysis
Genetic relationships among accessions were investigated by using a method that assesses allele sharing (Gondro 2015). The allele sharing for two individuals is the average of the absolute difference between all of their SNPs. The function ‘as.dist’ in R was used to convert the allele sharing matrix into a genetic distance. In order to perform hierarchical clustering of the distance matrix, we used the ‘hclust’ function in R, using the clustering algorithm ‘complete’, which finds more similar clusters. Weighted neighbour-joining dendrograms were constructed and clade strength in the dendrograms was tested by 20 000 bootstrap analyses. The ‘genlight’ function ‘ibd’ in dartR was used to compute the correlation between inter-population genetic distance (Nei’s distance; Nei 1978) and geographical distance using the Mantel test (9999 permutations).
Population genetic statistics including expected heterozygosity (HE), pairwise differentiation between populations (FST) and analysis of molecular variance (AMOVA) were estimated using the functions ‘adegenet’ and ‘hierfstat’ in R. The FST statistic measures the distribution of genetic variation within and among populations (e.g. Frankham et al. 2002). We also examined the inbreeding coefficient FIS, which measures the reduction in heterozygosity due to inbreeding (Wright 1978; Hartl and Clark 2007). AMOVA to measure the proportions of genetic variation within and among populations was also implemented in R using the function ‘varcomp.glob’.
The genetic structure of the germplasm was analysed by using the cross-entropy criterion in the ‘LEA’ package in R (Frichot and Francois 2015). The R package LEA implements two classical approaches for the estimation of population genetic structure, principal component analysis (PCA) and admixture analysis (Patterson et al. 2006; Pritchard et al. 2000), using sparse non-negative matrix factorisation. The function can handle missing data in population structure analysis, eliminating the need for imputation. The LEA function PCA was used to compute the scores of a PCA for the genotypic matrix. PCA explains the genetic distances among the accessions. To infer the probable number of subpopulations, we used the LEA function ‘sNMF’ in R, which estimates ancestry coefficients comparable to those obtained with STRUCTURE or ADMIXTURE (Frichot et al. 2014). It provides an interesting alternative to STRUCTURE software because it does not require that populations are in Hardy–Weinberg equilibrium and can handle large sets of data without using parallel processing software (Frichot et al. 2014). The algorithms were implemented in the program sNMF based on sparse non-negative matrix factorisation (NMF) and least-squares optimisation (Kim and Park 2011). Runs of sNMF were performed for values of the number of clusters set to K = 2–10 for the wild accessions, and K = 2–19 for wild and cultivated accessions. Each run was replicated 50 times. The number of ancestral populations, K, was then based on the cross-entropy criterion curve, which exhibits a monotonic decrease and plateaus (Frichot et al. 2014). The minimum cross-entropy value denotes the possible number of clusters in a population.
Results
Quality analysis of SNP markers
In total, 28 020 SNPs were identified, with an average of 99% reproducibility. The call rate varied from 19% to 100%. Almost 76% of SNP markers showed a <70% call rate and were excluded from the study. However, most of the excluded ‘missing data’ were due to presence of the null alleles (restriction fragments missing in representations of samples and bulks in the analysis), rather than insufficient sequencing volume applied, because there was limited correlation between marker read depth and call rate. Such a high level of null alleles is not surprising given the generally very high level of DNA sequence diversity in this material. Not considered in the analysis were 2839 SNP markers with extremely low one ratio (<0.05). In total, 3905 SNP markers were returned, with an average call rate of 98% and an average one ratio of 0.42. These markers were determined to be highly informative with an average PIC value of 0.21 and a median of 0.19. Of the markers, 11% were in the lowest PIC value range (0–0.05) and 12% in the highest PIC value range (0.40–0.50) (Supplementary materials Fig. S1, available at the journal’s website). The remaining PIC value groups (0.05–0.10, 0.10–0.20, 0.20–0.30, 0.30–0.40) exhibited an approximately similar marker frequency value ranging from 18% to 23% each.
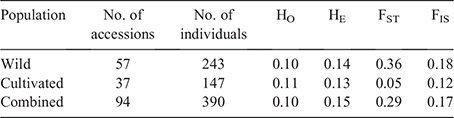
Genetic diversity parameters
Four parameters were estimated for the populations of wild and cultivated accessions separately and the groups combined and are compared in Table 2. Genetic diversity for the panel was explained through estimation of the expected heterozygosity (HE), which showed similar values for the whole panel and wild and cultivated populations (0.13–0.15; Table 2). Observed heterozygosity (HO) values were also similar for all population categories and were lower than HE values, possible evidence of inbreeding. This was supported by positive FIS values (mean FIS = 0.17). FST as a measure of differentiation among accessions was much higher among wild accessions (0.36) than among cultivated accessions (0.05), suggesting a high degree of genetic relatedness in the cultivated pool.
|
Genetic relationships among accessions
Wild germplasm
Genetic relationships were first examined among the 57 wild accessions, using a dendrogram based on hierarchical clustering of the distance matrix. The dendrogram (Fig. 2a, b) shows that, with only a few exceptions, accessions from the same country and broader geographical region clustered together. A clear east–west pattern of relationship was evident, the two major clades splitting the germplasm into eastern (Greece, Israel, Jordan, Syria, Iraq, Azerbaijan) and western (Italy, Sardinia, Portugal, Spain, Algeria, Tunisia, Morocco) clades. Only a small sample of two Turkish accessions located in the western clade did not adhere to this general pattern. In the eastern clade, two smaller clades were resolved. The first contained Israeli and Jordanian accessions in one sub-clade and all Greek accessions in another. The second contained all accessions from the eastern extremity of the sampled distribution of P. aquatica (Syria, Iraq, Azerbaijan) with a single Israeli accession and one Syrian accession slightly separated. In the western clade, the first branch separated five of six Algerian accessions and one Turkish accession from other north-west African (Morocco, Tunisia) and the south-west European (Portugal, Spain, Italy, Sardinia) accessions, which clustered separately. One Spanish (CPI15220) and two Portuguese (CPI14418, CPI14419) were separated from other south-west European accessions and closer to north-west African accessions. In the south-west European sub-clade, all Sardinian accessions grouped together next to mainland Italy, then with Spanish and Portuguese accessions and one Algerian accession. The sub-clade of Moroccan accessions was itself split into two smaller sub-clades: one, with a Tunisian accession, deriving from central and southern Morocco, and the other from northern Morocco.

|
Population structure analysis of wild accessions was performed to partition the genome of each accession into a user-defined number of subpopulations (K). Assuming only two subpopulations (K = 2) matched the east and west clades of the dendrogram (Fig. 3a). Within the eastern clade (red), accessions from Greece (including Crete) and Israel showed clear evidence of admixture from the western clade, whereas accessions from Jordan, Syria, Iraq and Azerbaijan showed little or no admixture. The western clade (blue) showed admixture from the eastern clade mainly in accessions from Turkey, Algeria, Italy, Portugal, Spain and Sardinia. Accessions from Morocco (nos 7, 8, 45–50) and Tunisia (no. 57) showed no admixture from the eastern clade at this scale.

|
The number of ancestral populations, K, from the cross-entropy criterion curve plateaued at K = 6 (Fig. S2, cross-entropy = 0.2570), suggesting that six genetic subpopulations best described the wild P. aquatica germplasm as shown in Fig. 3b. Admixture among subpopulations generally involved geographically close subpopulations but not always. Three subpopulations were identified in north-west Africa, one (dark blue) from Algeria with one Turkish accession, showing admixture mainly from southern Europe (green), and two in Morocco–Tunisia. One of the Moroccan subpopulations (pale blue), from central-southern Morocco, showed lower levels of admixture than the second from northern Morocco (salmon), both showing admixture mainly from each other, Algeria and from southern Europe. The more admixed Moroccan subpopulation also contained an accession from each of Portugal and Spain, the Spanish accession (w-15220) also showing admixture from an eastern Mediterranean subpopulation (yellow). A large western European subpopulation (green), also containing two accessions from Greece and one accession from each of Turkey and Algeria, showed relatively diverse admixture from north-west Africa, Israel–Greece, Algeria and Syria–Iraq–Azerbaijan. Of the two remaining subpopulations, one (yellow) was from Greece–Israel–Jordan with considerable admixture from western Europe in Greek and Israeli accessions, and with admixture from the second Syria–Iraq–Azerbaijan subpopulation (red) in Jordanian accessions.
Wild and cultivated germplasm combined
Genetic relationships between wild and cultivated accessions, and between cultivated accessions, were investigated in the combined wild plus cultivated dataset. The dendrogram based on the distance matrix (Fig. 4a, b) again showed two major clades with a general east–west grouping among wild accessions but with the difference that most south-west European accessions (one from Spain, two from Portugal, and the Italian and Sardinian accessions) grouped with the eastern clade (Greece and Middle Eastern countries). The original introduction to Australia (cv. Australian), thought to be an essentially wild accession and included as two separate accessions from 1971 (c-Aust1971) and 2003 (c-Aust2003), grouped in this clade along with numerous cultivars likely to have originated from it in Australia and the Americas. Thus, this clade represented mainly wild accessions other than those from north-west Africa, or cultivated material derived closely from wild accessions. That the two accessions of cv. Australian clustered next to each other demonstrates the power of the SNP array to reveal known or cryptic pedigree structure precisely. Wild accessions that grouped most closely with c-Aust1971 and c-Aust2003 were w-19344 from Portugal, w-19299 from Algeria and w-15022 from Turkey.

|
The second clade contained all north-west African (Morocco, Algeria, Tunisia) accessions except one from Algeria, two from Portugal and one from Spain previously noted as grouping with Moroccan accessions, and cultivated material either developed in breeding programs from broad-based populations that included north-west African accessions or based entirely on north-west African accessions (Fig. 4). Cultivated populations from the USA, apart from the Moroccan-derived cv. Perla, grouped in the eastern clade even if they were broad-based (e.g. cvv. AU1, Oasis). This is probably related to the origin of accessions on which they were based; for example, Oasis is the only cultivar recorded to contain material from Iraq (Hoveland et al. 1982). Relationships between cultivars in the western clade were consistent with known breeding history. For example, c-GenSelect was the first broad-based population created in the CSIRO breeding program, c-Sirosa the first cultivar bred from this, and c-GMate was bred from c-Sirosa in Argentina. All grouped very closely in Fig. 4. Similarly, a forerunner generation of c-AtlasPG contributed over half the parentage of c-HoldfastGT; both grouped together in Fig. 4.
The entropy criterion-based population structure showed a clear minimum in the scree plot at K = 9 (Fig. S3), suggesting that nine genetic subpopulations best described the combined wild plus cultivated germplasm as shown in Fig. 5. The genetic diversity within each subpopulation was explained through the estimation of expected heterozygosity (HE), which varied from 0.06 (Pop5, Syria–Iraq–Azerbaijan) to 0.17 (Pop4, broad-based cultivated without intact-rachilla seed retention), with all but Pop5 being similar in heterozygosity (Table 3). The proportion of membership of each population ranged from 0.06 (Pop1) to 0.31 (Pop9) of the total accessions for these estimates (Table 3, Fig. 5). The genetic divergence among the populations revealed by Nei’s net nucleotide distance indicated that distance was highest (0.442) between Pop5 and Pop7 (five Algerian accessions, one Turkish, NF4010) (Table 3). Very low distances included those between Pop1 (southern Morocco) and Pop4, and Pop2 (northern Morocco) and Pop8 (seed-retaining, broad-based cultivated), indicating strong influence of Moroccan germplasm in the broad-based cultivated groups. Of interest was the low value between Moroccan Pop2 and southern European Pop9. The inbreeding coefficient (FIS) of subpopulations ranged from –0.13 (Pop3) to –0.33 (Pop5), suggesting that the subpopulations are highly outbred (Table 3). AMOVA showed that a large proportion of genetic variation segregates within (71%) rather than between (29%) the subpopulations (AMOVA, P < 0.001; Supplementary Table S1).

|
 , Pop2
  , Pop3
  , Pop4
  , Pop5
  , Pop6
  , Pop7
  , Pop8
  , Pop9
  ). The proportion of each bar that is of a specific colour indicates the likelihood/probability that the individual belongs to the cluster of that colour. Cultivar names and corresponding individual numbers (1–94) as shown on the x-axis are provided in

|
The same six subpopulations revealed among wild-only accessions were present in the combined analysis, except that the Greece–Israel–Jordan subpopulation in the wild analysis was split into two subpopulations in the combined analysis (subpopulations 3 and 6 in Fig. 5). Subpopulation 3 also contained two US cultivated accessions. Two new subpopulations contained mainly broad-based cultivars that do not have intact-rachilla seed retention (Pop4 in Fig. 5), and more recent broad-based cultivars with intact-rachilla seed retention (Pop8 in Fig. 5).
In order to further analyse geographical relationships among the 94 wild and cultivated accessions, all accessions were grouped on country of origin and pairwise genetic distances between countries were calculated by Wright’s FST index (Table 4). Distances between accessions grouped by countries ranged from 0 to 0.70. The overall population differentiation estimate (FST) among countries was 0.29 (Table 2) and highly significant (P < 0.0001). For the wild accessions, there was a correlation between genetic and geographical interpopulation distance (Mantel test, r = 0.5368, P = 0.004). The highest genetic distance between countries was between Tunisia and Azerbaijan. Countries with the highest average genetic distances (most isolated) from the overall population were the far eastern group of Azerbaijan, Iraq, Syria and Jordan in the eastern clade, and Sardinia and the single accession from Tunisia in the western clade. Genetic distances among countries with only cultivated accessions (Australia, Argentina, Uruguay, New Zealand, USA) were very low (0–0.13, mean 0.03) suggesting that a closely-related cultivated pool was being used by all countries. Distances between the cultivated pool of countries and other countries were lowest for Portugal, Spain, Italy, Turkey and Morocco; distances were slightly higher for Tunisia, Sardinia, Israel and Greece, indicating less representation from these countries in the cultivated pool. Cultivated material from the USA was on average closer to the far-eastern group (0.20–0.28) than was material from other countries with cultivated germplasm (0.34–0.59). This difference between USA and other countries with cultivated accessions is clear in a dendrogram based on the matrix of FST values (Fig. S4).

|
The PCA analysis of combined wild and cultivated germplasm confirmed the patterns indicated by other analyses (Fig. 6). The general east–west pattern starting at Morocco extending systematically through southern Europe eastwards is clear. Both east and west extremes in this distribution were somewhat isolated. Some accessions from Portugal, Spain and Turkey grouped nearer to Morocco as noted previously. Algerian accessions clustered apart from Moroccan accessions towards southern European accessions. The PCA makes clear the division of most cultivated material between the cv. Australian-type cultivars, which clustered among wild accessions from southern European countries at the top of PC2 axis, and the more broadly based cultivars from Australia, Argentina, Uruguay, New Zealand and USA, which clustered between north-west African and southern European wild accessions. Most US cultivated accessions clustered apart from cultivated accessions from other countries.

|
Discussion
This marker-based study provides a consistent description of genetic diversity in a broad sample of P. aquatica germplasm that included wild accessions with a wide geographical range and cultivated germplasm from the main breeding pools in Australia, USA, South America and New Zealand. We obtained strong evidence of population structure in the wild species, with significant genetic distance among population substructures mainly related to geographical distribution with some admixture from mainly proximal and occasionally more distant sources. The ability of markers to group cultivated germplasm accurately where relationships were known provides confidence in using this platform based on DArTseq SNP markers to clarify relationships among wild and cultivated accessions and potentially to facilitate plant breeding.
Genetic diversity estimates indicated that the wild and cultivated populations of accessions have maintained almost similar levels of expected heterozygosity (HE), suggesting that there has not been much divergence from centres of origin during cultivation. This generally agrees with the theory that breeding populations do not lose genetic diversity per se, but that artificial selection in a small population, such as a plant breeding population, is expected to increase the frequency of favourable alleles, along with the chance fixation of other less desirable and selectively neutral alleles (Fu et al. 2003; Fu 2015). One plausible explanation for similar levels of genetic diversity in wild and cultivated material is that a considerable proportion of the cultivated material was bred by crossing accessions from diverse locations followed by crossing to facilitate recombination in Australia and the USA (McWilliam and Latter 1970; Oram et al. 2009). Most phalaris cultivars are based on a considerable number of clones, apparently enough to maintain a level of diversity typical of unrestricted material. Maintenance of heterozygosity also likely reflects the short selection history in P. aquatica as well as a history of relatively low selection intensity.
Positive values for FIS (Table 2) suggest a level of inbreeding in this group of accessions and cultivars and this was supported by a deficiency of heterozygotes relative to Hardy–Weinberg expectations (HO < HE). Some inbreeding may have arisen from inadequate sampling numbers during original collection or seed increase. Owing to scarcity, seed was sometimes collected from very small numbers of plants in some expeditions (e.g. Neal-Smith 1955), although later expeditions specified 50–100 plants from areas of 1000–10000 m2 (Cunningham et al. 1997).
Relationships among countries may have been slightly affected by the number of accessions tested. More sampling of accessions from Turkey is required to confirm the placing of two Turkish accessions with countries considerably further west rather than closer to Greece and the Middle East. According to passport data, one of the Turkish accessions was collected on a field station and both were collected near major population centres, and it is possible that they derived from elsewhere.
Our finding of a much higher proportion of diversity within (71%) than among (29%) the nine subpopulations identified in our analysis of structure is strikingly similar to values found within and among accessions in other studies of Phalaris. Thus, the study of Mian et al. (2005) on P. aquatica germplasm found that 74% of the genetic diversity was within accessions and 26% among accessions. Similarly, within-accession variation accounted for 74.5% of genetic variation in wild accessions and 84.4% of variation in cultivated accessions in the related species, P. arundinacea (Jakubowski et al. 2011). These values are typical of outcrossing species (Nybom 2004). Our analysis clearly showed plentiful diversity both within and between subpopulations for recurrent selection schemes.
Centres of origin
Analysis of marker data employing dendrogram, cluster analysis, PCA and the pairwise genetic distant matrix presented a consistent pattern of diversity among wild accessions strongly correlated with their geographical position within the species distribution area, such that genetic distances were generally lowest between adjacent regions and highest between widely separated regions. This pattern, consistent with isolation by distance, suggests that P. aquatica behaves mostly as an endemic, naturally dispersed species in its region of origin rather than a species subjected to widespread, deliberate cultivation of selected strains. This interpretation contrasts with P. arundinacea, which was considered to lack strong geographical clustering and to show high levels of admixture through both natural and human dispersal (Jakubowski et al. 2011). Neal-Smith (1955) remarked on the complete absence in Europe and Africa of pasture areas sown to P. aquatica, other than small experimental plots, during his collection expedition, suggesting lack of deliberate cultivation. Although P. aquatica is undoubtedly utilised for grazing throughout its centre of origin, its domestication as a cultivated species has occurred elsewhere.
Our analyses provide strong evidence of population structure (six among wild accessions and nine including cultivated accessions), at the broadest scale between western and eastern clades separating at longitudes in the Italy–Greece region. While distinct north-west African and southern European subpopulations were identified within the western clade, genetic distances between groups and countries in north-west Africa and southern Europe indicated considerable genetic affinity (Tables 3, 4; Fig. S4). The far eastern subpopulation, Pop5 (Syria–Iraq–Azerbaijan), was the most genetically distinct of all subpopulations (Table 3). Notwithstanding this, cluster analysis also indicated a level of admixture between subpopulations of P. aquatica, suggesting natural spread probably with some human intervention. At the broadest level, the western clade showed more admixture from the eastern clade than vice versa. The eastern clade showed distant admixture from the western Mediterranean only in the Greece–Israel subpopulations. Historically, these regions have been highly interconnected by human activity, which may have contributed to the observed admixture most likely through unintentional transport. The most eastern subpopulation (Syria, Iraq, Azerbaijan) showed little admixture apart from a small amount with the adjacent subpopulations and displayed the lowest level of heterozygosity. This subpopulation is likely isolated by semi-arid or arid regions and by mountain barriers. The presence of three subpopulation clusters in north-west Africa, with two in Morocco and one in Algeria, was unexpected. The subpopulation from the High Atlas region of central Morocco showed little admixture, possibly due to isolation, whereas subpopulations from northern Morocco and Algeria showed clear admixture with the southern Europe subpopulation, probably due to historical human activity across the Mediterranean Sea. Consistent with this, some Portuguese and Spanish accessions showed affinity with African accessions.
Moroccan accessions grouped separately in the dendrograms, in agreement with Mian et al. (2005), and grouped at one end of the PCA diagram, but they appeared no more distinct from typical southern European P. aquatica than accessions from the eastern distribution of the species. Indeed, Moroccan subpopulations in our structure analysis showed some genetic affinity with the southern European subpopulations. Both eastern and western extremes of the P. aquatica distribution may be evolving away from southern European forms. We consider that the genomic evidence does not provide support for making the ‘hairy glumes’ forms of P. aquatica, most prominent in north-west African countries, a separate species. More exhaustive study of variation in the ‘hairy glumes’ form appears warranted based on the resolution of three subpopulations of P. aquatica in north-west Africa.
Domestication history
An important aim of this study was to examine the relationships of cultivated germplasm to wild germplasm and among the main breeding pools. The Australian, South American and New Zealand pools showed considerable relationship to each other. At least in part, this is because germplasm bred in Australia has been utilised in breeding programs elsewhere (Oram et al. 2009). The old New Zealand cultivar, Maru, grouped somewhat separately from the Australian type in the dendrogram and near to the Argentinian cultivar Castelar, but grouped with the Australian type in subpopulation 9 of the K = 9 Q-plot (Fig. 5). Cv. Castelar had considerable introgression from the broad-based winter-active cultivar subpopulation 4 in Fig. 5 (accession 65). CA1113, an ecotype collected in northern New Zealand, appears to be closely related to cv. Australian. Part of the US cultivated pool was differentiated from other cultivated material in the wild plus cultivated dendrogram and PCA. Cvv. AU1 and Oasis and three Noble Foundation breeding populations were distinct from other cultivars, and AU1 in particular showed more association with the eastern clade than do the Australian and South American pools. Programs in Australia, South America and New Zealand should consider whether to introduce new diversity from the eastern wild clade and from the US cultivated pool.
The western wild clade (Fig. 2) appears to have been much more heavily utilised in Australian cultivated germplasm than the eastern wild clade. As expected, cultivated accessions from Australia were grouped mainly into the Australian type related to southern European germplasm, the broad-based, winter-active type with more relationship to north-west African germplasm, and cultivars based entirely on north-west African germplasm. Moroccan subpopulations in particular showed low genetic distance to both broad-based cultivar groups dominated by cultivars bred in Australia, probably because of the emphasis placed on selection for high seedling vigour and winter growth, which is found in Moroccan accessions (McWilliam and Latter 1970; Oram et al. 2009). Broad-based cultivars with and without expression of intact-rachilla seed retention were relatively close in the wild plus cultivated dendrogram (Fig. 4) but formed separate subpopulations in the cluster analysis (Fig. 5). If genomic selection is to be applied to these cultivars, then certainly the Australian type and even the different seed retention groups within the broad-based cultivars may need to be considered separately when forming training populations.
Finally, we hoped that this study would shed light on the origin of the early introduction to Australia. Cv. Australian was grouped near Italian and Sardinian accessions in the dendrogram and Q-plot (Figs 4 and 5, respectively) but also near to an accession from each of Algeria, Portugal and Turkey in the dendrogram, and from these countries and Spain in subpopulation 9 in the Q-plot. The nearest wild accession in the dendrogram, CPI19299 from Algeria, was described in passport data as being tall with poor basal leaf, a distinct contrast with cv. Australian, which is not tall compared with some other ecotypes and has strong basal leaf. Our study suggests a southern European origin is likely but nothing more specific.
Conflicts of interest
The authors declare that they have no conflicts of interest.
Declaration of funding
This work was funded by the Meat & Livestock Australia Pre-breeding in Phalaris Project No. B.PBE.0038 and CSIRO Project SIP 311. These supporting sources had no involvement in the preparation of the data or manuscript or the decision to submit for publication.
Data availability statement
The data that support this study will be shared on reasonable request to the corresponding author.
Acknowledgements
James Sewell, formerly PGG Wrightson Seeds Australia, was involved in discussions during the planning phase of the project. We thank contributing institutions for access to seed of germplasm. Mike Trammell, Noble Research Institute, supplied details on breeding lines. Special thanks to Drs James Kijas and David Bush of CSIRO for their constructive suggestions that improved the manuscript.
References
Abbasov M, Sansaloni CP, Burgueno J, Petroli CD, Akparov Z, Aminov N, Babayeva S, Izzatullayeva V, Hajiyev E, Rustamov K, Mammadova SA, Amri A, Payne T (2020) Genetic diversity analysis using DArTseq and SNP markers in populations of Aegilops species from Azerbaijan. Genetic Resources and Crop Evolution 67, 281–291.| Genetic diversity analysis using DArTseq and SNP markers in populations of Aegilops species from Azerbaijan.Crossref | GoogleScholarGoogle Scholar |
Adams TE, Love RM, MacLauchlan RS (1974) Registration of Perla koleagrass. Crop Science 14, 339
| Registration of Perla koleagrass.Crossref | GoogleScholarGoogle Scholar |
Alam M, Neal J, O’Connor K, Kilian A, Topp B (2018) Ultra-high-throughput DArTseq-based SilicoDArT and SNP markers for genomic studies in macadamia. PLoS One 13, e0203465
| Ultra-high-throughput DArTseq-based SilicoDArT and SNP markers for genomic studies in macadamia.Crossref | GoogleScholarGoogle Scholar | 30592720PubMed |
Anderson DE (1961) Taxonomy and distribution of the genus Phalaris. Iowa State Journal of Science 36, 1–96.
Baillie RC, Drayton MC, Pembleton LW, Kaur S, Culvenor RA, Smith KF, Spangenberg GC, Forster JW, Cogan NOI (2017) Generation and characterisation of a reference transcriptome for phalaris (Phalaris aquatica L.). Agronomy 7, 14
| Generation and characterisation of a reference transcriptome for phalaris (Phalaris aquatica L.).Crossref | GoogleScholarGoogle Scholar |
Baldini RM (1993) The genus Phalaris L. (Gramineae) in Italy. Webbia 47, 1–53.
| The genus Phalaris L. (Gramineae) in Italy.Crossref | GoogleScholarGoogle Scholar |
Baldini RM (1995) Revision of the genus Phalaris L. (Gramineae). Webbia 49, 265–329.
| Revision of the genus Phalaris L. (Gramineae).Crossref | GoogleScholarGoogle Scholar |
Bolibok-Brągoszewska H, Targońska M, Bolibok L, Kilian A, Rakoczy-Trojanowska M (2014) Genome-wide characterization of genetic diversity and population structure in Secale. BMC Plant Biology 14, 184
| Genome-wide characterization of genetic diversity and population structure in Secale.Crossref | GoogleScholarGoogle Scholar | 25085433PubMed |
Carlson IT, Oram RN, Surprenant J (1996) Reed canarygrass and other Phalaris species. In ‘Cool-season forage grasses’. (Eds LE Moser, DR Buxton, MD Casler) pp. 569–604. (ASA, CSSA, SSSA: Madison, WI, USA)
Cooper JP, McWilliam JR (1966) Climatic variation in forage grasses. II. Germination, flowering and leaf development in Mediterranean populations of Phalaris tuberosa. Journal of Applied Ecology 3, 191–212.
| Climatic variation in forage grasses. II. Germination, flowering and leaf development in Mediterranean populations of Phalaris tuberosa.Crossref | GoogleScholarGoogle Scholar |
Cruz VM, Kilian A, Dierig DA (2013) Development of DArT marker platforms and genetic diversity assessment of the U.S. collection of the new oilseed crop lesquerella and related species. PLoS One 8, e64062
| Development of DArT marker platforms and genetic diversity assessment of the U.S. collection of the new oilseed crop lesquerella and related species.Crossref | GoogleScholarGoogle Scholar | 23724020PubMed |
Cunningham PJ, Graves WL, Chakroun M, Mezni MY, Saidi S, Bounejmate M, Porqueddu C, Reed KFM (1997) Novel perennial forage germplasm from North Africa and Sardinia. Australian Plant Introduction Reviews 27, 13–46.
Dolezel J, Bartos J (2005) Plant DNA flow cytometry and estimation of nuclear genome size. Annals of Botany 95, 99–110.
| Plant DNA flow cytometry and estimation of nuclear genome size.Crossref | GoogleScholarGoogle Scholar | 15596459PubMed |
Edet OU, Gorafi YSA, Nasuda S, Tsujimoto H (2018) DArTseq-based analysis of genomic relationships among species of tribe Triticeae. Scientific Reports 8, 16397
| DArTseq-based analysis of genomic relationships among species of tribe Triticeae.Crossref | GoogleScholarGoogle Scholar | 30401925PubMed |
Elshire RJ, Glaubitz JC, Sun Q, Poland JA, Kawamoto K, Buckler ES, Mitchell SE (2011) A robust, simple genotyping-by-sequencing (GBS) approach for high diversity species. PLoS One 6, e19379
| A robust, simple genotyping-by-sequencing (GBS) approach for high diversity species.Crossref | GoogleScholarGoogle Scholar | 21573248PubMed |
Farahani S, Maleki M, Mehrabi R, Kanouni H, Scheben A, Batley J, Talebi R (2019) Whole genome diversity, population structure, and linkage disequilibrium analysis of chickpea (Cicer arietinum L.) genotypes using genome-wide DArTseq SNP markers. Genes 10, 676
| Whole genome diversity, population structure, and linkage disequilibrium analysis of chickpea (Cicer arietinum L.) genotypes using genome-wide DArTseq SNP markers.Crossref | GoogleScholarGoogle Scholar |
Frankham R, Ballou JD, Briscoe DA (2002) ‘Introduction to conservation genetics.’ (Cambridge University Press: Cambridge, UK)
Frichot E, Francois O (2015) LEA: an R package for landscape and ecological association studies. Methods in Ecology and Evolution 6, 925–929.
| LEA: an R package for landscape and ecological association studies.Crossref | GoogleScholarGoogle Scholar |
Frichot E, Mathieu F, Trouillon T, Bouchard G, François O (2014) Fast and efficient estimation of individual ancestry coefficients. Genetics 196, 973–983.
| Fast and efficient estimation of individual ancestry coefficients.Crossref | GoogleScholarGoogle Scholar | 24496008PubMed |
Fu Y (2015) Understanding crop genetic diversity under modern plant breeding. Theoretical and Applied Genetics 128, 2131–2142.
| Understanding crop genetic diversity under modern plant breeding.Crossref | GoogleScholarGoogle Scholar | 26246331PubMed |
Fu YB, Peterson GW, Scoles G, Rossnagel B, Schoen DJ, Richards KW (2003) Allelic diversity changes in 96 Canadian oat cultivars released from 1886 to 2001. Crop Science 43, 1989–1995.
| Allelic diversity changes in 96 Canadian oat cultivars released from 1886 to 2001.Crossref | GoogleScholarGoogle Scholar |
Gondro C (2015) ‘Primer to analysis of genomic data Using R.’ (Springer International Publishing: Cham, Switzerland)
Guthridge KM, Dupal MP, Kölliker R, Jones ES, Smith KF, Forster JW (2001) AFLP analysis of genetic diversity within and between populations of perennial ryegrass (Lolium perenne L.). Euphytica 122, 191–201.
| AFLP analysis of genetic diversity within and between populations of perennial ryegrass (Lolium perenne L.).Crossref | GoogleScholarGoogle Scholar |
Hartl DL, Clark AG (2007) ‘Principles of population genetics.’ 4th edn. (Sinauer Associates: Sunderland, MA, USA)
Hopkins A, Saha M, Zhou L (2006) The Noble Foundation hardinggrass (Phalaris aquatica) breeding program. In ‘Proceedings of the 13th Australasian Plant Breeding Conference’. 18–21 April 2006 Christchurch, New Zealand. (Ed. CF Mercer) pp. 548–551. (New Zealand Grassland Association)
Hoveland CS, Haarland RL, Berry CD, Pedersen JF (1982) Oasis phalaris, a new cool season perennial grass. Alabama Agricultural Experiment Station Circular 259. Auburn University, Auburn, AL, USA.
Jakubowski AR, Jackson RD, Johnson RC, Hu J, Casler MD (2011) Genetic diversity and population structure of Eurasian populations of reed canarygrass: cytotypes, cultivars, and interspecific hybrids. Crop & Pasture Science 62, 982–991.
| Genetic diversity and population structure of Eurasian populations of reed canarygrass: cytotypes, cultivars, and interspecific hybrids.Crossref | GoogleScholarGoogle Scholar |
Jenkin TJ, Sethi BL (1932) Phalaris arundinacea, Ph. tuberosa, their F1 hybrids and hybrid derivatives. Journal of Genetics 26, 1–38.
| Phalaris arundinacea, Ph. tuberosa, their F1 hybrids and hybrid derivatives.Crossref | GoogleScholarGoogle Scholar |
Karapatsia A, Penglou G, Pappas I, Kiparissides C (2014) Bioethanol production via the fermentation of Phalaris aquatica L. hydrolysate. Chemical Engineering Transactions 37, 289–294.
Kaur S, Francki MG, Forster JW (2012) Identification, characterization and interpretation of single-nucleotide sequence variation in allopolyploid crop species. Plant Biotechnology Journal 10, 125–138.
| Identification, characterization and interpretation of single-nucleotide sequence variation in allopolyploid crop species.Crossref | GoogleScholarGoogle Scholar | 21831136PubMed |
Kilian A, Huttner E, Wenzl P, Jaccoud D, Carling J, et al. (2005) The fast and the cheap: SNP and DArT-based whole genome profiling for crop improvement. In ‘In the wake of the double helix: from the green revolution to the gene revolution. Proceedings of International Congress’. 27–31 May 2003, Bologna, Italy. (Eds R Tuberosa, RL Phillips, M Gale) pp. 443–461. (Avenue Media: Bologna, Italy)
Kilian A, Wenzl P, Huttner E, Carling J, Xia L, Blois H, Caig V, et al (2012) Diversity arrays technology: a generic genome profiling technology on open platforms. Methods in Molecular Biology 888, 67–89.
| Diversity arrays technology: a generic genome profiling technology on open platforms.Crossref | GoogleScholarGoogle Scholar | 22665276PubMed |
Kim J, Park H (2011) Fast nonnegative matrix factorization: an active-set-like method and comparisons. SIAM Journal of Computer Science 33, 3261–3281.
| Fast nonnegative matrix factorization: an active-set-like method and comparisons.Crossref | GoogleScholarGoogle Scholar |
Kopecký D, Bartoš J, Christelová P, Černoch V, Kilian A, Doležel J (2011) Genomic constitution of Festuca × Lolium hybrids revealed by the DArTFest array. Theoretical and Applied Genetics 122, 355–363.
| Genomic constitution of Festuca × Lolium hybrids revealed by the DArTFest array.Crossref | GoogleScholarGoogle Scholar | 20872131PubMed |
Latter BDH (1965) Quantitative genetic analysis in Phalaris tuberosa. II. Assortative mating and maternal effects in the inheritance of date of ear emergence, seed weight and seedling growth rate. Genetical Research 6, 371–386.
| Quantitative genetic analysis in Phalaris tuberosa. II. Assortative mating and maternal effects in the inheritance of date of ear emergence, seed weight and seedling growth rate.Crossref | GoogleScholarGoogle Scholar |
Liu S, Feuerstein U, Luesink W, Schulze S, Asp T, Studer B, Becker H, Dehmer KJ (2018) DArT, SNP, and SSR analyses of genetic diversity in Lolium perenne L. using bulk sampling. BMC Genetics 19, 10
| DArT, SNP, and SSR analyses of genetic diversity in Lolium perenne L. using bulk sampling.Crossref | GoogleScholarGoogle Scholar | 29357832PubMed |
McWilliam JR, Gibbon CN (1981) Selection for seed retention in Phalaris aquatica L. In ‘Proceedings of the XIV International Grassland Congress’. 15-24 June 1981. Lexington, KY, USA. (Eds JA Smith, VM Hays) pp. 269–272. (International Grassland Congress)
McWilliam JR, Latter BDH (1970) Quantitative genetic analysis in Phalaris and its breeding implications. Theoretical and Applied Genetics 40, 63–72.
| Quantitative genetic analysis in Phalaris and its breeding implications.Crossref | GoogleScholarGoogle Scholar | 24435673PubMed |
McWilliam JR, Schroeder HE (1965) Seedmaster: a new cultivar of phalaris with high seed retention. Journal of the Australian Institute of Agricultural Science 31, 313–315.
McWilliam JR, Schroeder HE, Marshall DR, Oram RN (1971) Genetic stability of Australian phalaris (Phalaris tuberosa L.) under domestication. Australian Journal of Agricultural Research 22, 895–908.
| Genetic stability of Australian phalaris (Phalaris tuberosa L.) under domestication.Crossref | GoogleScholarGoogle Scholar |
Mian MAR, Zwonitzer JC, Chen Y, Saha MC, Hopkins AA (2005) AFLP diversity within and among hardinggrass populations. Crop Science 45, 2591–2597.
| AFLP diversity within and among hardinggrass populations.Crossref | GoogleScholarGoogle Scholar |
Neal-Smith CA (1955) Report on herbage plant exploration in the Mediterranean region. FAO Report No. 415. Food and Agriculture Organization of the United Nations, Rome.
Nei M (1978) Estimation of average heterozygosity and genetic distance from a small number of individuals. Genetics 89, 583–590.
| Estimation of average heterozygosity and genetic distance from a small number of individuals.Crossref | GoogleScholarGoogle Scholar | 17248844PubMed |
Nybom H (2004) Comparison of different nuclear DNA markers for estimating intraspecific genetic diversity in plants. Molecular Ecology 13, 1143–1155.
| Comparison of different nuclear DNA markers for estimating intraspecific genetic diversity in plants.Crossref | GoogleScholarGoogle Scholar | 15078452PubMed |
Oram RN, Schroeder HE (1992) Register of Australian Herbage Plant Cultivars A. Grasses 3. Phalaris (a) Phalaris aquatica L. (phalaris) cv. Holdfast. Australian Journal of Experimental Agriculture 32, 261–262.
| Register of Australian Herbage Plant Cultivars A. Grasses 3. Phalaris (a) Phalaris aquatica L. (phalaris) cv. Holdfast.Crossref | GoogleScholarGoogle Scholar |
Oram RN, Ferreira V, Culvenor RA, Hopkins AA, Stewart A (2009) The first century of Phalaris aquatica L. cultivation and genetic improvement: a review. Crop & Pasture Science 60, 1–15.
| The first century of Phalaris aquatica L. cultivation and genetic improvement: a review.Crossref | GoogleScholarGoogle Scholar |
Pappas IA, Koukoura Z, Tananaki C, Goulas C (2014) Effect of dilute acid pretreatment severity on the bioconversion efficiency of Phalaris aquatica lignocellulose biomass into fermentable sugars. Bioresource Technology 166, 395–402.
| Effect of dilute acid pretreatment severity on the bioconversion efficiency of Phalaris aquatica lignocellulose biomass into fermentable sugars.Crossref | GoogleScholarGoogle Scholar | 24929811PubMed |
Patterson N, Price AL, Reich D (2006) Population structure and eigen-analysis. PLOS Genetics 2, e190
| Population structure and eigen-analysis.Crossref | GoogleScholarGoogle Scholar | 17194218PubMed |
Pedersen JF, Hoveland CS, Haaland RL, Berry CD (1983) Registration of AU Oasis phalaris. Crop Science 23, 597
| Registration of AU Oasis phalaris.Crossref | GoogleScholarGoogle Scholar |
Pedersen JF, Berry CD, Haaland RL, Hoveland CS (1984) Registration of AU-1 phalaris germplasm. Crop Science 24, 626
| Registration of AU-1 phalaris germplasm.Crossref | GoogleScholarGoogle Scholar |
Pritchard JK, Stephens M, Donnelly P (2000) Inference of population structure using multilocus genotype data. Genetics 155, 945–959.
| Inference of population structure using multilocus genotype data.Crossref | GoogleScholarGoogle Scholar | 10835412PubMed |
Putievsky E, Oram RN, Malafant K (1980) Chromosomal differentiation among ecotypes of Phalaris aquatica L. Australian Journal of Botany 28, 645–657.
| Chromosomal differentiation among ecotypes of Phalaris aquatica L.Crossref | GoogleScholarGoogle Scholar |
Raman H, Raman R, Kilian A, Detering F, Carling J, et al (2014) Genome-wide delineation of natural variation for pod shatter resistance in Brassica napus. PLoS One 9, e101673
| Genome-wide delineation of natural variation for pod shatter resistance in Brassica napus.Crossref | GoogleScholarGoogle Scholar | 25006804PubMed |
Rumball W (1980) Phalaris aquatica cv. ‘Grasslands Maru’. New Zealand Journal of Experimental Agriculture 8, 267–271.
| Phalaris aquatica cv. ‘Grasslands Maru’.Crossref | GoogleScholarGoogle Scholar |
Sansaloni C, Petroli C, Jaccoud D, Carling J, Detering F, Grattapaglia D, Kilian A (2011) Diversity Arrays Technology (DArT) and next generation sequencing combined: genome-wide, high throughput, highly informative genotyping for molecular breeding of Eucalyptus. BMC Proceedings 5, P54
| Diversity Arrays Technology (DArT) and next generation sequencing combined: genome-wide, high throughput, highly informative genotyping for molecular breeding of Eucalyptus.Crossref | GoogleScholarGoogle Scholar |
Scurfield G, Biddiscombe EF (1966) Variation in Phalaris tuberosa L. Australian Journal of Agricultural Research 17, 17–28.
| Variation in Phalaris tuberosa L.Crossref | GoogleScholarGoogle Scholar |
Trumble HC (1935) A note on the origin of ‘Toowoomba canary grass’ (Phalaris tuberosa L.). Journal of the Council for Scientific and Industrial Research (Australia) 8, 195–202.
Voshell SM, Hilu KW (2014) Canary grasses (Phalaris, Poaceae): biogeography, molecular dating and the role of floret structure in dispersal. Molecular Ecology 23, 212–224.
| Canary grasses (Phalaris, Poaceae): biogeography, molecular dating and the role of floret structure in dispersal.Crossref | GoogleScholarGoogle Scholar | 24206057PubMed |
Voshell SM, Baldini RM, Kumar R, Tatalovich N, Hilu KW (2011) Canary grasses (Phalaris, Poaceae): molecular phylogenetics, polyploidy and floret evolution. Taxon 60, 1306–1316.
| Canary grasses (Phalaris, Poaceae): molecular phylogenetics, polyploidy and floret evolution.Crossref | GoogleScholarGoogle Scholar |
Wright S (1978) ‘Evolution and the genetics of populations. Vol. 4. Variability within and among natural populations.’ (University of Chicago Press: Chicago, IL, USA)
Xiong Y, Xiong Y, Jia S, Ma X (2020) The complete chloroplast genome sequencing and comparative analysis of reed canary grass (Phalaris arundinacea) and hardinggrass (P. aquatica). Plants 9, 748
| The complete chloroplast genome sequencing and comparative analysis of reed canary grass (Phalaris arundinacea) and hardinggrass (P. aquatica).Crossref | GoogleScholarGoogle Scholar |
Appendix 1. Information on cultivated germplasm with abbreviated names used in dendrograms

|

|