

BARA: cellular automata simulation of multidimensional smouldering in peat with horizontally varying moisture contents
Dwi M. J. Purnomo A , Eirik G. Christensen A , Nieves Fernandez-Anez B and Guillermo Rein A *
A *
A
B
Abstract
Smouldering peatland wildfires can last for months and create a positive feedback for climate change. These flameless, slow-burning fires spread horizontally and vertically and are strongly influenced by peat moisture content. Most models neglect the non-uniform nature of peat moisture.
We conducted a computational study into the spread behaviour of smouldering peat with horizontally varying moisture contents.
We developed a discrete cellular automaton model called BARA, and calibrated it against laboratory experiments.
BARA demonstrated high accuracy in predicting fire spread under non-uniform moisture conditions, with >80% similarity between observed and predicted shapes, and captured complex phenomena. BARA simulated 1 h of peat smouldering in 3 min, showing its potential for field-scale modelling.
Our findings demonstrate: (i) the critical role of moisture distribution in determining smouldering behaviour; (ii) incorporating peat moisture distribution into BARA’s simple rules achieved reliable predictions of smouldering spread; (iii) given its high accuracy and low computational requirement, BARA can be upscaled to field applications.
BARA contributes to our understanding of peatland wildfires and their underlying drivers. BARA could form part of an early fire warning system for peatland.
Keywords: cellular automata, climate change, fire, hydrology, modelling, peat moisture, peatlands, wildfires.
Introduction
Smouldering is a flameless and slow-burning fire that spreads both horizontally and vertically and occurs at a lower temperature than flaming combustion (Rein 2013). Owing to these differences, smouldering peatland wildfires produce haze that spreads to inhabited regions and affects people’s health (Rein 2013; Huang et al. 2015; Hu et al. 2018). These wildfires create positive feedbacks to climate change by releasing carbon that is naturally stored in peat and cannot be reabsorbed by the ecosystem (Johnston et al. 2012; Rein 2013; Turetsky et al. 2015).
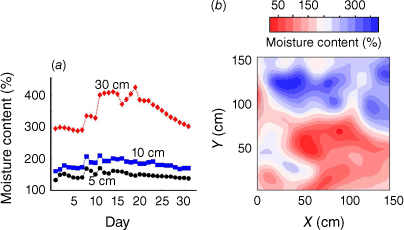
Peat moisture content (MC) is widely recognised as the primary factor influencing smouldering peatland wildfires (Rein 2013; Mezbahuddin et al. 2023), as it affects ignition limits and spread rates (Frandsen 1987; Huang et al. 2015; Christensen et al. 2020). In peatlands, the peat MC varies both spatially (horizontally and vertically) and temporally (Meingast et al. 2014; Prat-Guitart et al. 2016, 2017). These MC variations are influenced by topography, surface vegetation, hydrological processes and weather conditions (Prat-Guitart et al. 2016, 2017; Bechtold et al. 2020). Vertically, peat is wetter at deeper points owing to their proximity to the groundwater table (GWT) (Fig. 1a). Horizontally, variations in peat MC are more intricate (Fig. 1b) and influenced by factors such as topography and surface vegetation (Prat-Guitart et al. 2017).
(a) Peat MC measured at three different depths, 5, 10 and 30 cm, within a 30-day period in a peatland in New Zealand. This MC profile was extracted from the work of Campbell et al. (2002). (b) Horizontal MC variations (top view) observed in a peatland in Ireland. This MC profile was extracted from the work of Prat-Guitart et al. (2017).
The complex interplay of MC variations has hindered the development of modelling studies focusing on smouldering peat with spatially varying MCs. To date, studies involving spatially varying MCs in smouldering peat models have been constrained by the complexities associated with multi-dimensional spread (Huang and Rein 2015; Prat-Guitart et al. 2016). However, given the significant influence of peat MC on smouldering behaviour, there is a need to overcome these challenges and advance our understanding of the phenomenon.
Considering these complexities at a large scale, computational studies of smouldering using physics-based models such as computational fluid dynamics are too expensive (Purnomo 2022; Yuan et al. 2023). Therefore, in the present work, we explored cellular automata (CA). CA are discrete models that use simple rules and limit the interactions of entities within a domain (von Neumann 1967; Wolfram 1984). Unlike physics-based models that use fundamental principles for their rules, CA can use a number of approaches, such as empirical and statistical, as the governing rules.
CA consider a grid of cells, each of which has a certain state (e.g. peat, smouldering, or burnt) that is updated over discrete time steps. Each cell in CA affects only a few neighbouring cells, whereas in physics-based models, each cell could affect all the cells in the grid; thus, the number of computations in CA can be minimal. By using simple rules and limiting the reach of interactions between cells, CA provide a computationally efficient way to simulate complex phenomena; they require fewer resources but can achieve equivalent results.
CA have been extensively used to model wildfires, and many aspects and phenomena (e.g. crown fire, firebrands) have been successfully simulated by implementing different rules (Clarke et al. 1994; Karafyllidis and Thanailakis 1997; Malamud et al. 1998; Alexandridis et al. 2011; Collin et al. 2011; Trunfio et al. 2011; Ntinas et al. 2017). Unlike flaming fires, smouldering fires have been the focus of few studies involving the application of CA (Belcher et al. 2010; Fernandez-Anez et al. 2017, 2019; Purnomo et al. 2021, 2023; Widyastuti et al. 2021).
Among these works, only heat accumulation and bond percolation approaches (see details in Purnomo 2022) have been used for the rules in CA. In heat accumulation CA, each cell has an intrinsic value on which its state is based. A cell changes state when its intrinsic value exceeds a threshold (Purnomo 2022). The intrinsic value of each cell is updated depending on the intrinsic values of neighbouring cells. In bond percolation CA, a cell changes state probabilistically when conditions are met (e.g. making contact with a cell with a different state; Purnomo 2022).
The model in Belcher et al. (2010) used bond percolation CA to simulate smouldering peat with uniform and constant MC. This model took into account the probability of ignition and extinction, which were dependent on the oxygen concentration. It was designed to explore fire activity over millennia, based on variations in Earth’s oxygen concentration.
The model in Fernandez-Anez et al. (2017, 2019) used heat accumulation CA and considered drying, pyrolysis and oxidation thresholds, mimicking the physical phenomena of smouldering. This model focused on uniformly moist peat and investigated smouldering behaviour under different conditions, including downwind, upwind and limited oxygen concentrations.
The model in Widyastuti et al. (2021) used an agent-based method that is similar to bond percolation CA to simulate peatland wildfires at the field scale, encompassing both flaming and smouldering. This model considered peat MC and GWT to determine the associated probabilities. However, it only examined the effects of uniform and constant peat MC and GWT, without considering their spatial and temporal variations.
The model in Purnomo et al. (2021) also used bond percolation CA to simulate field-scale peatland wildfires that considered both flaming and smouldering. The probabilities involved in the model were calibrated against a semi-physical model and experiments. The model also investigated the impact of peat MC on smouldering severity, but did not account for variations in MC.
Building on their earlier work, Purnomo et al. (2023) advanced the model in Purnomo et al. (2021) by incorporating temporal variations in peat MC. This updated model explored the effects of such variations on smouldering severity over extended periods. However, the spatial variations in peat MC were not considered in this particular model.
Existing literature on CA models for smouldering predominantly focuses on uniform MC. Furthermore, these models solely address the horizontal spread of smouldering, neglecting its vertical spread. The current paper presents a novel approach by utilising CA to simulate smouldering peat with horizontally varying MCs, while also incorporating its multidimensional spread. This is the first study to consider both the spatial variability in MC and the comprehensive spread of smouldering within a CA framework.
Methods
The cellular automata model
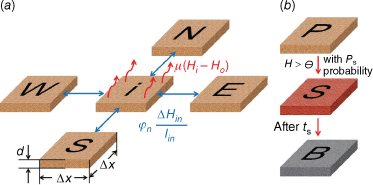
In this work, we developed a CA model to simulate the multidimensional spread of smouldering peat (not a 3D model in its full essence to minimise computational cost) with horizontally varying MCs. From here on, we refer to the model in this work as BARA, which originates from the term for ‘smouldering’ in Indonesian. BARA integrates a heat accumulation approach to model heat transfer (mimicking heat transfer from burning fuel to unburnt fuel) and a bond percolation approach to introduce uncertainty (related to the variability in nature, e.g. caused by landscape heterogeneity), adapted from Fernandez-Anez et al. (2019); thus, BARA is a stochastic model. In BARA, the intrinsic values of cells were updated every time step based on the intrinsic values of their neighbours, and the states of cells were updated probabilistically when their intrinsic values exceeded predetermined thresholds. We used the von Neumann neighbourhood (simplest neighbourhood to minimise computational cost), which includes the four cells adjacent to the centre cell: north (N), south (S), west (W) and east (E) as shown in Fig. 2a (see Table 1 for the information of variables in the figure).
(a) Schematic of the rules in BARA. Subscript (n) represents the neighbour’s position relative to the centre cell (i), i.e. north (N), south (S), east (E) and west (W). Straight arrows represent the heat transfer to neighbours. Curvy arrows represent the heat loss to the surroundings. (b) Schematic of the state change in BARA from peat (P) to smouldering (S) to burnt out (B). The state change from peat to smouldering occurs when H exceeds Θ with a probability of Ps. Smouldering cells remain in that state for a time period ts after which they become burnt out.
States and rules of BARA
BARA considers three states: peat (P), smouldering (S) and burnt out (B). These states represent simplified stages of smouldering fire. In physical terms, the peat state represents undisturbed peat that can transition to the smouldering state when it is burning. Once the full depth of peat is consumed, smouldering cells are extinguished, and cells change to the burnt out state. Each cell in BARA has an intrinsic value (H) at any given time, which in this work is referred to as a heat value, analogous to temperature in physical terms. Information on the states and heat values of cells is stored in two different computational layers, the fuel and heat layers, adapted from Fernandez-Anez et al. (2019). This multi-layer approach enables BARA to imitate the physics of combustion. The fuel layer mimics the evolution of fuel during the combustion (e.g. unburnt fuel, oxidation), and the heat layer mimics the heat transfer in fires based on the temperature distribution.
The state change from peat to smouldering depends on the H values of cells: when the H values exceed the burning threshold (Θ), the peat cells change to smouldering with a probability of Ps (smouldering probability). The H values of cells are affected by the sum of H received from or given to neighbouring cells (Ht). If Ht is greater than zero, then heat is given to the neighbours (n); otherwise, heat is received from the neighbours to the centre cell (i). The value of Ht depends on the difference in H between the cell and its neighbouring cells, the number of cells separating the two cells (Δl) and the heat transfer coefficient (φ), as shown in Eqn 1 (see further details in Supplementary Appendix B). However, because we used the von Neumann neighbourhood, the value of Δlin in Eqn 1 was set to 1. φ determines the fraction of ΔH transferred to neighbouring cells, which mimics heat transfer coefficients in physical terms. This heat transfer depends on the neighbouring cells involved in the process; therefore, in spatially non-uniform cases, different neighbouring cells have different ΔH and φ.
Heat loss to the surroundings is also considered in BARA and depends on the difference between the H values of cells and the H value of the ambient environment (Ho), and the heat loss coefficient (µ). Ho is held constant at zero for simplification purposes, but in nature, ambient conditions are not constant. At every time step, an amount of heat (µH) is lost from each cell to the surroundings, representing the heat loss due to convection and radiation. In general, µ depends on wind and surface shape, but it was set constant for simplicity. These heat transfer rules are summarised in Fig. 2a.
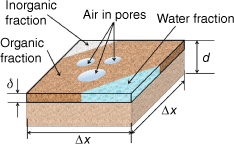
We implemented a novel method to introduce the vertical spread in BARA in addition to the 2D horizontal spread of Fernandez-Anez et al. (2019). The thickness of peat in a cell (d) decreases with time while burning owing to the vertical spread that consumes it vertically (Fig. 2a). A peat cell contains inorganic and organic matter, water and air (see Fig. 3), where organic matter is the only combustible component. A peat cell contains water and inorganic matter because peat in nature is wet and has impurities from mineral content. As peat is a porous medium, air occupies its pores; thus, the peat cell has an air component. Every time step while a cell smoulders, its organic fraction is consumed by a thickness δ. The fire completely consumes one cell of peat when the product of the number of time step and δ is equal to d. This is implemented by using a smouldering time variable (ts). Once peat cells become smouldering cells, they continue to burn for a time ts. Smouldering cells become burnt out after ts is reached (Fig. 2b). During ts, a smouldering cell generates an amount of heat QR in every time step, increasing H; this process reproduces the heat generation of fire. However, for simplicity, QR was set to depend only on the organic faction. Table 1 summarises variables and parameters used in BARA.
The components present in any one cell in BARA: each cell in the model contains organic and inorganic matter, water and air. In every time step in smouldering cells, peat with a thickness δ is consumed by the fire.
| Variable and parameters | Symbol | Unit | |
|---|---|---|---|
| Smouldering time in BARA | ts | s | |
| Heat release rate in BARA | QR | Non-dimensional | |
| Heat transfer coefficient in BARA | φ | Non-dimensional | |
| Burning threshold in BARA | Θ | Non-dimensional | |
| Heat loss coefficient in BARA | µ | Non-dimensional | |
| Smouldering probability in BARA | Ps | Non-dimensional | |
| Time step | Δt | s | |
| Cell size | Δx | mm | |
| Horizontal spread rate | SH | mm/min | |
| Vertical spread rate | Sd | mm/min | |
| Smouldering width | WS | mm/min | |
| Moisture content | MC | Non-dimensional | |
| Inorganic content | IC | Non-dimensional | |
| Reactor thickness | d | mm | |
| Bulk density | ρb | kg/m3 | |
| Organic density | ρo | kg/m3 | |
| Specific heat | c | kJ/kg K | |
| Thermal conductivity | k | W/m K |
Sensitivity analysis
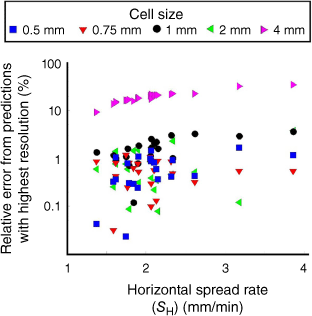
The variables used in BARA were selected based on calibration against laboratory experiments. However, prior to this calibration, we performed a sensitivity analysis to determine the importance of each variable and the range of variable values that enable the predictions to fit experimental results. Both sensitivity analysis and calibration were undertaken in a 400 × 400 cell grid, where the cell size (Δx) was 1 mm and d was 1.6 cm (see Fig. 2a). This domain simulated the experiments used for calibration (40 × 40 × 1.6 cm) in Christensen et al. (2020). The cell size selected was the coarsest size that has a small difference (less than 10%) in predictions against the predictions by using the tested finest cell size (0.4 mm, see Fig. 4). One time step (Δt) in BARA represents 20 s in real time, which was selected to satisfy the stability criteria given the spatial resolution (Δx).
Sensitivity analysis of BARA for different cell sizes. BARA was run using different cell sizes, and the predicted horizontal spread rates (SH) of each scenario (one scenario means one cell size) were compared against the prediction when using a cell size of 0.4 mm (highest resolution tested). The variation in SH is within 5% when the cell size is smaller than 2 mm. From this analysis, a cell size (Δx) of 1 mm was selected for BARA.
The six variables in BARA (Ps, φ, QR, ts, Θ and µ) were arranged into four groups of three variables. For the sake of efficiency and simplicity, the sensitivity analysis was performed by exploring combinations of three variables (instead of six), setting the other three as constants, and was performed four times. The variables were grouped as follows: Group 1 (Ps, φ and Θ); Group 2 (QR, φ and Θ); Group 3 (ts, φ and Θ), and Group 4 (µ, φ, and Θ). These groups were considered because Ps, QR, ts and µ have independent effects on predictions (the change in one variable cannot be compensated for by a change of the other variable to obtain an equal prediction), whereas the effects of φ and Θ on predictions are dependent on one another (the change of one variable can be compensated for by a change of the other variable to obtain an equal prediction).
The sensitivity analysis is based on smouldering spread rate and smouldering width. Thus, the set of values of the variables that enable BARA to give spread rate and smouldering width similar to the experiments of Christensen et al. (2020) were explored. Smouldering width is the distance between unburnt and burnt lines that comprise the smouldering perimeter. This is an important parameter because it represents the vertical spread rate of smouldering (Christensen et al. 2020).
Results
The sensitivity analysis of Group 1 (see Supplementary Fig. A1) shows that high Ps values made BARA predict non-circular spread (see Fig. 5), whereas low Ps values made BARA predict no ignition; the range of usable Ps values is narrow (0.08–0.15). Ps was then set to 0.1, at the centre of this narrow range.
Results from BARA simulation of smouldering peat, with 20% MC and 20% IC, both the expected circular ring result (left) and the unexpected non-circular result (right). P is peat, S is smouldering and B is burnt out.
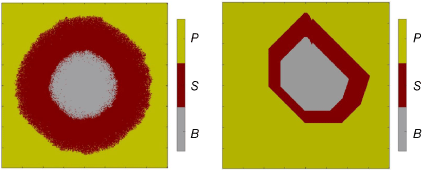
Fig. 6 shows the sensitivity analysis of Groups 2 and 3 on horizontal spread rate and smouldering width compared with the values measured in Christensen et al. (2020). In this figure, black regions represents non-circular spread. From the sensitivity analysis of Group 2 (see Fig. 6a), the range of φ values that enables BARA to predict correctly is from 0.05 to 0.2; lower values caused no ignition, whereas higher values cause the shape to be non-circular. This reasoning was also adopted to determine the valid range for Θ, which was found to be 0.01–0.2. An increase in QR increases the horizontal spread rate (SH). The minimum value of QR was set to 1 (corresponding to the ranges of φ and Θ values), whereas its upper limit was not found. Of the circular pattern predictions, a wide range of spread rates can be predicted by BARA by using different values of QR, φ and Θ. However, none of the combinations of variables in Group 2 can simulate all the smouldering widths (WS) measured in Christensen et al. (2020) (see Fig. 6b), but ts, which belongs to Group 3, enabled the prediction of all the smouldering widths measured in Christensen et al. (2020) (see Fig. 6c).
Sensitivity analysis of QR for different Θ and φ values based on (a) horizontal spread rate, and (b) smouldering width. Regions shaded in black represent simulations with a non-circular shape (unexpected results). (c) Sensitivity analysis of ts for different Θ and φ values based on smouldering width. Regions shaded in black represent simulations with a non-circular shape (unexpected results).
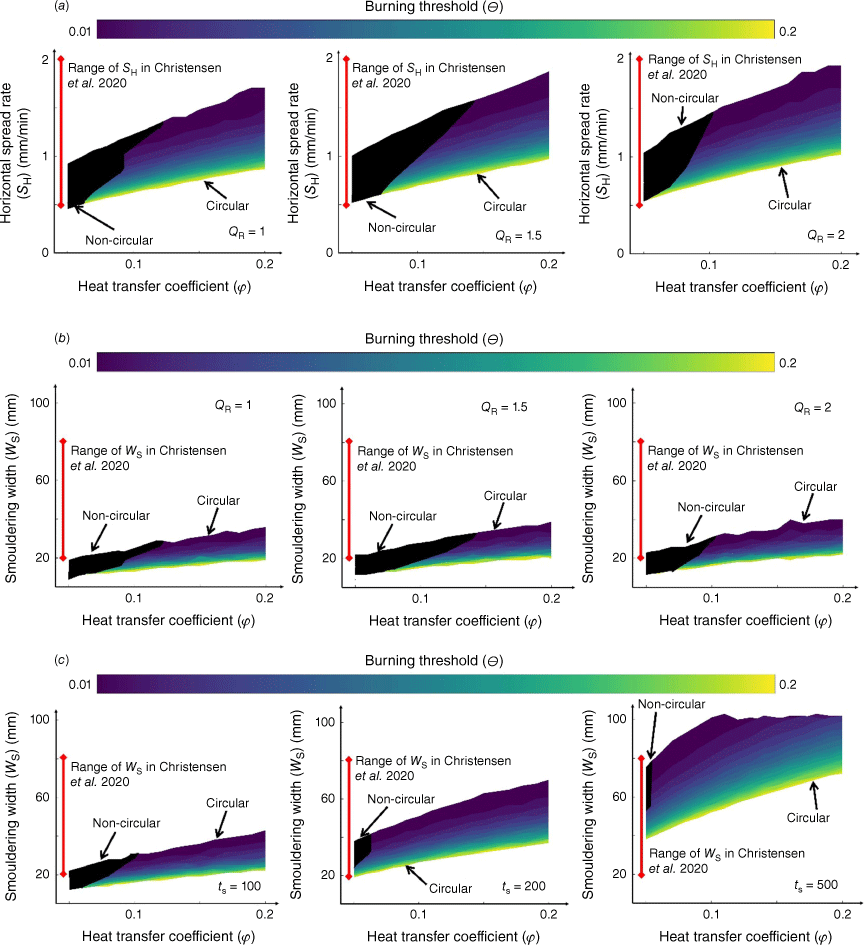
The sensitivity analysis of Group 4 shows that µ does not affect the horizontal spread rate or the smouldering width significantly (within 20% uncertainty compared with above 100% uncertainty for different φ, Θ, or QR), but µ determines the ignitability of peat in the model. With a very high µ, smouldering was not initiated; with µ = 0, there was no significant change in the BARA predictions compared with the predictions with a higher µ. Therefore, the range of µ was set from 0 to 0.9. The upper limit was the maximum µ value at which smouldering was initiated, with a minimum Θ value and a maximum φ value. According to the sensitivity analysis, the order of importance of the variables in BARA is φ and Θ have the same importance, QR and ts have the same importance, then Ps and lastly µ.
The six variables in BARA were calibrated against a set of three laboratory experiments (Frandsen 1987, 1997; Christensen et al. 2020). Of these variables, Ps is constant (Ps = 0.1); φ, QR and ts are variables that were set to depend on peat properties because they have similar meaning to the physical variables; and Θ and µ are independent variables, which were explored within their valid ranges.
In a cell, ts is the time required to consume the peat vertically, at a vertical spread rate of Sd, throughout its thickness (d); ts was formulated as shown in Eqn 2. The vertical spread rate (Sd) was formulated as shown in Eqn 3, adapted from Christensen (2020). In Eqn 3, ρo is the organic density, and a1 (–0.31 mm/min) and a2 (110.7 kg mm/m3 min) are calibration constants from Christensen (2020).
The formulation of QR was derived based on the heat generated by the combustion of peat in one time step with a constant heat generation per unit volume (see Supplementary Appendix B for derivation). QR depends on ρo and Sd, as shown in Eqn 4, and is non-dimensionalised by a constant (a3 = 0.39 m2 s/kg), which makes the minimum value of QR equal to one (see the sensitivity analysis section).
The formulation of φ (Eqn 5) was derived based on 1D transient heat transfer via conduction, which considers the effective thermal conductivity (ke), which includes radiative heat transfer across pores (see Supplementary Appendix B for derivation). φ depends on ρb and the effective specific heat (c) of the inorganic content (IC), MC and organic content. c is the sum of the individual specific heat values multiplied by the mass fraction. φ was normalised within the range of 0.05–0.2 by using constants (a4 = 0.05 and a5 = 78 912 K/m3 J).
Θ was calibrated between 0.01 and 0.2 against the experiments of Christensen (2020) under different MC, IC and bulk density (ρb) conditions. Meanwhile, µ was calibrated between 0 and 0.9 against the experiments of Frandsen (1987, 1997). BARA requires only the peat properties MC, IC and ρb as inputs, and thus can be used to simulate the spread of smouldering under any peat conditions.
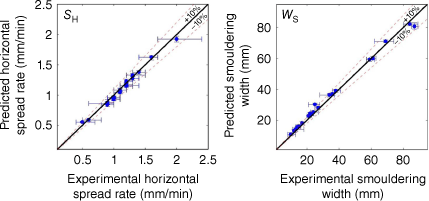
BARA accurately simulated the experiments of Christensen et al. (2020) under all MC, IC and ρb conditions (some comparisons shown in Fig. 7); the differences between the BARA predictions and experiments based on horizontal spread rates and smouldering widths are within 10% (see Fig. 8). In Fig. 8, each blue dot represents the comparison between the prediction and the experiment under one set of MC, IC and ρb, whereas the black line represents the experiments. When the BARA predictions are equal to the values in the experiments, the blue dots overlap the black line. The error bars represent the uncertainty in the experiments after two repetitions (x-axis error bar; Christensen et al. 2020) and the predictions (Ps makes BARA stochastic) after 10 repetitions (y-axis error bar); we found that the prediction uncertainty is not significant (see Fig. 8).
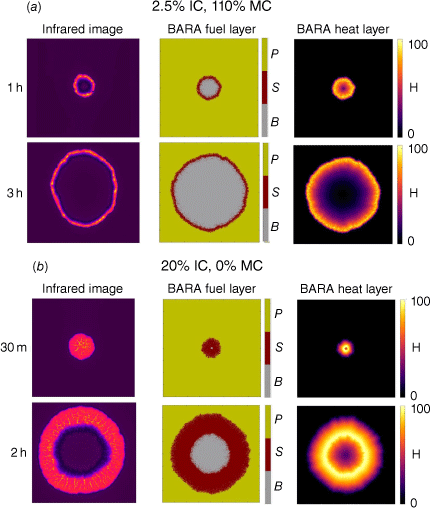
Comparison examples between the BARA predictions and the infrared images from experiments of Christensen et al. (2020) in the calibration process under two different conditions: (a) 2.5% IC and 110% MC; (b) 20% IC and 0% MC. P is peat, S is smouldering and B is burnt out. The heat value (H) was normalised within a range of 0–100 for simplicity.
Calibration results of Θ in BARA against the experiments of Christensen et al. (2020) for horizontal spread rate (SH) and smouldering width (WS). The solid black line represents the target, where the predictions perfectly match the experimental results. Blue circles are the simulation results from BARA with their stochastic uncertainty after 10 repetitions. Dashed lines indicate regions within ±10% error from the experiments.
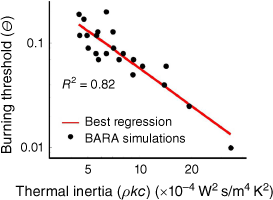
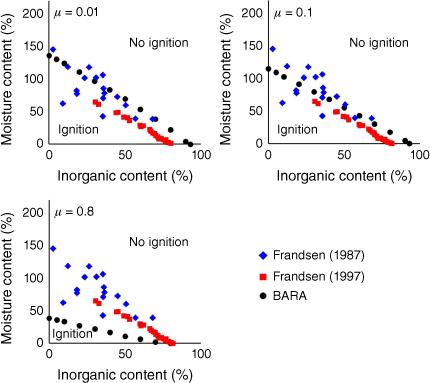
From the calibration, we found that Θ exhibits a strong logarithmic correlation (R = 0.91) with thermal inertia (kρbc), as shown in Fig. 9. We formulated Θ as shown in Eqn 6 with a5 = −1.194 and a6 = 16.599. Fig. 10 shows the critical IC and MC of BARA for different µ compared with experiments. For low µ values, the critical IC and MC of BARA are significantly higher than those of the experiments. For high µ values, the critical IC and MC of BARA are significantly lower than those of the experiments. When µ = 0.1, the critical IC and MC of BARA show good agreement with the experiments; thus, µ was set to this value.
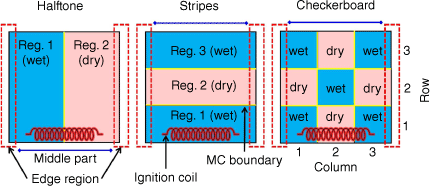
After calibration, we used BARA to generate blind predictions of laboratory experiments on smouldering peat under variable dry (0% MC) and wet (60% MC) peat conditions. We studied three different spatial distributions of MC: halftone, stripes and checkerboard, shown in Fig. 11, adapted from Hadden and Rein (2009). The BARA predictions provide good agreement against the experiments on shape similarity for the halftone, stripes and checkerboard configurations as shown in Fig. 12.
Correlation between Θ in BARA and thermal inertia (ρkc). Black circles are predictions. Solid red line represents the best linear regression.
Calibration of µ in BARA against experiments of Frandsen (1987, 1997) for the critical conditions for ignition. The region at the top right has ignition, whereas in the bottom left, there is no ignition.
Top view of configuration of the MC distribution of laboratory-controlled experiments of Hadden and Rein (2009). Reg. in the figure represents region. The wet peat has 60% MC, whereas the dry peat has 0% MC. The experiments were conducted in a 20 × 20 × 6 cm reactor with line ignition at the bottom edge of the pictures and smouldering spreading horizontally. In each configuration, there are edge regions (red dashed line), regions near the reactor sides; a middle part (blue solid line), regions relatively distant from the reactor sides; and the MC boundary (yellow solid line), locations at which peat with high MC and low MC meet.
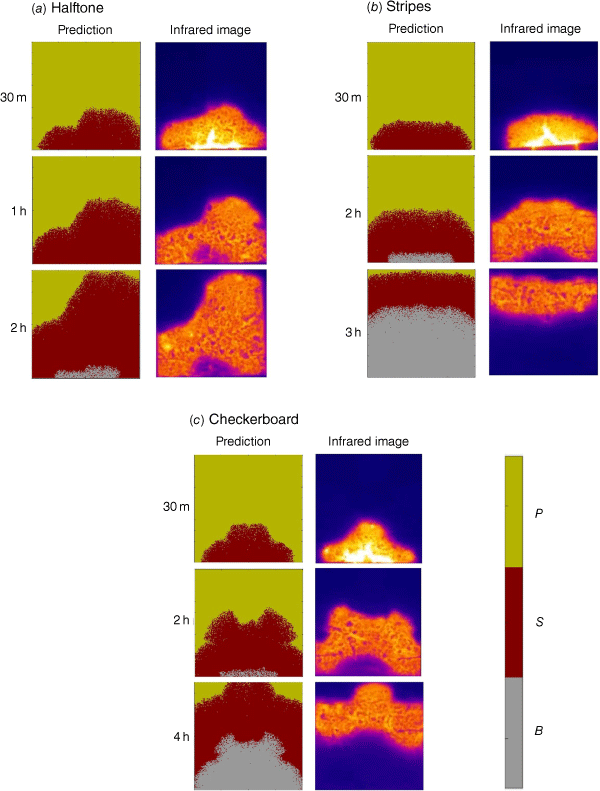
Comparisons of top view profiles of smouldering between the BARA predictions and the infrared images from experiments of Hadden and Rein (2009) in (a) halftone, (b) stripes, and (c) checkerboard configurations (corresponding to Fig. 11). The comparisons are at three different times after ignition. P is peat, S is smouldering and B is burnt out.
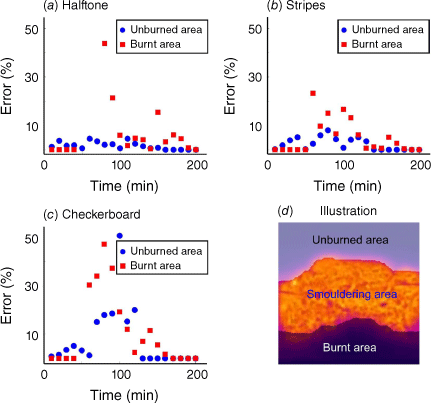
We quantified the error of the BARA predictions against the experiments based on the unburnt and burnt areas at different times, shown in Fig. 13. These areas were selected because the use of smouldering area can cause a compensation effect; the predictions and the experiments have similar areas but with significantly different shapes. The error presented in Fig. 13 is the error in unburnt and burnt areas at 10-min intervals. We found that the BARA predictions had average errors of less than 20% for halftone, stripes and checkerboard configurations in both unburnt and burnt areas.
Quantitative comparisons of burnt and unburnt areas between the BARA predictions and the experiments of smouldering peat with non-uniform MCs in (a) halftone, (b) stripes, and (c) checkerboard configurations. The errors presented here are the errors every 10 min. (d) Illustration of the burnt and unburnt areas for the comparisons.
Discussion
Fig. 12a compares the BARA prediction against the experiment for the halftone configuration. The smouldering front and area in the BARA prediction agree well with that of the experiment. The slower spread in wet peat and faster spread in dry peat are present in both the BARA prediction and the experiment. The shape of the edge in the BARA prediction matches the shape in the experiment, which indicates the retardation of the spread on the edge as ignition is not across the whole width (see Fig. 11).
For the stripes configuration, there are three complex phenomena in the experiment that were accurately predicted by BARA: arc creation, arc stretch and flattening (see Fig. 12b). The cause for arc creation is the same as in the halftone configuration (ignition protocol). At 1 h after ignition, this arc was stretched when the smouldering front in the middle burnt the dry peat and accelerated, whereas on the edge, the smouldering front was still burning wet peat. When the smouldering front reached the subsequent section of wet peat 3 h after ignition, it decelerated and was overtaken by the front on the edge, exhibiting a flattening phenomenon.
In the checkerboard configuration, BARA accurately predicted changes of spread direction of the smouldering front that caused several complex phenomena (see Fig. 12c). At 2 h after ignition, because there is a change from wet–dry–wet to dry–wet–dry configuration, the smouldering front in the middle changes direction to spread diagonally to the dry peat; this spread creates ear-like shapes of the smouldering front. During this diagonal spread, the smouldering front on the edge encircled wet peat near the ignition, which caused the smouldering front on the edge to flatten owing to the merging of forward and backward spreads of the smouldering front on edge. The diagonal spread was observed again 4 h after ignition, but towards the middle; this spread caused another wet peat encirclement in the middle, which led to the creation of a step profile.
We found that the errors in burnt area are ~10% higher than the errors in unburnt area for the three configurations (see Fig. 13). These findings indicate that the rules for extinction (corresponding to ts) can still be improved. For example, the extinction rules can be improved by calibrating BARA against the data of 2D vertical spread when available.
These results show the good ability of BARA to simulate both the horizontal and vertical spread of smouldering in peat with horizontally varying MCs (a realistic condition), in which a sequence of complex phenomena is involved. BARA has a high accuracy (above 80%) in the three MC configurations. To simulate 1 h of peat smouldering, BARA requires only an average of 3 min of computational time (with a 2.7 GHz CPU), which is 240 times faster than using physics-based models (Yuan et al. 2023). Therefore, BARA is a powerful and computationally efficient model to simulate multidimensional spread of smouldering in peat with horizontally varying MCs and can be used to predict its progression with faster-than-real-time simulations for mitigation purposes.
Smouldering wildfires are field-scale phenomena; thus, field-scale modelling is of utmost importance (Santoso et al. 2022; Robb et al. 2023). As BARA considers the three most important factors that affect smouldering (MC, IC and bulk density) and mainly uses non-dimensional parameters (see Table 1), it can potentially be applied to field conditions (considering the spatial and temporal variations in peat conditions) and across scales. This can be done, for instance, by scaling its non-dimensional parameters (Richter 2019; Purnomo 2022), which is a fairly simple task. Therefore, BARA has the potential to simulate smouldering wildfires at their actual scale. BARA’s accuracy and scalability make it a potential component of an operational fire early warning system, a crucial tool that is currently lacking. Recent research has laid the groundwork for such a system (Nikonovas et al. 2020, 2022; Wang et al. 2022; Mezbahuddin et al. 2023), and BARA’s capabilities position it as a valuable addition to advance fire prevention and mitigation efforts.
Conclusion
We used CA to simulate multidimensional spread of smouldering peat with horizontally varying MCs for the first time. The model, BARA, was calibrated against laboratory experiments in homogeneous MC of Christensen et al. (2020). BARA was applied to generate blind predictions of the laboratory experiments with non-uniform MCs of Hadden and Rein (2009) and accurately reproduced various phenomena observed in the experiments, such as diagonal spread and wet peat encirclement, which shows the importance of the MC spatial distribution for smouldering behaviours. These predictions agreed well with the experiments of Hadden and Rein (2009) with above 80% accuracy in smouldering area. BARA only requires 3 min to simulate 1 h of peat smouldering, highlighting its potential for field-scale applications (Purnomo 2022). Our modelling work improves and integrates our current understanding of the multidimensional spread of smouldering fires in peats with non-uniform MCs. As it is accurate and scalable, BARA can potentially form a key part of an operational fire early warning system, which is currently lacking, although recent research has laid the foundations for such a system (Nikonovas et al. 2020, 2022; Wang et al. 2022; Mezbahuddin et al. 2023).
Acknowledgements
We would like to thank Rory Hadden from the University of Edinburgh for providing videos of the 2010 experiments.
References
Alexandridis A, Russo L, Vakalis D, Bafas GV, Siettos CI (2011) Wildland fire spread modelling using cellular automata: evolution in large-scale spatially heterogeneous environments under fire suppression tactics. International Journal of Wildland Fire 20, 633-647.
| Crossref | Google Scholar |
Bechtold M, De Lannoy GJM, Reichle RH, Roose D, Balliston N, Burdun I, Devito K, Kurbatova J, Strack M, Zarov EA (2020) Improved groundwater table and L-band brightness temperature estimates for Northern Hemisphere peatlands using new model physics and SMOS observations in a global data assimilation framework. Remote Sensing of Environment 246, 111805.
| Crossref | Google Scholar |
Belcher CM, Yearsley JM, Hadden RM, McElwain JC, Rein G (2010) Baseline intrinsic flammability of Earth’s ecosystems estimated from paleoatmospheric oxygen over the past 350 million years. Proceedings of the National Academy of Sciences of the United States of America 107, 22448-22453.
| Crossref | Google Scholar | PubMed |
Campbell DI, Laybourne CE, Blair IJ (2002) Measuring peat moisture content using the dual-probe heat pulse technique. Australian Journal of Soil Research 40, 177-190.
| Crossref | Google Scholar |
Christensen EG, Fernandez-Anez N, Rein G (2020) Influence of soil conditions on the multidimensional spread of smouldering combustion in shallow layers. Combustion and Flame 214, 361-370.
| Crossref | Google Scholar |
Clarke KC, Brass JA, Riggan PJ (1994) A cellular automaton model of wildfire propagation and extinction. Photogrammetric Engineering & Remote Sensing 60, 1355-1367.
| Google Scholar |
Collin A, Bernardin D, Séro-Guillaume O (2011) A physical-based cellular automaton model for forest-fire propagation. Combustion Science and Technology 183, 347-369.
| Crossref | Google Scholar |
Fernandez-Anez N, Christensen K, Rein G (2017) Two-dimensional model of smouldering combustion using multi-layer cellular automaton: The role of ignition location and direction of airflow. Fire Safety Journal 91, 243-251.
| Crossref | Google Scholar |
Fernandez-Anez N, Christensen K, Frette V, Rein G (2019) Simulation of fingering behavior in smoldering combustion using a cellular automaton. Physical Review E 99, 023314.
| Crossref | Google Scholar | PubMed |
Frandsen WH (1987) The influence of moisture and mineral soil on the combustion limits of smoldering forest duff. Canadian Journal of Forest Research 17, 1540-1544.
| Crossref | Google Scholar |
Frandsen WH (1997) Ignition probability of organic soils. Canadian Journal of Forest Research 27, 1471-1477.
| Crossref | Google Scholar |
Hu Y, Fernandez-Anez N, Smith TEL, Rein G (2018) Review of emissions from smouldering peat fires and their contribution to regional haze episodes. International Journal of Wildland Fire 27, 293-312.
| Crossref | Google Scholar |
Huang X, Rein G (2015) Computational study of critical moisture and depth of burn in peat fires. International Journal of Wildland Fire 24, 798-808.
| Crossref | Google Scholar |
Huang X, Rein G, Chen H (2015) Computational smoldering combustion: predicting the roles of moisture and inert contents in peat wildfires. Proceedings of the Combustion Institute 35, 2673-2681.
| Crossref | Google Scholar |
Johnston FH, Henderson SB, Chen Y, Randerson JT, Marlier M, DeFries RS, Kinney P, Bowman DMJS, Brauer M (2012) Estimated global mortality attributable to smoke from landscape fires. Environmental Health Perspectives 120, 695-701.
| Crossref | Google Scholar | PubMed |
Karafyllidis I, Thanailakis A (1997) A model for predicting forest fire spreading using cellular automata. Ecological Modelling 99, 87-97.
| Crossref | Google Scholar |
Malamud BD, Morein G, Turcotte DL (1998) Forest fires: an example of self-organized critical behavior. Science 281, 1840-1842.
| Crossref | Google Scholar | PubMed |
Meingast KM, Falkowski MJ, Kane ES, Potvin LR, Benscoter BW, Smith AMS, Bourgeau-Chavez LL, Miller ME (2014) Spectral detection of near-surface moisture content and water-table position in northern peatland ecosystems. Remote Sensing of Environment 152, 536-546.
| Crossref | Google Scholar |
Mezbahuddin S, Nikonovas T, Spessa A, Grant RF, Imron MA, Doerr SH, Clay GD (2023) Accuracy of tropical peat and non-peat fire forecasts enhanced by simulating hydrology. Scientific Reports 13, 619.
| Crossref | Google Scholar | PubMed |
Nikonovas T, Spessa A, Doerr SH, Clay GD, Mezbahuddin S (2020) Near-complete loss of fire-resistant primary tropical forest cover in Sumatra and Kalimantan. Communications Earth & Environment 1, 65.
| Crossref | Google Scholar |
Nikonovas T, Spessa A, Doerr SH, Clay GD, Mezbahuddin S (2022) ProbFire: a probabilistic fire early warning system for Indonesia. Natural Hazards and Earth System Sciences 22, 303-322.
| Crossref | Google Scholar |
Ntinas VG, Moutafis BE, Trunfio GA, Sirakoulis GC (2017) Parallel fuzzy cellular automata for data-driven simulation of wildfire spreading. Journal of Computational Science 21, 469-485.
| Crossref | Google Scholar |
Prat-Guitart N, Rein G, Hadden RM, Belcher CM, Yearsley JM (2016) Effects of spatial heterogeneity in moisture content on the horizontal spread of peat fires. Science of the Total Environment 572, 1422-1430.
| Crossref | Google Scholar | PubMed |
Prat-Guitart N, Belcher CM, Thompson DK, Burns P, Yearsley JM (2017) Fine-scale distribution of moisture in the surface of a degraded blanket bog and its effects on the potential spread of smouldering fire. Ecohydrology 10, e1898.
| Crossref | Google Scholar |
Purnomo DMJ, Bonner M, Moafi S, Rein G (2021) Using cellular automata to simulate field-scale flaming and smouldering wildfires in tropical peatlands. Proceedings of the Combustion Institute 38, 5119-5127.
| Crossref | Google Scholar |
Purnomo DMJ, Apers S, Bechtold M, Sofan P, Rein G (2023) KAPAS II: simulation of peatland wildfires with daily variations of peat moisture content. International Journal of Wildland Fire 32, 823-835.
| Crossref | Google Scholar |
Rein G (2013) Smouldering fires and natural fuels. In ‘Fire Phenomena and the Earth System: An Interdisciplinary Guide to Fire Science’. (Ed. CM Belcher) pp. 15–33. (Wiley and Sons) 10.1002/9781118529539.ch2
Richter F (2019) Computational Investigation of the Timber Response to Fire. Imperial College London, London, UK. Available at http://hdl.handle.net/10044/1/79464
Robb S, Asi Nion Y, Anggreini T, Richards R, Abdul Aziz A, Joseph S, Dargusch P (2023) The dynamics of burning activity on degraded peatland in two villages in central Kalimantan, Indonesia. International Journal of Wildland Fire 32, 222-237.
| Crossref | Google Scholar |
Santoso MA, Christensen EG, Amin HMF, Palamba P, Hu Y, Purnomo DMJ, Cui W, Pamitran A, Richter F, Smith TEL, Nugroho YS, Rein G (2022) GAMBUT field experiment of peatland wildfires in Sumatra: from ignition to spread and suppression. International Journal of Wildland Fire 31, 949-966.
| Crossref | Google Scholar |
Trunfio GA, D’Ambrosio D, Rongo R, Spataro W, Di Gregorio S (2011) A new algorithm for simulating wildfire spread through cellular automata. ACM Transactions on Modeling and Computer Simulation 22, 1-26.
| Crossref | Google Scholar |
Turetsky MR, Benscoter B, Page S, Rein G, Van Der Werf GR, Watts A (2015) Global vulnerability of peatlands to fire and carbon loss. Nature Geoscience 8, 11-14.
| Crossref | Google Scholar |
von Neumann J (1967) ‘Theory of Self-Reproducing Automata.’ (Ed. AW Burks) (University of Illinois Press: Urbana, IL, USA) 10.2307/2005041
Wang B, Spessa AC, Feng P, Hou X, Yue C, Luo JJ, Ciais P, Waters C, Cowie A, Nolan RH, Nikonovas T, Jin H, Walshaw H, Wei J, Guo X, Liu L, Yu Q (2022) Extreme fire weather is the major driver of severe bushfires in southeast Australia. Science Bulletin 67, 655-664.
| Crossref | Google Scholar | PubMed |
Widyastuti K, Imron MA, Pradopo ST, Suryatmojo H, Sopha BM, Spessa A, Berger U (2021) PeatFire: an agent-based model to simulate fire ignition and spreading in a tropical peatland ecosystem. International Journal of Wildland Fire 30, 71-89.
| Crossref | Google Scholar |
Wolfram S (1984) Cellular automata as models of complexity. Nature 311, 419-424.
| Crossref | Google Scholar |
Yuan H, Purnomo DMJ, Sun P, Huang X, Rein G (2023) Computational study of the multidimensional spread of smouldering combustion at different peat conditions. Fuel 345, 128064.
| Crossref | Google Scholar |