

Potential sources of red snapper (Lutjanus campechanus) recruits estimated with Markov Chain Monte Carlo analysis of otolith chemical signatures
Beverly K. Barnett A E , William F. PattersonA National Marine Fisheries Service, Southeast Fisheries Science Center, Panama City Laboratory, 3500 Delwood Beach Road, Panama City, FL 32408, USA.
B University of South Alabama and Dauphin Island Sea Lab, 101 Bienville Boulevard, Dauphin Island, AL 36528, USA.
C National Marine Fisheries Service, Southeast Fisheries Science Center, Beaufort Laboratory, 101 Pivers Island Road, Beaufort, NC 28516, USA.
D University of Southern Mississippi, Department of Marine Science, 1020 Balch Boulevard, Stennis Space Center, MS 39529, USA.
E Corresponding author. Email: beverly.barnett@noaa.gov
Marine and Freshwater Research 67(7) 992-1001 https://doi.org/10.1071/MF15076
Submitted: 26 February 2015 Accepted: 14 September 2015 Published: 24 November 2015
Journal Compilation © CSIRO Publishing 2016 Open Access CC BY-NC-ND
Abstract
Otolith chemical signatures were used to estimate the number of likely nursery sources that contributed recruits to a suite of red snapper (Lutjanus campechanus) year-classes sampled in 2012 in US Atlantic Ocean waters from southern Florida (28°N) to North Carolina (34°N). Otoliths from subadult and adult fish (n = 139; ages 2–5 years) were cored and their chemical constituents analysed for δ13C, δ18O, as well as the elemental ratios of Ba : Ca, Mg : Ca, Mn : Ca and Sr : Ca. Results from multiple linear regression analyses indicated that there was significant latitudinal variation for δ13C, Ba : Ca, Mg : Ca and Mn : Ca. Therefore, these variables were used to parameterise Markov Chain Monte Carlo (MCMC) models computed to estimate the most likely number of nursery sources to each age class. Results from MCMC models indicated that between two and seven nursery sources were equally plausible among the four age classes examined, but the likely number of nursery sources declined for fish aged 4 and 5 years because of apparent mixing between more northern and more southern signatures. Overall, there is evidence to reject the null hypothesis that a single nursery source contributed recruits among the age classes examined, but increased sample size from a broader geographic range may be required to refine estimates of the likely number of nursery sources.
Additional keywords: elemental ratios, MicroMill, nursery sources, red snapper juveniles, stable isotopes.
Introduction
Red snapper (Lutjanus campechanus) is a long-lived demersal reef fish that occurs in continental shelf and shelf-break waters of the Atlantic Ocean off the south-eastern US (SEUS) and throughout the Gulf of Mexico (GOM; Robins et al. 1986). Red snapper spawn in open coast waters, with spawning occurring from April to October in the GOM (SEDAR 2013) and from May to October in the SEUS (SEDAR 2010). In the GOM, red snapper juveniles are most commonly associated with low-relief shell rubble substrates (Workman et al. 2002; Patterson et al. 2005) and are frequently collected (millions of individuals captured annually) as incidental catch in shrimp trawls (Workman and Foster 1994; SEDAR 2013). However, little information is available about the occurrence, distribution or habitat utilisation of red snapper juveniles in SEUS waters (Rindone et al. 2015; Fig. 1). For example, only 93 juvenile red snapper have been recorded among >10 000 fishery-independent trawl sets conducted in SEUS waters since 1973, compared with more than 50 000 caught in GOM trawl surveys since 1982, and there is no indication that red snapper juveniles are caught as bycatch in the SEUS shrimp trawl fishery (Rindone et al. 2015). Red snapper has supported one of the most important fisheries in SEUS waters, where the population is centred off of north-eastern Florida (SEDAR 2010; Mitchell et al. 2014). However, recent stock assessments indicated the SEUS red snapper stock was overfished (SEDAR 2008, 2010), which resulted in fishery closure in 2010, with annual, limited openings beginning in 2012. A fundamental assumption of SEUS red snapper stock assessments is that SEUS red snapper comprise a distinct stock, but little information exists from which to infer SEUS population or stock structure (SEDAR 2010). Although spawning is known to occur from May to October in SEUS waters (SEDAR 2010), the near lack of data on juvenile red snapper occurrence, distribution and density is problematic for estimating the source(s) of recruits to adult populations or devising management measures to promote stock recovery.
|
Analysis of otolith chemistry has revolutionised the ability to estimate sources of recruits to fish populations. The typical approach is to sample juveniles from the suite of potential nursery areas and then use nursery-specific chemical signatures as rule functions to estimate the sources of recruits to subadult or adult populations (for a review, see Elsdon et al. 2008). For red snapper in the US GOM, this approach has been successfully used to discriminate among four geographical regions, with these regions being assigned based on differences in life history characteristics, genetics and predominant oceanographic features that occur among these regions (Patterson et al. 2008). However, the scarcity of juvenile samples makes this traditional approach impossible for SEUS red snapper. Recent applications of Markov Chain Monte Carlo (MCMC) analysis to otolith chemical signatures suggest it may be possible to estimate the likely number of potential nurseries contributing to year-class strength when the only data available are chemical signatures from the juvenile portion of subadult or adult otoliths (White et al. 2008).
The overall objective of the present study was to use an MCMC approach to test the null hypothesis that a single nursery region contributed recruits to the 2007–10 SEUS red snapper year-classes. This was accomplished by milling the cores from subadult and adult red snapper otoliths and analysing chemical constituents that were incorporated in those otoliths during approximately the first 6 months of life (Barnett and Patterson 2010). Then, MCMC analysis was applied to year-class-specific chemical signatures to estimate the most likely number of nursery sources that contributed recruits. For the purposes of the present study, nursery source is best described as a source region or area for which chemical signatures differed and, because the otolith core was used to obtain chemical constituent values, the term ‘nursery’ is used to represent the first 6 months of life. Latitude from which the subadult or adult fish was caught is used only as a spatial reference for the chemical signatures obtained from the otolith core; it is not meant to imply that the latitude presented herein is where the juvenile fish originated.
Materials and methods
Samples were collected in SEUS waters off North Carolina, South Carolina, Georgia and Florida during standardised surveys using bottom longline, vertical longline and hook and line gear during the period April–December 2012 in SEUS waters. Samples were collected by the Florida Fish and Wildlife Research Institute (FWRI) Fisheries Independent Monitoring Program personnel or National Marine Fisheries Service (NMFS) fishery observers during standardised surveys. Length, sex, latitude, longitude and depth were recorded at capture location for each fish collected. Left and right sagittal otoliths were removed, cleaned of adherent tissue and stored dry in paper coin envelopes. Ages were assigned for each sample by sectioning the left otolith from each pair using methods described in Cowan et al. (1995).
Right otoliths were mounted in epoxy resin, dried for 24 h and sectioned to a thickness of 1.5 mm. An Electro Scientific Industries MicroMill (Portland, OR, USA) was used to remove the core (age ~6 months) area from the sectioned otolith using a 0.5-mm parallel milling bit (Barnett and Patterson 2010; Fig. 2). A blank resin section was used to mount the otolith thin section onto a glass slide to avoid the MicroMill bit from milling into the glass slide. Once removed, the core was weighed, cleaned with 1% nitric acid (HNO3), repeatedly flooded with ultrapure water (18.3 mΩ cm–1) and air dried for at least 24 h under a Class 10 clean hood. After drying, each core was weighed and pulverised in an acid-leached mortar and pestle.

|
For trace element analysis, samples were prepared and analysed using methods similar to those described by Patterson et al. (2014). Briefly, half the pulverised powder from each sample was placed in an acid-leached, high-density polypropylene bottle and dissolved for at least 24 h with 1% ultrapure HNO3 with a dilution of ~1000 : 1. Dissolved samples were analysed for 48Ca, 137Ba, 24Mg, 55Mn and 88Sr with a Thermo Fisher Scientific (Waltham, MA, USA) Element 2 sector field–inductively coupled plasma–mass spectrometer (SF-ICP-MS) at the Department of Marine Science, University of Southern Mississippi (Stennis Space Center, MS, USA). Blanks were prepared from 1% ultrapure HNO3 and analysed concurrently with sample solutions to estimate instrument limits of detection (LOD), which were estimated as three standard deviations of mean blank values. Elemental concentrations were assayed from a certified reference material (CRM) prepared from red snapper otoliths (Sturgeon et al. 2005) to check instrument performance and matrix effects. CRM solutions were prepared and analysed using the same methods as for red snapper otolith samples.
The second half of each pulverised otolith sample was stored in a microcentrifuge tube pending analysis of δ13C and δ18O with a Thermo-Finnigan LLC MAT 252 (Bremen, Germany) stable isotope ratio-mass spectrometer (SIR-MS) at the Department of Geosciences, University of Arizona (Tucson, AZ, USA). Stable isotope measurements were calibrated with repeated measurements of International Atomic Energy Agency (Vienna, Austria) standards NBS-19 (limestone) and NBS-18 (calcite). Stable isotope results are reported in δ-notation (δX = [Rsample/Rstandard – 1] × 1000, where X = 13C or 18O and R = 13C/12C or 18O/16O) and are expressed as per mille (‰) relative to the international standard Vienna PeeDee Belemnite (V-PDB).
The effects of fish age and capture location (latitude and depth) on chemical constituents were tested with multiple regression. The effects of age were used to test for differences among year-classes, whereas the effects of latitude and depth were used to test for spatial differences among chemical signatures. Chemical constituents that violated parametric assumptions were natural log (ln)-transformed before regression analysis. Significance was set at α = 0.05. Following regression analysis, age class-specific non-metric multidimensional scaling (MDS) analysis was conducted for constituents that exhibited a significant latitude effect. First, similarity matrices were computed in the PRIMER software package (ver. 6; Clarke and Gorley 2006; Clarke and Warwick 2001) based on Euclidean distances between samples and then MDS analyses were computed to visualise multivariate otolith chemical signatures in two-dimensional space.
Bayesian multivariate mixing models were computed with otolith chemical constituent data using the mixAK package in R (ver. 3.1.1; R Core Team 2014) to estimate the number of potential nursery sources contributing to red snapper samples collected in 2012 (Komárek 2009, 2014). The NMixMCMC function in the R package was used to calculate semiparametric density estimates of multivariate–normal mixtures, with MCMC analysis providing joint estimates of mixture parameters and the likelihood of a given number of nursery sources. The default approach in NMixMCMC was used following Komárek (2014), in which required priors were specified and remaining priors and initial values were generated by the program (Komárek 2009, 2014). Uninformative priors were specified for the parameter K, which is the estimated number of potential nursery sources (K = 1–7) having contributed recruits to each of the four age classes. The parameter Kmax was set to 7 to represent the 7° of latitude from which the samples were collected. The parameter priormuQ was set as ‘naturalC’ in the model, which means priors for the mixture means (μ) and precision matrices (Q) were estimated from the natural conjugate of a normal Wishart distribution. The parameter δ, which is the Dirichlet prior on the mixture weights w1, …, wK, was given a default value of 1. The parameter ξ specified the prior means ξ1, …, ξKmax for the mixture means (μ1, …, μKmax) where the default value was a matrix Kmax × p with midpoints of columns being initial values. Prior precision parameters c1, …, cKmax for the mixture means μ1, …, μKmax have default values as a vector of 1s when priormuQ is ‘naturalC’. The default degrees of freedom ζ for the Wishart prior were p (number of otolith constituents in the model) + 1. The variance hyperparameter γ was a vector of length p with shape parameters g1, …, gp for the Gamma hyperpriors on γ1, …, γp with default vector of (0.2, …, 0.2). The Wishart scale matrix Ξ was assumed to be diagonal with γ1, …, γp on a diagonal with γj–1 (j = 1, …, K) additional Gamma hyperprior G(gj, hj) assumed.
Age class-specific MCMC models were computed with chemical constituents as input variables. These variables, along with latitude, were statistically significant in multiple regression models. Data were neither scaled nor shifted in any run. Results reported below are based on 500 000 iterations of 1 : 10 thinned MCMC obtained after a burn-in period of 100 000 iterations. Penalised expected deviance (PED) and the deviance inflation criterion (DIC) were computed for each simulation (Plummer 2008; Gelman et al. 2014). The DIC is analogous to Akiake’s Information Criterion (AIC) but is better suited for MCMC output given difficulties in calculating likelihood over the full range of unknown parameters. Model weights were derived from ΔDIC values, with ΔDIC = DICi from a given Ki model minus the lowest DIC value among all seven models (K = 1–7) computed for a given age class for a given approach (full or reduced). Model weights themselves (ωi) were computed similar to AIC weights (Burnham and Anderson 2002). First, the likelihood (L) of a given model given the data was estimated as L = e(–ΔDIC). Then, ωi was computed as the likelihood of model i divided by the sum of likelihoods among models. The most parsimonious model was the one with the lowest DIC among each suite of the seven age class-specific models, meaning it had a ΔDIC of 0, hence the highest ωi. Following Burnham and Anderson (2002), we interpreted models with ΔDIC values between 2 and 7 as providing moderate evidence, and ΔDIC values >7 as providing substantial evidence of poorer fit compared with the most parsimonious model.
Results
Subadult and adult red snapper samples (n = 139) collected in US Atlantic Ocean waters off Florida (28°N) to North Carolina (34°N) were comprised of age classes 2–5 years (Fig. 3). Age class-specific scatterplots of each otolith chemical constituent by latitude showed a general trend of lower variability at lower latitudes (Fig. 4). Values for δ13C and δ18O appeared to become more negative at higher latitudes, whereas Ba : Ca, Mg : Ca and Mn : Ca generally increased at higher latitudes (Fig. 4). Sr : Ca generally decreased at higher latitudes for fish aged 2 and 3 years, with no apparent pattern for fish aged 4 and 5 years (Fig. 4).

|

|
Elemental ratios Mg : Ca, Mn : Ca and Sr : Ca were ln-transformed to meet parametric assumptions for statistical analyses. Multiple regression models were significant for all constituents (Table 1). Latitude had a significant effect on all constituents except δ18O and Sr : Ca. Age was significant for all constituents except Mg : Ca, Mn : Ca and Sr : Ca, whereas depth was only significant for Ba : Ca and Sr : Ca.

|
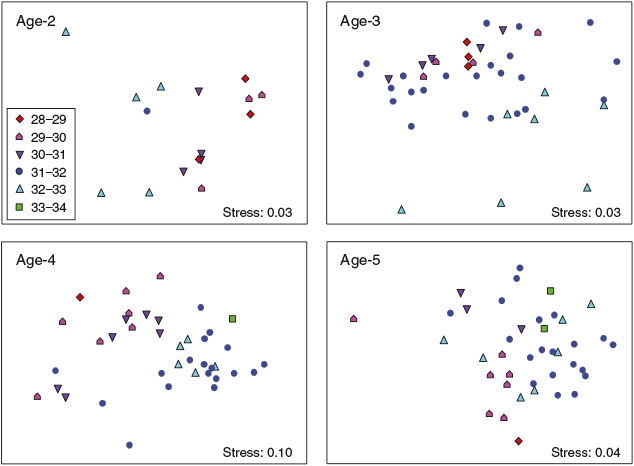
Multidimensional scaling plots revealed differences in the spatial segregation of multivariate chemical signatures among age classes (Fig. 5). Signatures were clearly segregated by latitude for younger ages, but for the fish aged 4 years there was greater overlap in signatures at middle latitudes (30–32°N), and signatures of fish from the highest latitudes (32–34°N) had intermediate signatures. A similar pattern was evident for fish aged 5 years, except some of the highest latitude fish among those samples actually had signatures that overlapped with those of fish from the lowest latitudes.
|
Results from MCMC analysis indicated a trend among age classes in which the most parsimonious fit indicated a lower number of potential nursery sources for older age classes (Table 2). There was lower resolution for younger fish because several different K values produced ΔDIC ≤2 for a given age class (Table 2). However, given the high (>12.7) ΔDIC values among age class-specific models for K = 1, we have substantial evidence to reject the null hypothesis that there was only a single nursery source contributing to red snapper recruits.

|
Discussion
The results of the present study provide a first step in assessing nursery sources for red snapper in SEUS waters, with the most substantial result being the rejection of the null hypothesis that a single nursery source contributed recruits for each of the red snapper age classes examined. Because little to no information exists about red snapper recruitment sources in the SEUS and there is evidence that the red snapper population has a centre of abundance off north-east Florida (SEDAR 2010; Mitchell et al. 2014), the null hypothesis for a single source needed to be investigated. The latitude where subadult or adult red snapper were caught was used as a geographical reference in an attempt to spatially discriminate among the chemical signatures imparted during the first 6 months of life. A general trend observed among age classes was that variability in otolith chemical signatures was lower at lower latitudes. However, signatures for 4- and 5-year-old fish collected at higher latitudes showed overlap with signatures from lower latitudes. This apparent mixing of signatures for older fish may indicate that fish from more southern nursery areas moved northward with age. Such an inference is supported by patterns observed in several constituents, where southern fish tended to exhibit less variability in constituent values, whereas there was a much greater range in values for more northern fish, a pattern that was more pronounced in older fish. Such a scenario would be consistent with observations from the GOM, where movement and post-settlement dispersion from centres of abundance have been reported to increase with size and age for tagged red snapper (Patterson et al. 2001; Addis et al. 2013).
The MCMC results for 5-year-old, and to a lesser extent 4-year-old, fish suggest the most parsimonious fit to the data is two nursery sources, which is likely due to the fact that some of the northern fish had chemical signatures similar to more southern fish, thereby providing the model with two distinct clusters of data to fit. The lack of latitudinal overlap in signatures for younger fish resulted in equivocal MCMC model results in which multiple nursery sources are equally plausible. These results support an interpretation of local self-recruitment in that young red snapper (age <4 years) in the south region tended to recruit to the south, but then increased mixing of southern fish with northern fish was apparent among latitudes as fish grew older. The direction of this mixing appears to be northward away from the centre of abundance off north-east Florida.
Patterns observed in the otolith constituents are ultimately the basis for inferences drawn about likely nursery sources or population mixing in red snapper. Only four of the six constituents analysed showed significant effects of latitude. Among them, δ13C exhibited the strongest latitudinal trend, with values becoming more depleted at higher latitudes for all ages. This trend may be related to metabolic differences related to temperature or possibly genotypic differences (Høie et al. 2003, 2004), given differences in red snapper growth that have been observed between more northern (32–35°N) versus southern (28–31°N) SEUS regions (SEDAR 2010). However, latitudinal trends may also reflect regional δ13C isoscapes in dissolved inorganic C, plankton or both (McMahon et al. 2013; Radabaugh et al. 2013).
Several factors have been shown to affect Ba, Mg and Mn ratios in otoliths, thus interpretation of the ratios of these elements to Ca is complex. In the GOM, Hanson et al. (2004) found latitudinal trends for Sr and Mn for the gag (Mycteroperca microlepis) and suggested the concentration differences could be contributed to groundwater and sediment differences. To a greater or lesser extent, incorporation of these elements has been shown to be affected by ambient concentration in seawater, temperature, salinity and fish physiology (Bath et al. 2000; Brophy et al. 2004; Elsdon and Gillanders 2002, 2003; Bath Martin and Thorrold 2005). In addition, Clarke et al. (2011) reported significant differences in otolith Mg, Mn and Ba partition coefficients, as well as Mg : Ca, Mn : Ca and Ba : Ca ratios themselves, between genetically distinct populations of Atlantic silverside (Menidia menidia). Although the population structure of SEUS red snapper is unknown, the possibility of genetic effects on Ba : Ca, Mg : Ca and Mn : Ca ratios in otoliths cannot be ruled out.
For otolith chemistry studies conducted to estimate nursery contribution to subadult or adult fish populations, juveniles ideally would be sampled from the range of potential nursery habitats and regions and then habitat- or region-specific natural biogeochemical tags would be derived from otolith chemical signatures (for a review, see Elsdon et al. 2008). Juvenile signatures then serve as rule functions to estimate the source(s) of recruits to subadult or adult populations. For red snapper in the GOM, Patterson et al. (2008) and Zapp Sluis et al. (2012) successfully used this ideal approach and found overall classification accuracies of near 80% when discriminating among three regions and 70% when discriminating among six regions respectively using regional separation based on significantly different chemical signatures among regions and among year-classes. However, this approach was not possible for SEUS red snapper given that only 93 juvenile red snapper have been recorded since 1973 in SEUS waters (Rindone et al. 2015). Instead, we applied the approach of White et al. (2008), who suggested MCMC analysis as a tool to investigate the number of potential nursery sources contributing to year-class strength when juvenile signatures are not available to make direct estimates of sources of recruits. Clearly, the results presented here require greater interpretation than if juvenile signatures were available to make direct estimates of juvenile sources. However, our results do provide informative data about sources of recruits and mixing dynamics, especially given the patterns observed in the data and how those patterns changed as fish aged.
Although questions remain about red snapper nursery sources, recruitment and population connectivity in the SEUS, the approach used in the present study is a first step in addressing questions about nursery sources that may be contributing to the red snapper population in the SEUS. Future research efforts are needed to identify juvenile red snapper habitat in this region (Rindone et al. 2015). Such efforts would be a critical step in enabling surveys to generate recruitment indices for use in stock assessment, and would also enable the application of juvenile otolith chemical signatures to directly estimate recruitment sources and post-settlement mixing. In addition, identifying nursery sources for South Atlantic red snapper would directly enable research to determine whether the South Atlantic red snapper population is completely or partially sustained by self-recruitment or whether migration of juveniles or adults from the GOM may be occurring. Such a determination would have significant implications for stock recruitment relationships used in stock assessments, assessing current assumptions about South Atlantic–GOM stock connectivity (or lack thereof) and determining appropriate spatial scales for fishery management actions. However, even without knowledge of juvenile habitat, data from conventional tagging of subadult fish that are 1 or 2 years old may provide insights into movement patterns and how they change ontogenetically.
Acknowledgements
The authors thank the commercial fishers, National Marine Fisheries Service observers and Fish and Wildlife Research Institute field staff for their efforts in collecting samples used in the present study. The authors also thank Dr David Dettman for analysing stable isotope samples, Melissa Gilbert for assistance with the analysis of inductively coupled mass spectrometer samples, Christina Schobernd for assistance in making geographic information system (GIS) maps, Jennifer Potts and Jessica Carroll for providing age estimates and Bill Kline for micromilling samples and assistance in the laboratory. The authors thank Alex Chester for providing helpful comments on an earlier draft of this manuscript. Funding for this study was provided by the Marine Fisheries Initiative grant number 12MFIH005.
References
Addis, D. T., Patterson, W. F., Dance, M. A., and Ingram, G. W. (2013). Implications of reef fish movement from unreported artificial reef sites in the northern Gulf of Mexico. Fisheries Research 147, 349–358.| Implications of reef fish movement from unreported artificial reef sites in the northern Gulf of Mexico.Crossref | GoogleScholarGoogle Scholar |
Barnett, B. K., and Patterson, W. F. (2010). The effect of coring and pulverizing juvenile red snapper, Lutjanus campechanus, otoliths on their chemical signatures. Environmental Biology of Fishes , .
| The effect of coring and pulverizing juvenile red snapper, Lutjanus campechanus, otoliths on their chemical signatures.Crossref | GoogleScholarGoogle Scholar |
Bath, G. E., Thorrold, S. R., Jones, C. M., Campana, S. E., McLaren, J. W., and Lam, J. W. H. (2000). Strontium and barium uptake in aragonitic otoliths of marine fish. Geochimica et Cosmochimica Acta 64, 1705–1714.
| Strontium and barium uptake in aragonitic otoliths of marine fish.Crossref | GoogleScholarGoogle Scholar | 1:CAS:528:DC%2BD3cXjt1Sisrw%3D&md5=9957866924d02dc330bc36257da71a2bCAS |
Bath Martin, G., and Thorrold, S. R. (2005). Temperature and salinity effects on magnesium, manganese, and barium incorporation in otoliths of larval and early juvenile spot Leiostomus xanthurus. Marine Ecology Progress Series 293, 223–232.
| Temperature and salinity effects on magnesium, manganese, and barium incorporation in otoliths of larval and early juvenile spot Leiostomus xanthurus.Crossref | GoogleScholarGoogle Scholar |
Brophy, D., Jeffries, T. E., and Danilowicz, B. S. (2004). Elevated manganese concentrations at the cores of clupeid otoliths: possible environmental, physiological, or structural origins. Marine Biology 144, 779–786.
| Elevated manganese concentrations at the cores of clupeid otoliths: possible environmental, physiological, or structural origins.Crossref | GoogleScholarGoogle Scholar | 1:CAS:528:DC%2BD2cXis1Ghurw%3D&md5=79d9615b55031f37b9652826297b44a8CAS |
Burnham, K. P., and Anderson, D. R. (2002). ‘Model Selection and Multimodel Inference: A Practical Information–Theoretic Approach’, 2nd edn. (Springer-Verlag: New York.)
Clarke, L. M., Thorrold, S. R., and Conover, D. O. (2011). Population differences in otolith chemistry have a genetic basis in Menidia menidia. Canadian Journal of Fisheries and Aquatic Sciences 68, 105–114.
| Population differences in otolith chemistry have a genetic basis in Menidia menidia.Crossref | GoogleScholarGoogle Scholar | 1:CAS:528:DC%2BC3MXmtFKitA%3D%3D&md5=af01c4c82197fdd4a0806305d52949c2CAS |
Clarke, K. R., and Gorley, R. N. (2006). ‘PRIMER v6: User Manual/Tutorial.’ (PRIMER-E Ltd: Plymouth.)
Clarke, K. R., and Warwick, R. M. (2001). ‘Change in Marine Communities: an Approach to Statistical Analysis and Interpretation’, 2nd edn. (PRIMER-E Ltd: Plymouth.)
Cowan, J. H., Shipp, R. L., Bailey, K. B., and Haywick, D. W. (1995). Procedure for rapid processing of large otoliths. Transactions of the American Fisheries Society 124, 280–282.
| Procedure for rapid processing of large otoliths.Crossref | GoogleScholarGoogle Scholar |
Elsdon, T. S., and Gillanders, B. M. (2002). Interactive effects of temperature and salinity on otolith chemistry: challenges for determining environmental histories of fish. Canadian Journal of Fisheries and Aquatic Sciences 59, 1796–1808.
| Interactive effects of temperature and salinity on otolith chemistry: challenges for determining environmental histories of fish.Crossref | GoogleScholarGoogle Scholar | 1:CAS:528:DC%2BD3sXhtlKhs70%3D&md5=55e866a4306a7203635aedf66dae5527CAS |
Elsdon, T. S., Wells, B. K., Campana, S. E., Gillanders, B. M., Jones, C. M., Limburg, K. E., Secor, D. H., Thorrold, S. R., and Walther, B. D. (2008). Otolith chemistry to describe movements and life-history parameters of fishes: hypotheses, assumptions, limitations and inferences. Oceanography and Marine Biology – an Annual Review 46, 297–330.
| Otolith chemistry to describe movements and life-history parameters of fishes: hypotheses, assumptions, limitations and inferences.Crossref | GoogleScholarGoogle Scholar |
Elsdon, T. S., and Gillanders, B. M. (2003). Reconstructing migratory patterns of fish based on environmental influences on otolith chemistry. Reviews in Fish Biology and Fisheries 13, 217–235.
| Reconstructing migratory patterns of fish based on environmental influences on otolith chemistry.Crossref | GoogleScholarGoogle Scholar |
Gelman, A., Carlin, J. B., Stern, H. S., and Rubin, D. B. (2014). ‘Bayesian Data Analysis’, 2nd edn. (Chapman and Hall/CRC Press: Boca Raton, FL, USA.)
Hanson, P. J., Koenig, C. C., and Zdanowicz, V. S. (2004). Elemental composition of otoliths used to trace estuarine habitats of juvenile gag Mycteroperca microlepis along the west Florida shelf. Marine Ecology Progress Series 267, 253–265.
| Elemental composition of otoliths used to trace estuarine habitats of juvenile gag Mycteroperca microlepis along the west Florida shelf.Crossref | GoogleScholarGoogle Scholar | 1:CAS:528:DC%2BD2cXkt1KktLw%3D&md5=bc1dcfde016b5b6007d148bea1c4021cCAS |
Høie, H., Folkvord, A., and Otterlei, E. (2003). Effect of somatic and otolith growth rate on stable isotopic composition of early juvenile cod (Gadus morhua L) otoliths. Journal of Experimental Marine Biology and Ecology 289, 41–58.
| Effect of somatic and otolith growth rate on stable isotopic composition of early juvenile cod (Gadus morhua L) otoliths.Crossref | GoogleScholarGoogle Scholar |
Høie, H., Otterlei, E., and Folkvord, A. (2004). Temperature-dependent fractionation of stable oxygen isotopes in otoliths of juvenile cod (Gadus morhua L.). ICES Journal of Marine Science 61, 243–251.
| Temperature-dependent fractionation of stable oxygen isotopes in otoliths of juvenile cod (Gadus morhua L.).Crossref | GoogleScholarGoogle Scholar |
Komárek, A. (2009). A new R package for Bayesian estimation of multivariate normal mixtures allowing for selection of the number of components and interval-censored data. Computational Statistics & Data Analysis 53, 3932–3947.
| A new R package for Bayesian estimation of multivariate normal mixtures allowing for selection of the number of components and interval-censored data.Crossref | GoogleScholarGoogle Scholar |
Komárek, A. (2014). Package mixAK: multivariate normal mixture models and mixtures of generalized linear mixed models including model based clustering. R package description (version 3.8). Available at http://msekce.karlin.mff.cuni.cz/~komarek [Verified 1 November 2014].
McMahon, K. W., Hamady, L. L., and Thorrold, S. R. (2013). A review of ecogeochemistry approaches to estimating movements of marine animals. Limnology and Oceanography 58, 697–714.
| A review of ecogeochemistry approaches to estimating movements of marine animals.Crossref | GoogleScholarGoogle Scholar | 1:CAS:528:DC%2BC3sXlvFyksLo%3D&md5=7fe8d27100a0994ac5548564985c43d1CAS |
Mitchell, W. A., Kellison, G. T., Bacheler, N. M., Potts, J. C., Schobernd, C. M., and Hale, L. F. (2014). Depth-related distribution of postjuvenile red snapper in southeastern U.S. Atlantic Ocean waters: ontogenic patterns and implications for management. Marine and Coastal Fisheries 6, 142–155.
| Depth-related distribution of postjuvenile red snapper in southeastern U.S. Atlantic Ocean waters: ontogenic patterns and implications for management.Crossref | GoogleScholarGoogle Scholar |
Patterson, W. F., Watterson, J. C., Shipp, R. L., and Cowan, J. H. (2001). Movement of tagged red snapper in the northern Gulf of Mexico. Transactions of the American Fisheries Society 130, 533–545.
| Movement of tagged red snapper in the northern Gulf of Mexico.Crossref | GoogleScholarGoogle Scholar |
Patterson, W. F., Wilson, C. A., Bentley, S. J., Cowan, J. H., Henwood, T., Allen, Y. C., and Dufrene, T. A. (2005). Delineating juvenile red snapper habitat on the northern Gulf of Mexico continental shelf. American Fisheries Society Symposium 41, 277–288.
Patterson, W. F., Cowan, J. H., Wilson, C. A., and Chen, Z. (2008). Temporal and spatial variability in juvenile red snapper otolith elemental signatures in the northern Gulf of Mexico. Transactions of the American Fisheries Society 137, 521–532.
| Temporal and spatial variability in juvenile red snapper otolith elemental signatures in the northern Gulf of Mexico.Crossref | GoogleScholarGoogle Scholar |
Patterson, W. F., Barnett, B. K., Zapp Sluis, M., Cowan, J. H., and Shiller, A. M. (2014). Interspecific variation in juvenile snapper otolith chemical signatures in the northern Gulf of Mexico. Aquatic Biology 21, 1–10.
| Interspecific variation in juvenile snapper otolith chemical signatures in the northern Gulf of Mexico.Crossref | GoogleScholarGoogle Scholar |
Plummer, M. (2008). Penalized loss functions for Bayesian model comparison. Biostatistics (Oxford, England) 9, 523–539.
| Penalized loss functions for Bayesian model comparison.Crossref | GoogleScholarGoogle Scholar |
R Core Team (2014). R: a language and environment for statistical computing. (R Foundation for Statistical Computing: Vienna, Austria.) Available at http://www.r-project.org [Verified 6 October 2014].
Radabaugh, K. R., Hollander, D. J., and Peebles, E. B. (2013). Seasonal δ13C and δ15N isoscapes of fish populations along a continental shelf trophic gradient. Continental Shelf Research 68, 112–122.
| Seasonal δ13C and δ15N isoscapes of fish populations along a continental shelf trophic gradient.Crossref | GoogleScholarGoogle Scholar |
Rindone, R., Kellison, T., and Bortone, S. (2015). Data availability for red snapper in Gulf of Mexico and southeastern U.S. Atlantic Ocean waters. North American Journal of Fisheries Management 35, 191–204.
| Data availability for red snapper in Gulf of Mexico and southeastern U.S. Atlantic Ocean waters.Crossref | GoogleScholarGoogle Scholar |
Robins, C. R., Ray, G. C., Douglass, J., and Freund, R. (1986). ‘A Field Guide to Atlantic Coast Fishes North America.’ (Houghton Mifflin: New York.)
SEDAR (2008). SEDAR 15 stock assessment report 1 (SAR 1) – South Atlantic red snapper. (South East Data, Assessment, and Review.) Available at http://www.sefsc.noaa.gov/sedar/download/S15%20SAR%201%20Revised%203-09.pdf?id=DOCUMENT [Verified 6 October 2014.]
SEDAR (2010). SEDAR 24 stock assessment report – South Atlantic red snapper. (South East Data, Assessment, and Review.) Available at http://www.sefsc.noaa.gov/sedar/download/SEDAR%2024_SAR_October%202010_26.pdf?id=DOCUMENT [Verified 6 October 2014.]
SEDAR (2013). SEDAR 31 – Gulf of Mexico red snapper stock assessment report. (South East Data, Assessment, and Review.) Available at http://www.sefsc.noaa.gov/sedar/download/SEDAR%2031%20SAR-%20Gulf%20Red%20Snapper_sizereduced.pdf?id=DOCUMENT [Verified 15 November 2014].
Sturgeon, R. E., Willie, S. N., Yang, L., Greenberg, R., Spatz, R. O., Chen, Z., Scriver, C., Clancy, V., Lam, J. W., and Thorrold, S. (2005). Certification of a fish otolith reference material in support of quality assurance for trace element analysis. Journal of Analytical Atomic Spectrometry 20, 1067–1071.
| Certification of a fish otolith reference material in support of quality assurance for trace element analysis.Crossref | GoogleScholarGoogle Scholar | 1:CAS:528:DC%2BD2MXhtVemtbfI&md5=365b9553bb695257295ebd4e7dcbf2b1CAS |
White, J. W., Standish, J. D., Thorrold, S. R., and Warner, R. R. (2008). Markov Chain Monte Carlo methods for assigning larvae to natal sites using natural geochemical tags. Ecological Applications 18, 1901–1913.
| Markov Chain Monte Carlo methods for assigning larvae to natal sites using natural geochemical tags.Crossref | GoogleScholarGoogle Scholar | 19263887PubMed |
Workman, I. K., and Foster, D. G. (1994). Occurrence and behavior of juvenile red snapper, Lutjanus campechanus, on commercial shrimp fishing grounds in the northeastern Gulf of Mexico. Marine Fisheries Review 56, 9–11.
Workman, I., Shah, A., Foster, D., and Hataway, B. (2002). Habitat preferences and site fidelity of juvenile red snapper (Lutjanus campechanus). ICES Journal of Marine Science 59, S43–S50.
| Habitat preferences and site fidelity of juvenile red snapper (Lutjanus campechanus).Crossref | GoogleScholarGoogle Scholar |
Zapp Sluis, M., Barnett, B. K., Patterson, W. F., Cowan, J. H., and Shiller, A. M. (2012). Discrimination of juvenile red snapper otolith chemical signatures from Gulf of Mexico nursery regions. Marine and Coastal Fisheries 4, 587–598.
| Discrimination of juvenile red snapper otolith chemical signatures from Gulf of Mexico nursery regions.Crossref | GoogleScholarGoogle Scholar |