

Estimating the area burned by agricultural fires from Landsat 8 Data using the Vegetation Difference Index and Burn Scar Index
Shudong Wang A , Muhammad Hasan Ali Baig B , Suhong Liu C , Huawei Wan D , Taixia Wu D F and Yingying Yang EA Institute of Remote Sensing and Digital Earth, Chinese Academy of Sciences, Beijing 100101, China.
B Institute of Geo-Information and Earth Observation (IGEO), Pir Mehr Ali Shah Arid Agriculture University, Rawalpindi, 46300, Pakistan.
C School of Geography, Beijing Normal University, Beijing 100875, China.
D Satellite Environment Centre, Ministry of Environmental Protection, Beijing 100094, China.
E School of Earth Sciences and Engineering, Hohai University, Nanjing, 211100, China.
F Corresponding author. Email: wutx@hhu.edu.cn
International Journal of Wildland Fire 27(4) 217-227 https://doi.org/10.1071/WF17069
Submitted: 19 April 2017 Accepted: 15 February 2018 Published: 10 April 2018
Journal Compilation © IAWF 2018 Open Access CC BY-NC-ND
Abstract
Obtaining an accurate estimate of the area of burned crops through remote sensing provides extremely useful data for the assessment of fire-induced trace gas emissions and grain loss in agricultural areas. A new method, incorporating the Vegetation Difference Index (VDI) and Burn Scar Index (BSI) models, is proposed for the extraction of burned crops area. The VDI model can greatly reduce the confounding effect of background information pertaining to green vegetation (forests and grasslands), water bodies and buildings; subsequent use of the BSI model could improve the accuracy of burned area estimations because of the reduction in the influence of background information. The combination of VDI and BSI enables the VDI to reduce the effect of non-farmland information, which in turn improves the accuracy and speed of the BSI model. The model parameters were established, and an effects analysis was performed, using a normalized dispersion value simulation based on a comparison of different types of background information. The efficacy of the VDI and BSI models was tested for a winter wheat planting area in the Haihe River Basin in central China. In comparison with other models, it was found that this method could effectively extract burned area information.
Additional keywords: remote sensing of environment.
Introduction
Farmers worldwide often remove excess crop residue from fields by burning farmland. The economic benefits of crop residue utilisation are not high, and burning is a quick and cheaper management method. Fire can also remove weeds, pests and diseases, enabling farmers to prepare the next crop (McCarty et al. 2009). In the early ripening season (mostly early June) in winter wheat planting areas such as the Haihe River Basin in northern China, it is easy for farmers to lose control of fires owing to dry weather, wind and other natural factors. This can result in the loss of unharvested crops. Frequent farmland fires have serious consequences, such as fire-induced trace gas emissions (Andreae and Crutzen 1997; Andreae and Merlet 2001; Yang et al. 2008; Hao and Larkin 2014) and grain loss. Farmland fires that spread to neighbouring grasslands and forests are also one of the main causes of wildland fires (Houghton et al. 2000). Some of these fires are caused by stubble and straw burning, whereas others involve the burning of mature crops and are made worse by dry conditions (Maingi and Henry 2007; Vadrevu and Lasko 2015). Because of the randomness and rapid spread of fires on farmland such as the winter wheat planting area in the Haihe River Basin, fire managers find it difficult to determine the location of fires and measure the extent of burned area. Retrieval of accurate burned area data is essential for determining the source of wildland fire, and modelling air pollution and grain loss (França et al. 2014).
Most previous studies estimating burned area through remote sensing have classified images using principal component analysis and vegetation indices (Carlson and Ripley 1997; Chuvieco et al. 2002; Domenikiotis et al. 2002; Hudak and Brockett 2004; Mitri and Gitas 2004; Kučera et al. 2005; Loboda et al. 2007; Maingi and Henry 2007; Smith et al. 2007; Chuvieco et al. 2008; Palandjian et al. 2009; Stroppiana et al. 2009; Boschetti et al. 2010; Bastarrika et al. 2011; Parker et al. 2015). Many studies have relied on the Normalized Difference Vegetation Index (NDVI), including modified versions to reduce the sensitivity of the index to different atmospheric and soil conditions (Chuvieco et al. 2002; Domenikiotis et al. 2002; Kučera et al. 2005; Stroppiana et al. 2009; Veraverbeke et al. 2011a). Some of these modified NDVI indices, such as the Enhanced Vegetation Index (EVI), Soil Adjusted Vegetation Index (SAVI) and Modified Soil-Adjusted Vegetation Index (MSAVI), have been used effectively for burned area estimation in a range of habitats such as forests and grasslands (Huete 1988; Pinty and Verstraete 1992; Qi et al. 1994; Huete et al. 2002). Some researchers have also proposed other spectral indices, such as the Burned Area Index (BAI) and Normalized Burned Ratio (NBR) (Chuvieco et al. 2002; French et al. 2008; Veraverbeke et al. 2010b; Araújo and Ferreira 2015), which are particularly sensitive to the spectral features of a burned area. However, the existence of different land types can easily lead to spectral confusion for burned areas and spectrally similar areas, such as water bodies, roads and buildings, which results in uncertainties in burn scar models, largely due to the difficulty in determining threshold values for these models (Lasaponara 2006; Stroppiana et al. 2009; Boschetti et al. 2010; Veraverbeke et al. 2011a, 2011b; Boschetti et al. 2015). To deal with this type of spectral complexity (spectral mixing), various models and methods have been used to highlight fire-induced changes in pre- and post-fire imagery; however, this can potentially create additional constraints in relation to image-to-image normalisation (Conghe Song and Woodcock 2003; Verbyla et al. 2008; Veraverbeke et al. 2010a, 2010b, 2011a, 2011b).
A few remote sensing methods have been used to extract burn scar information, with a focus mainly on forests, grasslands and other non-farmland land types. Only a few models and methods have addressed the issue of identifying burned areas within farmland. Cultivated land is often distributed unevenly and characterised by a mixture of different land-use types, such as rural settlements, mines, water conservation and irrigation facilities, rivers, lakes and asphalt roads. As a result, different land types often share the same spectra, which creates interference when burn scar information is extracted from remote sensing data. In addition, because of differences in crop types and planting times, the distribution of crop stubble, as well as the presence of mature and non-mature crops, is likely to cause interference, leading to uncertainty in estimations of burned crop area.
The main purpose of the present study was to develop a method for effectively extracting information on the burned crop area caused by agricultural fires from remotely sensed data. Considerable spectral confusion exists in relation to distinguishing burned areas from areas with similar surface features in monotemporal imagery (Lasaponara 2006; Stroppiana et al. 2009; Veraverbeke et al. 2011b). The following issues are of considerable importance regarding the extraction of precise information on burned areas: (1) the method should allow rapid identification of the spatial distribution of mature crops in such a way that researchers can determine the possible range of a burned area, and can reduce the complexity of background information; (2) furthermore, the method can clearly highlight burned areas and integrate different types of background information, for example on mature crops and stubble.
To test the accuracy of the proposed method in determining the locations of burned areas, we selected the winter wheat planting area in the Haihe River Basin. The growth curve features extrapolated from a time series of Moderate Resolution Imaging Spectroradiometer (MODIS) data; based on this, two NDVI images extracted from Landsat 8 data were selected for this area. Burned areas with different spectral features, based on the band features of Landsat 8 data, were analysed and a burn scar index (BSI) was then constructed for extracting information on the burned area. Model application and validation were conducted for the winter wheat planting area of the Haihe River Basin. The method greatly improved the accuracy of satellite image-based burn scar estimates of burnt areas resulting from farmland fires. It can also be used to determine the local and regional contributions of particulate and trace gas emissions, which affect both air quality and public health (McCarty et al. 2009; Li et al. 2014; Chen et al. 2017).
Study area, data collection and data processing
Study area
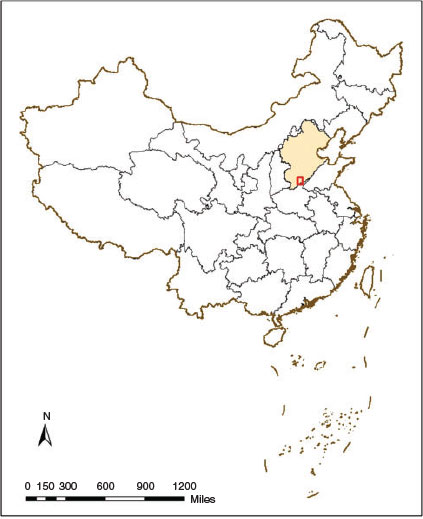
The Haihe River Basin, China’s major grain production base, is located in central China, and covers a total area of 318 200 km2. The study area is located west of the Haihe River Basin and the main grain crops include winter wheat and maize, as shown in Fig. 1. The mean annual temperature in the study area ranges from 12.7 to 13.7°C, whereas the mean annual precipitation is about 600 mm, based on data from the Anyang Meteorological Bureau. Only sparse precipitation occurs during spring and the air is generally dry; therefore, winter wheat normally requires irrigation. After the winter wheat reaches maturity or is harvested, prescribed fires or wildfires in farmland areas may cause serious air pollution and a loss of grain harvesting opportunities. On 9 June 2015, an agricultural wildfire disaster resulted in the loss of many human lives and large amounts of grain in the study area.
|
Data collection
Soil, winter wheat and burned area spectral data were collected through field experiments during winter wheat growth and maturity periods. Winter wheat spectral data were collected from 4 April to 3 June in both 2001 and 2002, and stubble and burn spectral data were collected from 9 to 14 June 2015.
An ASD FieldSpec3 spectrometer (Analytical Spectral Devices, Boulder, CO, USA) and a PSR spectrometer (Spectral Evolution Co., Lawrence, MA, USA) were used for field data collection. These devices have a bandwidth between 350 and 2500 nm, a viewing angle of 25° and a height of 20 cm to the measured sample. Measurements were conducted on sunny days with favourable visibility according to the criterion of 3 days in a row without precipitation prior to spectral measurement. The areas surrounding the measurement points were broad, with no large obstructions, and the measurements were conducted at the local time of 1000–1400 hours. Each sample was measured 10 times, and the average reflectance of each sample was then calculated. The total collected sample number was 212. Portions of the spectrum near 1900 nm were removed because of noise.
Data processing
A time series of MODIS 09A data products was selected for crop growth curve analysis. Landsat 8 reflectance data were used for the vegetation difference index (VDI) and BSI models, and Gaofen-1 satellite (GF-1) (Jia et al. 2016) data were used for model validation (Table 1). A topographic map with a scale of 1 : 100 000, and some latitude and longitude coordinates, were derived from a Google Earth map of the study area, enabling geometric rectification to be conducted.

|
ENVI software (ver. 4.8; ITT Visual Solutions, Boulder, CO, USA) was used for spatial geometric precision correction. The correction was accurate to within half a pixel, which enabled transformation of the data into a universal transverse Mercator (UTM) projection.
Method and model
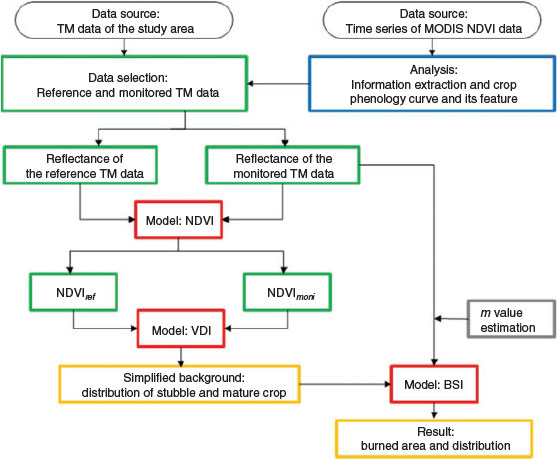
All analyses of the burned area estimates for the study region were conducted using ENVI software (ver. 4.8). Fig. 2 is a flowchart of the steps implemented to satisfy the study objectives. The methodology can be divided into four parts: (i) deriving a crop phenology curve from a time series of MODIS NDVI data, which is used to select the date of the TM image. The reference TM image was obtained during the vigorous growth period of the winter wheat; the monitored TM image was obtained just after the fire; (ii) development of a burned area extraction method based on VDI and BSI; (iii) cross-comparison with the results from a previous model (Table 2); and (iv) burned area simulation using VDI and BSI.
|

|
Spectral analysis of the typical underlying surfaces in the study area
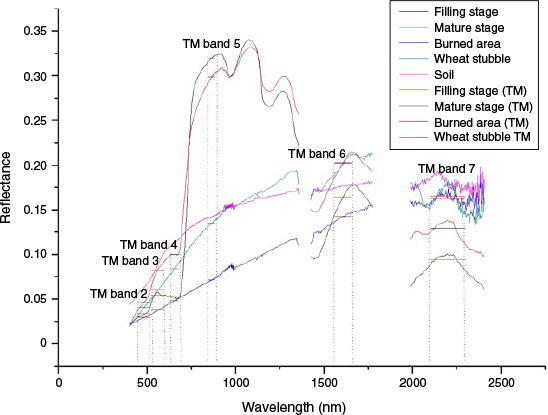
Ground spectral measurements of the typical underlying surfaces in the study area were conducted using a portable ground object spectrometer (Model PSR-3500m Spectral Evolution Co.), with the spectrum ranging from 400 to 2500 nm (Figs 3 and 4). Moisture absorption bands at 1360–1420 and 1780–1986 nm were removed from the curves.

|
|
As shown in Fig. 4, the winter wheat reflectance spectrum for the filling stage peaked at 530 and 1610 nm, with absorption troughs at 680 and 1420 nm and a high reflection region between 760 and 1300 nm. The trend in the variation of the spectrum for mature winter wheat was similar to that of green winter wheat, although the reflection peaks and absorption valleys were more obvious in the former. The reflection peaks and absorption troughs of mature winter wheat in the infrared region (760–1100 nm) were lower than those at the filling stage, whereas in the other bands, they were higher.
The trend in the variation of the burned area spectrum was similar to that of the stubble and soil spectra throughout the entire spectral range. The reflectance of the burned area was generally weak in the 400–1800-nm band range, while it was higher than that of mature winter wheat and the filling stage at 1800–2500 nm. The curve in the 1800–2500-nm region was similar to those of soil and stubble. This result was similar to that reported in previous studies (Lasaponara 2006; Smith et al. 2007; Chuvieco et al. 2008). The purpose of the ground spectral measurements was to obtain the features of different underlying surfaces and then use them to select bands from Thematic Mapper (TM) images. For certain features, the second to seventh TM bands overlapped the spectrum curves measured by the spectrometer, as shown by the short horizontal lines in Fig. 4.
Time series of the NDVI analysis
For the VDI parameters  and
and  ,
,  in the subtrahend represents the NDVI value during the growth period, and
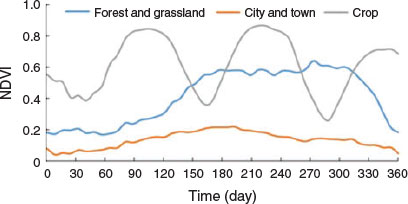
  represents the NDVI value during the mature period. An analysis of the NDVI curves for different growth stages of the typical underlying surfaces was conducted in the Haihe River Basin (Fig. 5). The NDVI curve from the time series of the MODIS data was used to analyse trends in the NDVI with respect to differences between crop area and other typical underlying surfaces, such as forests and grasslands, and cities and towns. The time series of NDVI values for winter wheat began to increase from Julian day 40 and peaked between Julian days 90 and 120, when the curve began to decline, reaching its lowest value at approximately Julian day 170 (Fig. 5).
|
In comparison with the NDVI curves of forests and grasslands, and of cities and towns, the NDVI curves of the winter wheat were higher before Julian day 140, but declined before Julian day 170. From the above analysis, it is clear that the NDVI curve of winter wheat changed over time, and was also different from that of forests and grasslands as well as cities and towns.
The models and their parameters
The VDI model
Based on the above time series of NDVI curve analysis, a VDI was developed, and specific models and parameters were configured as below:

where the NDVI is given by  . RNir and RRed are the fifth (near-infrared (NIR)) and fourth (red) bands of the Landsat 8 sensor respectively.
  in the equation represents the NDVI value during the growth period and
  represents the NDVI value during the mature period.
The BSI model and its parameters
Previous observations and analyses (Veraverbeke et al. 2011a) demonstrated a low discriminatory power for the visible spectral region, and indicated that the highest sensitivity is in the short-wave infrared (SWIR) spectral region.
The specific parameters of the BSI are described below. Background features such as soil, stubble and mature crop, can be defined as:
where  , RRed, RNir, and
  are Landsat 8 bands 7 (SWIR 2), 4 (red), 5 (NIR) and 3 (green) respectively. The equation
  is proposed based on spectral analysis of the relationship between the burned area and the background information. The
  value of a burned area is similar to those of soil and stubble, and is higher than that of a mature crop. However, the
  value of a burned area is lower than those of soil, stubble and mature winter wheat. In the denominator, m is an adjustment factor. An appropriate value of m for
  can highlight burned areas, reduce the influence of background information, and reduce differences between the different types of background information (thereby reducing uncertainty in the estimation of burned areas). A value of 4 for m was considered appropriate for the present study according to the simulation analysis (Tables 3 and 4).
|
|
C denotes comparison between various types of background information and the information valuable for the BSI.


where  is the mean BSI of the burned stubble area retrieved from a Landsat 8 image,
  is the mean BSI of the burned mature crop area in the same image,
  is the mean BSI of the unburned stubble area, and
  is the mean BSI of the unburned mature crop area. C() is the difference between the two compared parameters; the larger the value of C(), the greater the difference between the two compared parameters. The proportions of these different land-cover types within burned and unburned areas were validated by field sampling and high-resolution satellite images (i.e. GF-1 data). Based on the classification results for the Landsat 8 image, the locations of the samples were obtained and the mean value of each cover type was calculated.
To facilitate the analysis, the range of C() was normalized to (0,1) (Wang et al. 2015).  is the maximum value of
  ,
,  ,
,  and
and  , calculated as follows:


where  ,
,  ,
,  , and
, and  are the normalized values of
  ,
,  ,
,  , and
, and  respectively.
Results and discussion
Estimation of m
By retrieving the values of  ,
,  ,
,  and
and  for the study area from a Landsat 8 image, a set of m values from 0 to 10 was obtained in increments of 0.5. The m values of 0, 2, 4 and 6 were selected and used in example calculations. Then, the BSI and C() values were calculated, as shown in Table 3. The maximum values of
  ,
,  ,
,  , and
, and  were calculated for different values of m.
  ,
,  ,
,  , and
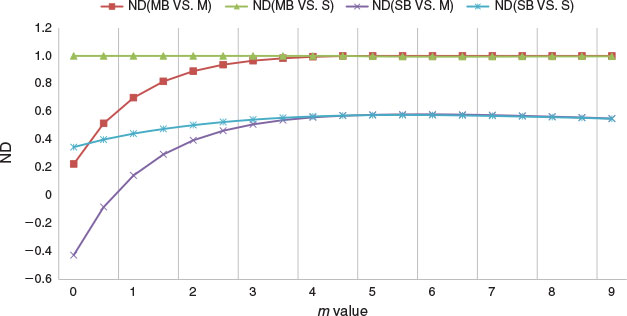
, and  were calculated as shown in Table 4. Fig. 6 shows the four ND() curves with m values ranging from 0 to 10, in increments of 0.5. An ND() value of 1 indicates that the two parameters being compared are totally distinct, whereas the closer the value is to 0, the less distinct are the parameters. In Fig. 6, in a comparison of the different m values for the BSI model, each of the four ND() curves reaches a saturation value when m is close to 4. A BSI model in which m = 4 has a high compression capability and can provide detailed background information.
|
Verification of the VDI and BSI models
Verification of the VDI model
The VDI model was prepared using two NDVI images extracted from Landsat 8 data (Fig. 7) and 950 groups of BSI values were obtained from field samples and high-spatial-resolution GF-1 satellite data. The 2-m-resolution GF-1 remote sensing fusion data were based on the multispectral and panchromatic bands images by using the Nearest Neighbor Decision (NND) fusion method. The overall precision of the model exceeded 95% with respect to estimation of mature winter wheat and stubble areas.

|
Mature winter wheat data could be extracted with the VDI model by setting a threshold, with the results indicating that an obvious difference between  and
and  values allows more effective extraction. Therefore, a large NDVI value as
  and small NDVI value as
  should be selected to present a very different trend in the change in forest and grassland and cities and towns, from that in winter wheat cover between Julian days 140 and 170 (Fig. 8).

|
Verification of the BSI model
The accuracy of the BSI model was verified through an intercomparison of 286 groups of Landsat-based BSI values with objects observed in high-resolution satellite imagery and field surveys. The accuracy assessment was performed within a short period of time after Landsat data acquisition. The validated burned area, roads and crop residue were obtained by field surveys and high-resolution remote sensing images (GF-1). The specific features corresponding to each class were digitised in the high-resolution images. The digitised features representing burned area, crop residue and roads were then used to produce a random stratified point sample for each class. Finally, this random sample of points was used as the ground truth for accuracy assessment of the Landsat-based classification. The false-positive, false-negative, missing alarm and false alarm (Table 5) rates were found to be acceptable according to evaluation of the target detection accuracy (Burke et al. 1988; Lienhart and Maydt 2002; Dumitrescu et al. 2003; Tyre et al. 2003).
|
Compared with other models, such as SAVI, the Char Soil Index (CSI) and BAI, the new method presented herein is clearly more effective for estimating burn scar areas.
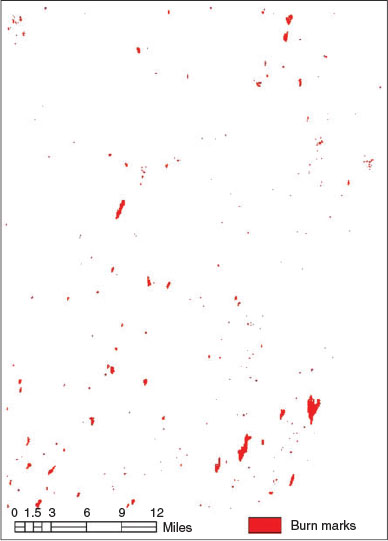
Based on the BSI data in Fig. 9, a number of conclusions can be drawn. (1) The BSI model can estimate burned areas, such as in Fig. 9c, but shadows from clouds may result in misidentification (as seen in Fig. 9f) due to spectral differences between shallow cloud, smoke and burned areas. (2) Burned areas differed markedly in shape and size (Fig. 10). Large areas represent severe wildfires in mature winter wheat or stubble areas; within these areas, some of the fires were natural wildfires, whereas others were caused by straw burning. (3) A large number of burned areas were apparent in the images, indicating that agricultural wildfires generally occur during the winter wheat harvesting season, and these fires may cause air pollution and grain loss.

|
|
Conclusions
To summarise, the following conclusions can be drawn. (1) Accurate identification of a crop planting area requires highly precise information on burned areas. During the harvest period, wildfires are often caused by prescribed fires that were set to burn crop straw or stubble. These wildfires are a direct cause of air pollution and grain loss, especially in north and north-east China (Shi et al. 2014; Long et al. 2016). The occurrence of wildfires is related to local climatic conditions and land-management practices. Therefore, local fire management personnel need to monitor both prescribed fires and areas affected by wildfires. (2) The VDI model may effectively simplify background information during monitoring of burned areas. Using to differences between the growth curves of crop areas and sources of background information, the VDI model was developed, which can be used to effectively estimate mature crop areas in regions where wildfires may occur. Through the use of the VDI model, certain types of background information, such as the locations of water bodies, grasslands and roads can be filtered out, with the result that the BSI model may be more effective for estimating burned areas. (3) The simulations and experiments conducted during this study showed that the BSI model was moderately reliable in determining crop areas. The parameters used in the BSI model were applied to the winter wheat planting area in the Haihe River Basin. The results showed that the BSI model may be sufficiently precise for monitoring burned areas; the VDI model was also shown to be effective.
However, when a comprehensive analysis was performed using a combination of on-site investigation, simulation analysis and remote sensing mapping, it was evident that the VDI model was more suitable for monitoring early harvest crops. The early harvest crop areas showed a different trend in cover changes to those of forests and grasslands, and cities and towns during the harvest period. When the growth curve trend changes, the VDI model should be adjusted according to crop type. With the BSI model, it was also difficult to differentiate burned areas of mature crops from burned areas of stubble because of the complexity of the soil spectrum in of burned stubble areas.
Conflicts of interest
The authors declare they have no conflicts of interest.
Acknowledgements
Research grants from the National Science Foundation of China (Grant no.s 41371359, 41671362), the Fundamental Research Funds for the Central Universities (Grant no. 2017B05114) and the Major Special Project – the China High-Resolution Earth Observation System (30-Y30B13-9003-14/16) supported this research. The authors would like to thank the anonymous reviewers for their helpful and constructive feedback.
References
Andreae MO, Crutzen PJ (1997) Atmospheric aerosols: biogeochemical sources and role in atmospheric chemistry. Science 276, 1052–1058.| Atmospheric aerosols: biogeochemical sources and role in atmospheric chemistry.Crossref | GoogleScholarGoogle Scholar | 1:CAS:528:DyaK2sXjt12ls7g%3D&md5=1502519a6996d7958b5e6a4457c79461CAS |
Andreae MO, Merlet P (2001) Emission of trace gases and aerosols from biomass burning. Global Biogeochemical Cycles 15, 955–966.
| Emission of trace gases and aerosols from biomass burning.Crossref | GoogleScholarGoogle Scholar | 1:CAS:528:DC%2BD38XjtV2iuw%3D%3D&md5=44274c660edd55c93a0578f570e0ddf5CAS |
Araújo FMD, Ferreira LG (2015) Satellite-based automated burned area detection: a performance assessment of the MODIS MCD45A1 in the Brazilian savanna. International Journal of Applied Earth Observation and Geoinformation 36, 94–102.
| Satellite-based automated burned area detection: a performance assessment of the MODIS MCD45A1 in the Brazilian savanna.Crossref | GoogleScholarGoogle Scholar |
Bastarrika A, Chuvieco E, Pilar Martin M (2011) Mapping burned areas from Landsat TM/ETM plus data with a two-phase algorithm: balancing omission and commission errors. Remote Sensing of Environment 115, 1003–1012.
| Mapping burned areas from Landsat TM/ETM plus data with a two-phase algorithm: balancing omission and commission errors.Crossref | GoogleScholarGoogle Scholar |
Boschetti M, Stroppiana D, Brivio PA (2010) Mapping burned areas in a Mediterranean environment using soft integration of spectral indices from high-resolution satellite images. Earth Interactions 14, 1–20.
| Mapping burned areas in a Mediterranean environment using soft integration of spectral indices from high-resolution satellite images.Crossref | GoogleScholarGoogle Scholar |
Boschetti L, Roy DP, Justice CO, Humber ML (2015) MODIS–Landsat fusion for large-area 30-m burned area mapping. Remote Sensing of Environment 161, 27–42.
| MODIS–Landsat fusion for large-area 30-m burned area mapping.Crossref | GoogleScholarGoogle Scholar |
Burke DS, Brundage JF, Redfield RR, Damato JJ, Schable CA, Putman P, Visintine R, Kim HI (1988) Measurement of the false positive rate in a screening program for human immunodeficiency virus infections. The New England Journal of Medicine 319, 961–964.
| Measurement of the false positive rate in a screening program for human immunodeficiency virus infections.Crossref | GoogleScholarGoogle Scholar | 1:STN:280:DyaL1czjsVKmuw%3D%3D&md5=7506627102b539db205f3c4ce4388adbCAS |
Carlson TN, Ripley DA (1997) On the relation between NDVI, fractional vegetation cover, and leaf area index. Remote Sensing of Environment 62, 241–252.
| On the relation between NDVI, fractional vegetation cover, and leaf area index.Crossref | GoogleScholarGoogle Scholar |
Chen W, Tong DQ, Dan M, Zhang S, Zhang X, Pan Y (2017) Typical atmospheric haze during crop harvest season in north-eastern China: a case in the Changchun region. Journal of Environmental Sciences 54, 101–113.
| Typical atmospheric haze during crop harvest season in north-eastern China: a case in the Changchun region.Crossref | GoogleScholarGoogle Scholar |
Chuvieco E, Martin MP, Palacios A (2002) Assessment of different spectral indices in the red–near-infrared spectral domain for burned land discrimination. International Journal of Remote Sensing 23, 5103–5110.
| Assessment of different spectral indices in the red–near-infrared spectral domain for burned land discrimination.Crossref | GoogleScholarGoogle Scholar |
Chuvieco E, Englefield P, Trishchenko AP, Luo Y (2008) Generation of long time series of burn area maps of the boreal forest from NOAA-AVHRR composite data. Remote Sensing of Environment 112, 2381–2396.
| Generation of long time series of burn area maps of the boreal forest from NOAA-AVHRR composite data.Crossref | GoogleScholarGoogle Scholar |
Domenikiotis C, Dalezios NR, Loukas A, Karteris M (2002) Agreement assessment of NOAA/AVHRR NDVI with Landsat TM NDVI for mapping burned forested areas. International Journal of Remote Sensing 23, 4235–4246.
| Agreement assessment of NOAA/AVHRR NDVI with Landsat TM NDVI for mapping burned forested areas.Crossref | GoogleScholarGoogle Scholar |
Dumitrescu S, Wu X, Wang Z (2003) Detection of LSB steganography via sample pair analysis. IEEE Transactions on Signal Processing 51, 1995–2007.
| Detection of LSB steganography via sample pair analysis.Crossref | GoogleScholarGoogle Scholar |
França D, Longo K, Rudorff B, Aguiar D, Freitas S, Stockler R, Pereira G (2014) Pre-harvest sugarcane burning emission inventories based on remote sensing data in the state of Sao Paulo, Brazil. Atmospheric Environment 99, 446–456.
| Pre-harvest sugarcane burning emission inventories based on remote sensing data in the state of Sao Paulo, Brazil.Crossref | GoogleScholarGoogle Scholar |
French NHF, Kasischke ES, Hall RJ, Murphy KA, Verbyla DL, Hoy EE, Allen JL (2008) Using Landsat data to assess fire and burn severity in the North American boreal forest region: an overview and summary of results. International Journal of Wildland Fire 17, 443–462.
| Using Landsat data to assess fire and burn severity in the North American boreal forest region: an overview and summary of results.Crossref | GoogleScholarGoogle Scholar |
Hao WM, Larkin NK (2014) Wildland fire emissions, carbon, and climate: wildland fire detection and burned area in the United States. Forest Ecology and Management 317, 20–25.
| Wildland fire emissions, carbon, and climate: wildland fire detection and burned area in the United States.Crossref | GoogleScholarGoogle Scholar |
Houghton R, Hackler J, Lawrence K (2000) Changes in terrestrial carbon storage in the United States. 2: The role of fire and fire management. Global Ecology and Biogeography 9, 145–170.
| Changes in terrestrial carbon storage in the United States. 2: The role of fire and fire management.Crossref | GoogleScholarGoogle Scholar |
Hudak AT, Brockett BH (2004) Mapping fire scars in a southern African savannah using Landsat imagery. International Journal of Remote Sensing 25, 3231–3243.
| Mapping fire scars in a southern African savannah using Landsat imagery.Crossref | GoogleScholarGoogle Scholar |
Huete AR (1988) A soil-adjusted vegetation index (SAVI). Remote Sensing of Environment 25, 295–309.
| A soil-adjusted vegetation index (SAVI).Crossref | GoogleScholarGoogle Scholar |
Huete A, Didan K, Miura T, Rodriguez EP, Gao X, Ferreira LG (2002) Overview of the radiometric and biophysical performance of the MODIS vegetation indices. Remote Sensing of Environment 83, 195–213.
| Overview of the radiometric and biophysical performance of the MODIS vegetation indices.Crossref | GoogleScholarGoogle Scholar |
Jia K, Liang S, Gu X, Baret F, Wei X, Wang X, Yao Y, Yang L, Li Y (2016) Fractional vegetation cover estimation algorithm for Chinese GF-1 wide field view data. Remote Sensing of Environment 177, 184–191.
| Fractional vegetation cover estimation algorithm for Chinese GF-1 wide field view data.Crossref | GoogleScholarGoogle Scholar |
Key C, Benson N (2006) Landscape assessment: remote sensing of severity, the Normalized Burn Ratio and ground measure of severity, the Composite Burn Index. In ‘FIREMON: fire effects monitoring and inventory system. RMRS-GTR-164-CD’. (Eds D Lutes, R Keane, J Caratti, C Key, N Benson, S Sutherland, L Gangi) pp. LA 1–51. (USDA Forest Service, Rocky Mountain Research Station: Ogden, UT, USA)
Kučera J, Yasuoka Y, Dye DG (2005) Creating a forest fire database for the Far East of Asia using NOAA/AVHRR observation. International Journal of Remote Sensing 26, 2423–2439.
| Creating a forest fire database for the Far East of Asia using NOAA/AVHRR observation.Crossref | GoogleScholarGoogle Scholar |
Lasaponara R (2006) Estimating spectral separability of satellite derived parameters for burned areas mapping in the Calabria region by using SPOT-vegetation data. Ecological Modelling 196, 265–270.
| Estimating spectral separability of satellite derived parameters for burned areas mapping in the Calabria region by using SPOT-vegetation data.Crossref | GoogleScholarGoogle Scholar |
Li J, Song Y, Mao Y, Mao Z, Wu Y, Li M, Huang X, He Q, Hu M (2014) Chemical characteristics and source apportionment of PM2.5 during the harvest season in eastern China’s agricultural regions. Atmospheric Environment 92, 442–448.
| Chemical characteristics and source apportionment of PM2.5 during the harvest season in eastern China’s agricultural regions.Crossref | GoogleScholarGoogle Scholar | 1:CAS:528:DC%2BC2cXpvFWqsbk%3D&md5=66668858c99ba24ce18c482655a0d93aCAS |
Lienhart R, Maydt J (2002) An extended set of Haar-like features for rapid object detection. In ‘Proceedings of the international conference on image processing (ICIP)’, 22–25 September 2002, Rochester, NY, USA. Vol 1. pp. 900–903. (IEEE: USA)
Loboda T, O’Neal KJ, Csiszar I (2007) Regionally adaptable dNBR-based algorithm for burned area mapping from MODIS data. Remote Sensing of Environment 109, 429–442.
| Regionally adaptable dNBR-based algorithm for burned area mapping from MODIS data.Crossref | GoogleScholarGoogle Scholar |
Long X, Tie X, Cao J, Huang R, Feng T, Li N, Zhao S, Tian J, Li G, Zhang Q (2016) Impact of crop field burning and mountains on heavy haze in the North China Plain: a case study. Atmospheric Chemistry and Physics 16, 9675–9691.
| Impact of crop field burning and mountains on heavy haze in the North China Plain: a case study.Crossref | GoogleScholarGoogle Scholar | 1:CAS:528:DC%2BC28XhslWrtbnJ&md5=afc9ec4051ccb702eaccd51cdc160616CAS |
Maingi JK, Henry MC (2007) Factors influencing wildfire occurrence and distribution in eastern Kentucky, USA. International Journal of Wildland Fire 16, 23–33.
| Factors influencing wildfire occurrence and distribution in eastern Kentucky, USA.Crossref | GoogleScholarGoogle Scholar |
McCarty JL, Korontzi S, Justice CO, Loboda T (2009) The spatial and temporal distribution of crop residue burning in the contiguous United States. The Science of the Total Environment 407, 5701–5712.
| The spatial and temporal distribution of crop residue burning in the contiguous United States.Crossref | GoogleScholarGoogle Scholar | 1:CAS:528:DC%2BD1MXhtFGjsbbJ&md5=c369d9e697d7a7047edf369d17a6652bCAS |
Mitri GH, Gitas IZ (2004) A semi-automated object-oriented model for burned area mapping in the Mediterranean region using Landsat-TM imagery. International Journal of Wildland Fire 13, 367–376.
| A semi-automated object-oriented model for burned area mapping in the Mediterranean region using Landsat-TM imagery.Crossref | GoogleScholarGoogle Scholar |
Palandjian D, Gitas IZ, Wright R (2009) Burned area mapping and post-fire impact assessment in the Kassandra Peninsula (Greece) using Landsat TM and Quickbird data. Geocarto International 24, 193–205.
| Burned area mapping and post-fire impact assessment in the Kassandra Peninsula (Greece) using Landsat TM and Quickbird data.Crossref | GoogleScholarGoogle Scholar |
Parker BM, Lewis T, Srivastava SK (2015) Estimation and evaluation of multidecadal fire severity patterns using Landsat sensors. Remote Sensing of Environment 170, 340–349.
| Estimation and evaluation of multidecadal fire severity patterns using Landsat sensors.Crossref | GoogleScholarGoogle Scholar |
Pinty B, Verstraete M (1992) GEMI: a non-linear index to monitor global vegetation from satellites. Plant Ecology 101, 15–20.
| GEMI: a non-linear index to monitor global vegetation from satellites.Crossref | GoogleScholarGoogle Scholar |
Qi J, Chehbouni A, Huete A, Kerr Y, Sorooshian S (1994) A modified soil adjusted vegetation index. Remote Sensing of Environment 48, 119–126.
| A modified soil adjusted vegetation index.Crossref | GoogleScholarGoogle Scholar |
Shi T, Liu Y, Zhang L, Hao L, Gao Z (2014) Burning in agricultural landscapes: an emerging natural and human issue in China. Landscape Ecology 29, 1785–1798.
| Burning in agricultural landscapes: an emerging natural and human issue in China.Crossref | GoogleScholarGoogle Scholar |
Smith AMS, Drake NA, Wooster MJ, Hudak AT, Holden ZA, Gibbons CJ (2007) Production of Landsat ETM plus reference imagery of burned areas within southern African savannahs: comparison of methods and application to MODIS. International Journal of Remote Sensing 28, 2753–2775.
| Production of Landsat ETM plus reference imagery of burned areas within southern African savannahs: comparison of methods and application to MODIS.Crossref | GoogleScholarGoogle Scholar |
Conghe Song CH, Woodcock CE (2003) Monitoring forest succession with multitemporal Landsat images: factors of uncertainty. IEEE Transactions on Geoscience and Remote Sensing 41, 2557–2567.
| Monitoring forest succession with multitemporal Landsat images: factors of uncertainty.Crossref | GoogleScholarGoogle Scholar |
Stroppiana D, Boschetti M, Zaffaroni P, Brivio PA (2009) Analysis and interpretation of spectral indices for soft multicriteria burned-area mapping in Mediterranean regions. IEEE Geoscience and Remote Sensing Letters 6, 499–503.
| Analysis and interpretation of spectral indices for soft multicriteria burned-area mapping in Mediterranean regions.Crossref | GoogleScholarGoogle Scholar |
Trigg S, Flasse S (2001) An evaluation of different bispectral spaces for discriminating burned shrub-savannah. International Journal of Remote Sensing 22, 2641–2647.
| An evaluation of different bispectral spaces for discriminating burned shrub-savannah.Crossref | GoogleScholarGoogle Scholar |
Tyre AJ, Tenhumberg B, Field SA, Niejalke D, Parris K, Possingham HP (2003) Improving precision and reducing bias in biological surveys: estimating false‐negative error rates. Ecological Applications 13, 1790–1801.
| Improving precision and reducing bias in biological surveys: estimating false‐negative error rates.Crossref | GoogleScholarGoogle Scholar |
Vadrevu K, Lasko K (2015) Fire regimes and potential bioenergy loss from agricultural lands in the Indo-Gangetic Plains. Journal of Environmental Management 148, 10–20.
| Fire regimes and potential bioenergy loss from agricultural lands in the Indo-Gangetic Plains.Crossref | GoogleScholarGoogle Scholar |
Veraverbeke S, Verstraeten WW, Lhermitte S, Goossens R (2010a) Evaluating Landsat Thematic Mapper spectral indices for estimating burn severity of the 2007 Peloponnese wildfires in Greece. International Journal of Wildland Fire 19, 558–569.
| Evaluating Landsat Thematic Mapper spectral indices for estimating burn severity of the 2007 Peloponnese wildfires in Greece.Crossref | GoogleScholarGoogle Scholar |
Veraverbeke S, Verstraeten WW, Lhermitte S, Goossens R (2010b) Illumination effects on the differenced Normalized Burn Ratio’s optimality for assessing fire severity. International Journal of Applied Earth Observation and Geoinformation 12, 60–70.
| Illumination effects on the differenced Normalized Burn Ratio’s optimality for assessing fire severity.Crossref | GoogleScholarGoogle Scholar |
Veraverbeke S, Harris S, Hook S (2011a) Evaluating spectral indices for burned area discrimination using MODIS/ASTER (MASTER) airborne simulator data. Remote Sensing of Environment 115, 2702–2709.
| Evaluating spectral indices for burned area discrimination using MODIS/ASTER (MASTER) airborne simulator data.Crossref | GoogleScholarGoogle Scholar |
Veraverbeke S, Lhermitte S, Verstraeten WW, Goossens R (2011b) A time-integrated MODIS burn severity assessment using the multitemporal Differenced Normalized Burn Ratio (dNBR(MT)). International Journal of Applied Earth Observation and Geoinformation 13, 52–58.
| A time-integrated MODIS burn severity assessment using the multitemporal Differenced Normalized Burn Ratio (dNBR(MT)).Crossref | GoogleScholarGoogle Scholar |
Verbyla DL, Kasischke ES, Hoy EE (2008) Seasonal and topographic effects on estimating fire severity from Landsat TM/ETM+ data. International Journal of Wildland Fire 17, 527–534.
| Seasonal and topographic effects on estimating fire severity from Landsat TM/ETM+ data.Crossref | GoogleScholarGoogle Scholar |
Wang S, Baig MHA, Zhang L, Jiang H, Ji Y, Zhao H, Tian J (2015) A simple Enhanced Water Index (EWI) for percent surface water estimation using Landsat data. IEEE Journal of Selected Topics in Applied Earth Observations and Remote Sensing 8, 90–97.
| A simple Enhanced Water Index (EWI) for percent surface water estimation using Landsat data.Crossref | GoogleScholarGoogle Scholar | 1:CAS:528:DC%2BC2MXns1Sku7k%3D&md5=d2ac81ac863850f81b11db52c8d9d61fCAS |
Yang S, He H, Lu S, Chen D, Zhu J (2008) Quantification of crop residue burning in the field and its influence on ambient air quality in Suqian, China. Atmospheric Environment 42, 1961–1969.
| Quantification of crop residue burning in the field and its influence on ambient air quality in Suqian, China.Crossref | GoogleScholarGoogle Scholar | 1:CAS:528:DC%2BD1cXitlWis7c%3D&md5=324b5a8c9db8903b64ae29a190a2a954CAS |