Reversible and Vapochromic Chemisorption of Ammonia by a Copper(ii) Coordination Polymer
Christina Wegeberg A , David Nielsen
  B , Susanne Mossin
  B , Brendan F. Abrahams
  C , Vickie McKee
  A and Christine J. McKenzie
  A D
A D
A Department of Physics, Chemistry and Pharmacy, University of Southern Denmark, Campusvej 55, 5230 Odense M, Denmark.
B Centre for Catalysis and Sustainable Chemistry, Department of Chemistry, Technical University of Denmark, 2800 Kgs. Lyngby, Denmark.
C School of Chemistry, University of Melbourne, Parkville, Vic. 3010, Australia.
D Corresponding author. Email: mckenzie@sdu.dk
Australian Journal of Chemistry 72(10) 817-826 https://doi.org/10.1071/CH19264
Submitted: 10 June 2019 Accepted: 10 July 2019 Published: 27 August 2019
Abstract
The single crystal X-ray structure determination of {[Cu(tpt)(o-phthalate)]·31/3(C2H2Cl4)}n (tpt = 2,4,6-tri-4-pyridyl-1,3,5-triazine, C2H2Cl4 = 1,1,2,2-tetrachloroethane = TCE) shows a 3D network in which CuII centres are linked by 3-connecting tpt ligands with the topology of a 12,3 net. CuII centres are further linked by o-phthalate dianions. The copper coordination geometry is square pyramidal, with o-phthalate oxygen donors trans to each other in the basal plane and the remaining positions taken by the pyridines of three linking tpt units. The solvent accessible void space is ~65 %. The pale blue-green crystalline desolvate, obtained by heating to 200°C or washing the TCE solvate with acetone is formulated as [Cu(tpt)(o-phthalate)]n. Powder X-ray diffraction and electron paramagnetic resonance spectroscopy show that the crystal structure and the CuII geometry changes upon desolvation. The crystalline desolvated phase sorbs two equivalents of ammonia per copper ion. The adduct, mauve [Cu(tpt)(o-phthalate)(NH3)2]n, shows reasonable crystallinity and is stable up to ~150°C under ambient conditions before the reversible desorption (minimum 10 cycles) of the guest ammonia. The colour change and high desorption temperature, along with changes in g values, is suggestive of chemisorption in two steps with Cu–ammine bonding in the loaded phase.
Introduction
Coordination polymers (CPs) with high porosity[1] are a promising class of material for the storage,[2,3] sensing,[4,5] and separation[6,7] of gases. Ammonia is targeted in this context since it is widely used in industry for the production of plastics, fertilizers, refrigerants, explosives, nitric acid, and intermediates for dyes and pharmaceuticals.[8] It is a colourless gas which is corrosive, toxic, and chemically active. The detection of ammonia is important for human health, industry, agriculture, and the environment. However, achieving selective and reversible sorption of ammonia is a challenge due to its basicity. For example, Peterson et al. have demonstrated, using solid state MAS NMR studies, that the uptake of ammonia by the CP Cu3(BTC)2 (BTC = 1,3,5-benzenetricarboxylate) (HKUST-1) is due to irreversible structural decomposition to Cu(OH)2 and (NH4)3BTC.[9] In order to make the removal of ammonia efficient and useful for commercial application, CPs should show both thermal and chemical stability and be able to detect low levels of ammonia vapour.[10] Towards this goal Dincă and co-workers recently demonstrated that Cu3(HITP)2 (HITP = 2,3,6,7,10,11-hexaaminotriphenylene) can reversibly detect ammonia at concentrations as low as 0.5 ppm under dry inert N2 atmosphere.[11] We have constructed a new copper containing CP based on 2,4,6-tri-4-pyridyl-1,3,5-triazine (tpt) and o-phthalate that can reversibly bind ammonia. The new material is stable to moisture and retains two equivalents of ammonia per copper ion up to 150°C under ambient atmosphere. We propose that these ammonia molecules are coordinated to the copper centre and this occurs in a stepwise fashion.
Experimental
Materials
1,1,2,2-Tetrachloroethane and K(Hphthalate) were purchased from Fluka. All other chemicals were purchased from Sigma Aldrich. Aqueous ammonia (28–30 %) was used.
Instrumentation
IR spectra were recorded on a PerkinElmer Spectrum 65 (FT-ATR diamond anvil) on the neat samples. Thermal analysis was carried out on a Perkin Elmer TGA 4000 from 30–200°C at 10°C min−1 in a nitrogen atmosphere with a purge rate of 20 mL min−1. Powder X-ray diffraction (PXRD) measurements were performed on a Rigaku Miniflex 600 X-ray diffractometer with Cu(Kα) (λ = 1.5409 Å, 40 kV, 15 mA) within the 2θ range 5°–90°. Electron paramagnetic resonance (EPR) spectra were recorded using powdered samples on a Bruker EMX X-band spectrometer using the previously described setup.[12] The signal was quantified by double integration of background-corrected spectra and compared with spectra obtained on four reference samples of solid solutions of CuSO4 5H2O in K2SO4. 1H (400.12 MHz) and 13C NMR (100.61 MHz) spectra were recorded on a Bruker Avance III 400 spectrometer, and the chemical shifts are denoted relative to the residual solvent peak (CDCl3: δH 7.26 ppm; δC 77.16 ppm). Electrospray ionisation (ESI) mass spectra were recorded in high-resolution positive ion mode on a Bruker micrOTOF-Q II mass spectrometer.
Synthesis
2,4,6-Tri-4-pyridyl-1,3,5-triazine (tpt)
Apart from the purification step, the synthesis was the same as that reported by Anderson et al.[13] KOH (126 mg, 2.25 mmol), 18-crown-6 (505 mg, 1.91 mmol), and 4-cyanopyridine (5.13 g, 49.3 mmol) were dissolved in decaline (10 mL) and stirred under N2 flow for 3 h at 200°C. During this time the solution changed colour from orange to red to black. A brown solid precipitated on cooling the mixture to room temperature. This was isolated by filtration and subsequently suspended in warm water. The solids were then re-filtered and washed with acetone (1 × 5 mL) to give a fine grey powder.
Yield: 901 mg (18 %). δH (400.12 MHz, CDCl3) 8.94 (dd, J 4.8, 1.6, 6H), 8.56 (dd, J 4.4, 1.6, 6H). δC (100.61, CDCl3) 171.61, 151.19, 142.55, 122.43. m/z (ESI, MeCN, +ve) 313.1119 (100 %), 335.1205 (17); calcd for C18H13N6 [tptH]+ 313.1196, C18H12N6Na [tptNa]+ 335.1021.
{[Cu(tpt)(o-phthalate)]·31/3(C2H2Cl4)}n
Tpt (124.6 mg, 0.40 mmol) was dissolved in 1,1,2,2-tetrachloroethane (TCE, 40 ml) to give a colourless, clear solution after rapid stirring for a few hours. A solution of Cu(NO3)2·3H2O (94.9 mg, 0.39 mmol) and K(Hphthalate) (82.0 mg, 0.40 mmol) in MeOH (25 mL) was added, and the reaction mixture was stirred for 1 h to obtain [Cu(tpt)(o-phthalate)]·31/3(C2H2Cl4) as a blue powder. This was isolated by vacuum filtration without washing. Yield: 413 mg (94 %). νmax (KBr)/cm−1 3428 (m), 1617 (m), 1576 (m), 1519 (s), 1376 (s), 1315 (m), 1215 (w), 1160 (w), 1061 (m), 870 (w), 826 (w), 803 (m), 753 (w), 737 (w), 669 (w), 643 (m), 518 (w). PXRD shows a high degree of crystallinity.
Single crystals of {[Cu(tpt)(o-phthalate)]·31/3(C2H2Cl4)}n could be grown by layering the TCE solution of tpt and the methanol solution of Cu(NO3)2 and K(Hphthalate) in a sealed vial. Turquoise crystals formed at the interface of the two layers. These grew larger over several days. The single crystals used for SCXRD were mounted cryogenically, onto a glass fibre using oil for adherence, directly from the mother liquid by using a stage mounted inside a dewar containing liquid N2. Removal of the crystals from the solution phase to air under ambient conditions results in their visible macroscopic collapse to a powder within seconds.
[Cu(tpt)(o-phthalate)]n
The powder form of {[Cu(tpt)(o-phthalate)]·31/3(C2H2Cl4)}n was suspended in acetone and then re-filtered to give a pale blue-green powder of [Cu(tpt)(o-phthalate)]n. TGA does not show any mass loss up to 160°C indicating that the TCE has been removed and not replaced by acetone. Yield: 97–100 %.
Gas–Solid Reactions
[Cu(tpt)(o-phthalate)]n was exposed to the vapour evolved from aqueous ammonia in a sealed container. The solids change colour within minutes.
Crystallography
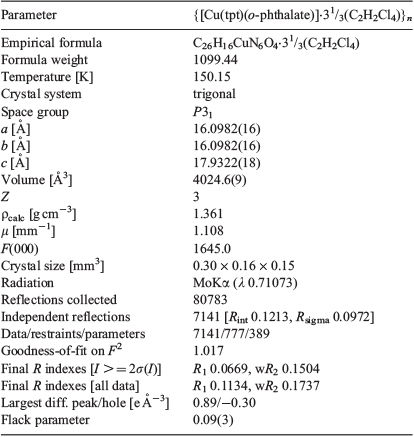
The data were collected at 150(2) K on a Bruker-Nonius Apex II CCD diffractometer using MoKα radiation (λ 0.71073 Å) and were corrected for Lorentz-polarisation effects and absorption (SADABS[14]). The structure was solved by dual space methods (SHELXT[15]) and refined on F2 using all the reflections (SHELXL-2018[16]). All the non-hydrogen atoms of the framework were refined using anisotropic atomic displacement parameters and hydrogen atoms were inserted at calculated positions using a riding model. The aromatic ring of the phthalate group is disordered and was modelled with equal occupancy of two orientations. The large void space in the crystal contains diffuse electron density and this was treated using SQUEEZE;[17] a single large void of 2600 Å3 (64.6 %) in the unit cell was estimated to contain 829 electrons corresponding to 10 molecules of C2H2Cl4 per cell (820 electrons). Since the high angle data were very weak, the refinement was truncated at a resolution 0.90 Å. Crystal data, data collection, and structure refinement details are summarised in Table 1.
|
Results and Discussion
The Structure of {[Cu(tpt)(o-phthalate)]·31/3(C2H2Cl4)}n
Single crystals of the turquoise CP {[Cu(tpt)(o-phthalate)]·31/3(C2H2Cl4)}n were grown at the interface of the layers of TCE and MeOH over the course of a few days. The crystals were mounted on a glass fibre under cryogenic conditions as quickly as possible after removal from the mother liquor. The same material as a finely divided powder, can be prepared by mixing all reagents and stirring for 1 h in 1 : 1 TCE/MeOH. Both approaches give close to stoichiometric yields (>94 %). The PXRD patterns for bulk macroscopically powdered samples of {[Cu(tpt)(o-phthalate)]·31/3(C2H2Cl4)3}n show that the material is a highly ordered crystalline structure with defined and sharp reflections at lower angles (Fig. S5, Supplementary Material).
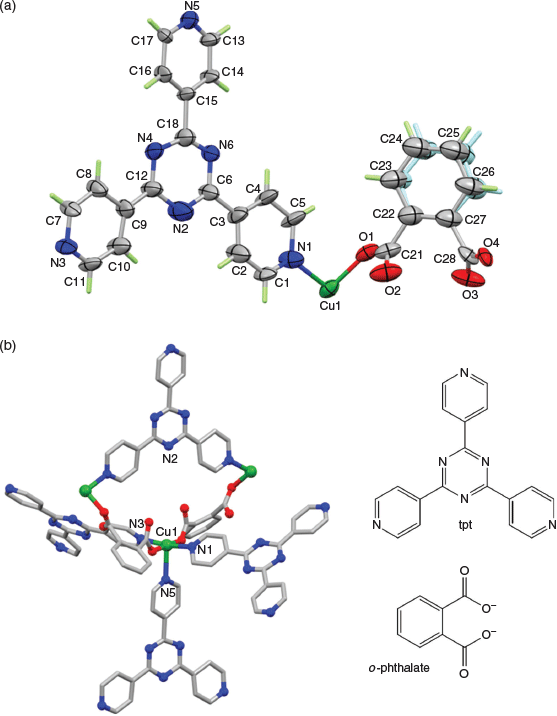
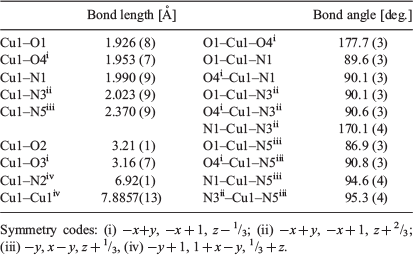
The structure of {[Cu(tpt)(o-phthalate)]·31/3(C2H2Cl4)}n was solved in the chiral (Sohncke) space group P31. The asymmetric unit comprises one copper ion, one tpt molecule, and one (disordered) o-phthalate dianion (Fig. 1), as well as some poorly defined solvate molecules. The copper ions are pentacoordinated and bonded to one pyridine from each of three tpt ligands, N1, N3 (under −x + y, −x + 1, z + 2/3), and N5 (under −y, x − y, z + 1/3), as well as two carboxylate oxygen atoms from different o-phthalate units O1 and O4 (under −x + y, −x + 1, z − 1/3). The bond distances and approximate square pyramidal geometry at the copper ion are unremarkable (Table 2). The two oxygen donors are located trans to each other in the basal plane and N5 is the apical donor (Fig. 1).
|
|
From a topological perspective the tpt ligand may be considered as a 3-connecting node with links to three CuII centres. The CuII centre, on the other hand, is a 5-connecting node forming links to three tpt ligands and two crystallographically equivalent CuII ligands through bridging o-phthalate ligands. The resulting 3D network, composed of both 3- and 5-connecting nodes, is particularly complex and the topological description, based on consideration of these two nodes (point symbol: (4.72)(43.62.74.8))[18] fails to easily convey the connectivity of the network. The 3D network may be more simply understood by ignoring, in the first instance, the bridging o-phthalate dianions and considering only the Cu–tpt network. Under these circumstances both the Cu centres and tpt ligands serve as 3-connecting nodes within a chiral network that belongs to the class of networks with an unusual ‘12,3’ topology.
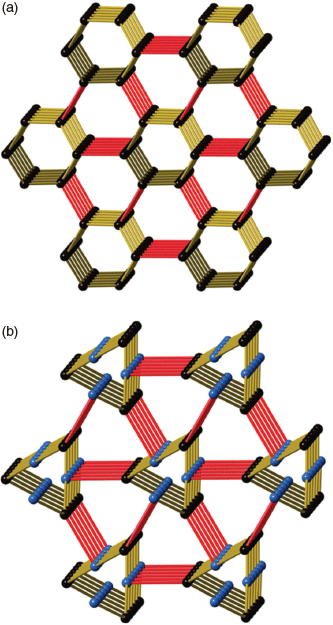
Throughout his career the structural chemist A. F. Wells categorised hundreds of inorganic compounds and was largely responsible for using mathematical nets to describe the connectivity of crystalline solids.[19,20] His approach involved identifying the connectivity of a node and then determining the shortest circuit in the structure involving the node. While Wells was able to assign topological labels to inorganic structures he also, with remarkable insight, described some mathematical nets such as a 12,3 net that did not have a recognised chemical counterpart at the time. The 12,3 net described by Wells is now represented by the 3-letter code twt.[21] A representation of the 12,3 net is presented in Fig. 2a which shows parallel 6-fold double helices which are linked by connections normal to the direction of the helical axes. In this representation all nodes are identical but because the network cannot form with perfect trigonal nodes, not all angles at the planar 3-connecting nodes are the same. The presence of parallel double helices results in the network being chiral. Within the family of uniform (n,3) nets considered by Wells, his 12,3 net occupies a position of special significance because of the phenomenon of self-entanglement as discussed later.
|
In the late 1980s and 1990s Robson employed a net-based approach to design and describe coordination polymers and found Wells’ approach to representing connectivity to be particularly useful.[22,23] Workers such as O’Keeffe have also made important contributions to the use of topological symbols to represent connectivity in chemical networks.[21,24] In regard to the 12,3 net described by Wells, Robson noted that the network can form in a strain-free manner if T-shaped and true trigonal nodes are combined in a 1 : 1 ratio as indicated in Fig. 2b. In this case, with two distinct nodes, 3-fold double helices are formed instead of the 6-fold double helices.
In the structure of the Ni(tpt)(NO3)2·solvate, described by Robson et al. in 1999,[25] tpt ligands serve as trigonal 3-connecting centres while the NiII centres with mer configuration of pyridyl groups act as T-connecting centres. The remaining coordination sites of the 6-coordinate NiII centre are occupied by disordered, non-bridging nitrate ions. Fig. 2b thus provides a simplified schematic representation of the structure in which only the two types of 3-connecting centres are represented. To the best of our knowledge the {[Ni(tpt)(NO3)2]·solvate}n was the first reported example of a chemical structure that has the 12,3 connectivity described by Wells. In 2013 Bu et al. reported a series of compounds which possessed the same Ni-tpt framework but with o-phthalate ligands in place of nitrate anions in {[Ni(tpt)(NO3)2]solvate}n.[26] The o-phthalate ligands are bridging and provide additional links between the NiII centres of the Ni–tpt network.
The CuII network presented in this current work closely resembles Bu’s compound, [Ni(tpt)(L)(H2O)]·solvate (L = o-phthalate and substituted o-phthalate ligands) but with a square pyramidal CuII centre in place of the octahderal NiII centre whose sixth site is occupied by a water molecule. The adoption of the space group P31 by the [Cu(tpt)(o-phthalate)]·solvate is in contrast to the higher symmetry space group, P3121 (and its enantiomorphic partner, P3221) found for {[Ni(tpt)(NO3)2]solvate}n and {[Ni(tpt)(L)]solvate}n. Attempts to refine {[Cu(tpt)(o-phthalate)]·31/3(C2H2Cl4)}n in P3121 did not improve the structure model for the o-phthalate groups. Despite the differences in space group symmetry, the structural similarity of the three compounds, {[Ni(tpt)(NO3)2]solvate}n, {[Ni(tpt)(o-phthalate)(H2O)]solvate}n, and {[Cu(tpt)(o-phthalate)]solvate}n is clearly apparent with the metal–tpt 12,3 network common to all structures. The network topology of the Cu–tpt network was confirmed using the program SYSTRE.[18]
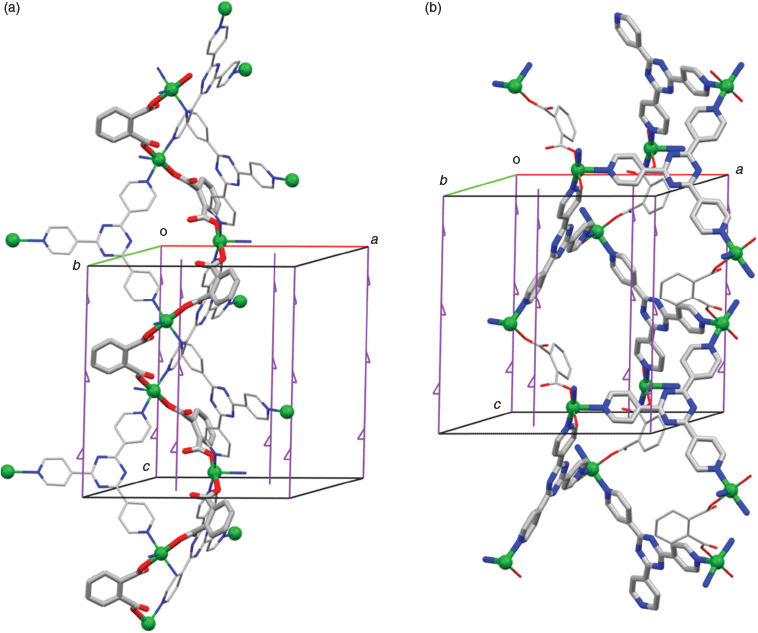
In the structure of {[Cu(tpt)(o-phthalate)]·31/3(C2H2Cl4)}n the axes of Cu–tpt double helices are coincident with 3-fold screw axes as indicated in Fig. 3a which shows that the helices are left-handed. If the bridging o-phthalate ligands are considered, the Cu centres of the two Cu–tpt helical strands are linked (Fig. 3a). The resulting Cu–o-phthalate chain is a single helix with half the pitch of the Cu–tpt helix. The single Cu–o-phthalate helix has the opposite handedness to the Cu–tpt double helix, i.e. right instead of left. A second type of crystallographic screw axis runs along relatively large channels in the crystal. The screw axes and the surrounding framework atoms are depicted in Fig. 3b. Around this axis it is possible to identify Cu–tpt helices that are right-handed.
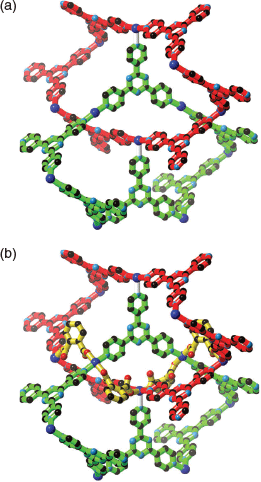
A characteristic of the 12,3 net is ‘self-entanglement’ (or self-catenation) which relates to the fact that a connection of one 12-membered circuit passes through another 12-membered circuit within the same network. Certainly it is possible to identify examples of self-catenation in other single 3D networks, but a special feature of the 12,3 net is that the 12-membered circuit is the shortest circuit in the structure. Robson suggested that the self-catenation found in the 12,3 net is a consequence of the large number of nodes in a single circuit (12) resulting in the structure ‘folding back on itself’. As with Robson’s original network, catenation of M6tpt6 rings is apparent, as is indicated in Fig. 4a. The bridging o-phthalate ligands serve as a brace between the catenated rings as is shown in Fig. 4b.
|
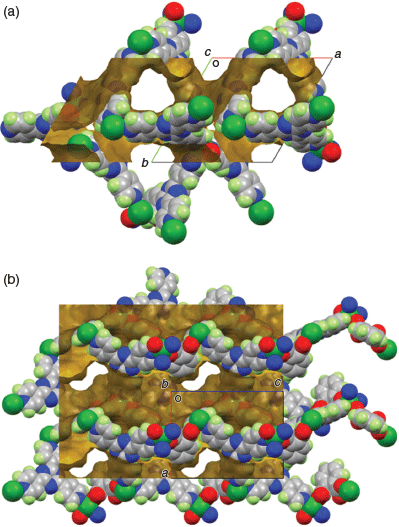
The relatively large channels parallel to the c axis (Fig. 5a) are filled with disordered TCE molecules. These larger channels are connected by narrower channels parallel to the a and b axes (Fig. 5b). SQUEEZE (probe radius 1.2 Å) gave the solvent accessible volume in the crystal as 2600 Å per cell, in other words 64.6 % of the unit cell volume, and recovered 829 electrons. If all the disordered solvent is TCE, then this would correspond to 10 molecules of C2H2Cl4 solvent per unit cell, or 31/3 molecules per formula unit (equivalent to 50.9 % of the mass) and giving an overall empirical formula of [Cu(tpt)(o-phthalate)]·31/3(C2H2Cl4). The vacant axial coordination site is not directed into the main cavity.
|
TGA measurements (Fig. S1, Supplementary Material) on the bulk samples of {[Cu(tpt)(o-phthalate)]·31/3(C2H2Cl4)}n show a gradual mass loss of ~45 % as the temperature increases from 100 to 160°C. Consistently, the boiling point of TCE is 147°C. A mass loss of 45 % accords with approximately three molecules of TCE per formula unit in good agreement with the crystallographic data. The desolvated material is formulated as [Cu(tpt)(o-phthalate)]n. Washing {[Cu(tpt)(o-phthalate)]·31/3(C2H2Cl4)}n with acetone also removes the TCE to give [Cu(tpt)(o-phthalate)]n. With either method, a colour change from turquoise to pale blue-green occurs (Fig. 6a).

|
Quantification of the CuII content was achieved using EPR spectroscopy (Fig. S2, Supplementary Material) concurring that {[Cu(tpt)(o-phthalate)]·31/3(C2H2Cl4)}n contains 6.3 % (+/− 0.6) copper(ii). This furnishes more support for approximately three C2H2Cl4 molecules per Cu site (theoretical 5.8 %). X-band EPR spectroscopy of powdered and crushed bulk samples of {[Cu(tpt)(o-phthalate)]·31/3(C2H2Cl4)}n and ground samples of single crystals of {[Cu(tpt)(o-phthalate)]·31/3(C2H2Cl4)}n exhibit similar EPR signals (Fig. S3, Supplementary Material) with unresolved g-anisotropy and hyperfine structure due to the interaction of the unpaired electron on copper with the nuclear spin of 63Cu and 65Cu (I = 3/2 for both isotopes). The partially unresolved features change somewhat depending on the content of TCE, the value of gav = 2.14–2.13 is, however, almost constant.
Reversible Gas–Solid Reaction with Ammonia
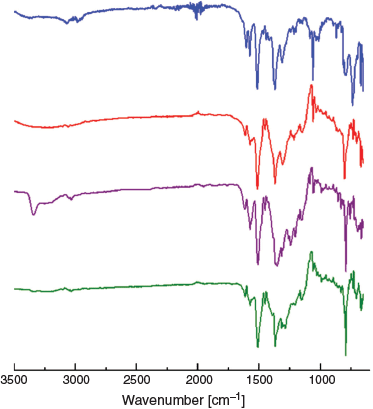
When [Cu(tpt)(o-phthalate)]n (prepared by washing TCE out with acetone) is exposed to the ammonia vapour evolved from aqueous ammonia, it changes colour from pale blue-green to mauve within seconds (Fig. 6b, c). Comparison of the IR spectra of [Cu(tpt)(o-phthalate)]n before and after exposure to ammonia reveals an N–H stretching band at 3343 cm−1 (Fig. 7, red and purple) confirming the capture of ammonia. It is noteworthy that the uptake occurs under humid conditions and the material is stable at room temperature. The possibility that the guest is wholly or partially water can be rejected due to the absence of O–H bands. In addition, no colour change is observed in the absence of ammonia. As discussed in detail later, the uptake of ammonia is associated with a change of the EPR signal. The ammonia can be removed by heating to 200°C to recover a green solid (Fig. 6d). The N–H stretch in the IR spectrum concurrently disappears (Fig. 7, green). The IR spectra of the solid before [Cu(tpt)(o-phthalate)]n is exposed to vapour from NH3(aq) and after the removal of NH3(aq) are identical (Fig. 7, red and green).
|
TGA measurements verify a mass loss from the mauve material of 6.3 % when it is heated to 200°C (Fig. 8). This corresponds to two molecules of ammonia per Cu centre. Thus the ammonia adduct is formulated as [Cu(tpt)(o-phthalate)(NH3)2]n. The de- and re-sorption of two ammonia molecules per Cu is reversible over 10 cycles (Fig. 8), without diminishing performance. There is no reason to expect that the sample would not be able to reversibly bind ammonia over many more cycles. After each removal, NH3 reloading for 15 min was performed outside of the TGA instrument. Increasing the loading time to 14 h did not increase the amount of ammonia taken up by the material. Mass loss begins around 150°C suggesting that the ammonia interacts very strongly with the structure. This implies a chemisorptive mechanism (covalent bond formation with the host lattice) or very strong H-bonding.
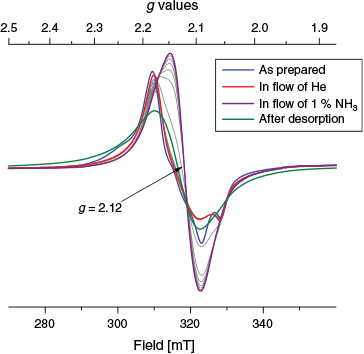
EPR spectroscopy was used to follow the absorption and desorption of ammonia in two different experimental setups. First a powdered and fractioned sample (> 150 μm) of {[Cu(tpt)(o-phthalate)]·31/3(C2H2Cl4)}n was exposed to a flow of dry He at room temperature in situ and subsequently exposed to a flow of dry 1 % NH3 in He while monitoring with EPR spectroscopy (Fig. 9). The initial signal displays a dominant contribution from CuII with an average g value of 2.14. During the flow of dry He the low field feature at 3000 Gauss is lost. After exposure to NH3 the signal shifts to higher fields corresponding to a g value of 2.12. The lower value suggests strongly that the CuII is located in a 4N tetragonal plane perpendicular to the elongation axis. The fine structure of the signal is lost giving an almost completely isotropic EPR signal. In order to expel the NH3 sorbed in situ the sample was then heated to 100°C under a flow of He and cooled back to room temperature before obtaining a final spectrum. After this process the EPR signal is still featureless and isotropic, but a little broader. The g value returns to 2.14. The colours of the samples during this in situ treatment concur with those observed during exposure to vapour from aqueous ammonia (Fig. 6). The intensity of the EPR signal was determined as the double integral of the background corrected spectra and showed deviations (+/− 10 %) for the spectra shown.
|
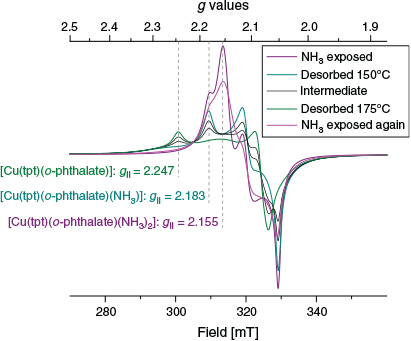
Second, an ex situ experiment was devised to follow more closely the procedures used for the IR and TGA investigation. Desolvated {[Cu(tpt)(o-phthalate)]}n (3.5 mg) was placed in a 4 mm EPR tube and the spectrum measured (green trace in Fig. S3, Supplementary Material). The tube was then placed in a closed container with 14 M NH3 and left to sorb the vapours for an hour. The atmosphere in the narrow tube was stirred with a pipette a few times. NH3 sorption was indicated by the colour change to mauve. The EPR spectrum was recorded and the tube was then heated to 150°C and further to 175°C with a few spectra obtained along the way. Finally, the sample in the tube was allowed to sorb NH3 from the vapours above 14 M NH3 once more. The series of EPR spectra are shown in Fig. 10. The difference compared with the spectra that were produced by a flow of 1 % NH3 in He (Fig. 9) are striking. Now clearly resolved individual EPR signals are seen for three different species. The spectrum of desolvated [Cu(tpt)(o-phthalate)]n is clearly defined and shows an axial spectrum with resolved g values at 2.075, 2.075, and 2.245 (green trace in Fig. 10). The average g value is 2.132. The completely NH3 saturated sample, [Cu(tpt)(o-phthalate)(NH3)2]n gives a rhombic spectrum with g values at 2.053, 2.107, and 2.155, with an average value of 2.105 (dominant in the purple trace). Spectacularly, a third species is revealed on the way between these extremes with g values of 2.05, 2.10, and 2.183 (average value 2.111). We suggest that this is intermediate [[Cu(tpt)(o-phthalate)(NH3)]n (dominant in the teal trace). Several isosbestic points are present. The final spectrum (red-violet in Fig. 10) shows the return to [Cu(tpt)(o-phthalate)(NH3)2]n. The intensity of the EPR spectra increased 13 % on the first absorption of ammonia and is constant within 4 % with subsequent treatments (Fig. S4, Supplementary Material). The absorption of ammonia does not quite reach 100 % (2 NH3 per Cu) in this particular experiment using a narrow tube, since a minor contribution (less than 30 %) of [Cu(tpt)(o-phthalate)(NH3)]n can be recognised in both the spectra obtained.
|
Notably, no splitting due to hyperfine coupling to the copper nuclei as normally seen for CuII compounds is evident in the EPR spectra of any of the three species. This suggests magnetic exchange between copper centres (Cu⋯Cu 7.8857(13) Å) contained within a well defined crystal lattice. This has completely collapsed the normally observed splitting due to hyperfine coupling, but not the g-anisotropy. The line shape is predominantly Lorentzian. Exchange narrowing is described by Anderson[29] and has been observed to different extents for many copper systems, e.g. in a copper-amino complex by Calvo et al.[30] The elucidation of the magnetic coupling pattern in this system would be very interesting, but this has not yet been attempted.
The numerically highest g value (g|| for axial systems) changes significantly during NH3 sorption, decreasing by 0.06 with the first NH3 entering the structure and additionally by 0.03 with the second (Fig. 10). The trend in the average g values is the same as was observed during the in situ measurements (Fig. S3, Supplementary Material). The trend and the values are in complete accord with strong nitrogen donors taking the place of oxygen in the plane perpendicular to the elongation axis around a typical tetragonal CuII centre.
In conclusion, the impressive EPR spectra shown in Fig. 10 are the result of exchange coupling between crystallographically equivalent but magnetically distinct Cu centres in combination with high crystallinity. The three Cu centres of the unit cell are locked in magnetic exchange that results in a particular and unusual coupling pattern. Small perturbations away from the strict symmetry destroy the anisotropic features of the EPR spectrum resulting in spectra showing complete collapse of the fine structure. The fresh samples with some absorbed water, and the in situ sample (which had first been powdered and then exposed to gas flows, Fig. 9) show too many deviations in the magnetic coupling pattern resulting in a more randomised collapse of the fine structure. By contrast, the crystalline, carefully absorbed, and gently desorbed sample retains the g-anisotropy and loses the hyperfine structure completely. Some percentage of the EPR signal intensity of the green spectrum in Fig. 10 (the small bump in the middle) has a completely collapsed structure, and the features of the pink trace are less sharp compared with the purple trace, so detectable amounts of additional defects have appeared in the sample after one desorption procedure. The PXRD patterns for [Cu(tpt)(o-phthalate)]n and [Cu(tpt)(o-phthalate)(NH3)2]n (Fig. S5, Supplementary Material) show significant crystallinity, however, with some broadening suggesting that some of the long range order structure is lost during the desorption of TCE and the absorption of ammonia as was implied by the EPR spectroscopy on identically treated samples. The diffraction patterns show changes consistent with crystal phase transitions during each of the desorption and sorption processes.
The colour changes, apparent stoichiometry of two NH3 per Cu site, crystal phase changes, and appropriate shifts of the g values to indicate 4N equatorial coordination for the NH3 loaded phase, all point strongly to a highly selective chemisorption process for NH3 into [Cu(tpt)(o-phthalate)]n. We suggest that precisely two guest NH3 molecules can coordinate to the CuII sites and that this is enabled by the de-coordination of an equatorial o-phthalato donor. Coulombic forces must be overcome for this to happen, so this might seem surprising. However, de-coordination will be assisted if this ligand is in an axial position of the Jahn–Teller distorted ion. H-bonding to an inserted ammonia will also compensate. Of some relevance perhaps is the minor disorder of this group in the crystal structure which might indicate flexibility. This would then be involved in H-bonding to the coordinated ammine that has replaced it, hence the highly distinguishable νN–H in the IR spectrum. The other ammine ligand could then occupy the formally vacant axial site (Fig. 11). We recognise that this site was not directed towards the solvent accessible void space in the starting structure of {[Cu(tpt)(o-phthalate)]·31/3(C2H2Cl4)3}n. However, with the removal of so much co-crystallised TCE from the exceptionally large solvent accessible voids (65 %), a significant structural distortion might be possible. As a consequence, this vacant axial copper binding site becomes accessible to the void space. The binding of a ammonia may then trigger a ‘loosening’ of the equatorial o-phthalato donor to allow for insertion and coordination of the second NH3. This speculation is in accordance with the EPR results that show stronger donating ligands in the equatorial plane. Note that the elongation axis in the tetragonal coordination around copper could easily change from N2O2 to N2N2 at the active copper(ii) site. A depiction of this proposed mechanism is presented in Fig. 11.
Conclusion
In this investigation of copper 2,4,6-tri-4-pyridyl-1,3,5-triazine networks the synthesis and structural characterisation of a new porous CuII coordination polymer has been achieved. The Cu–tpt network adopts the unusual 12,3 topology with the CuII centres serving as T-connectors and the tpt ligands acting as regular trigonal connectors. Within the 3D network o-phthalate ligands act as additional bridges between CuII centres. The structure is closely related to that of [Ni(tpt)(NO3)2·solvate] and [Ni(tpt)(o-phthalate)2H2O·solvate] which share the same metal–tpt topology. Crystals of [Ni(tpt)(NO3)2·solvate] were shown to be relatively sensitive to solvent loss while [Ni(tpt)(o-phthalate)2H2O·solvate] was able to undergo desolvation and act as a gas adsorbent. Presumably the o-phathalate ligand’s ability to act as a ‘brace’, in linking helical M–tpt strands, results in the generation of a more robust network material. Bridging o-phthalate ligands also appear to provide structural support to the Cu–tpt network, allowing the compound to also act as a host coordination polymer. The incorporation of CuII in place of NiII offers the prospect of guests binding directly to the metal centre. Remarkably, the adsorption of the ammonia is unaffected by water vapour with no adsorption of water even under high humidity ammonia streams. Furthermore the sample exhibits no loss of performance with respect to its porosity through continuous cycles of adsorption and desorption.
Spectroscopic techniques along with TGA have proved to be informative in following the adsorption and desorption of ammonia. EPR spectroscopy in particular has been shown to be a powerful tool for elucidating changes in the environment of the CuII centre associated with the coordination of ammonia. Clearly, there is great scope for using EPR to probe changes in coordination environments of paramagnetic metal ions when they are incorporated into porous network materials.
The presence of vacant coordination sites within the [Cu(tpt)(o-phthalate)] network offers the prospect of introducing ligands that become tethered to the framework but have functional groups extending into the channels. Given the demonstrated porosity of this system it may be possible to introduce reagents that are able to combine with appropriately functionalised ligands within the chiral channels. Under these circumstances any reaction that might be promoted within this asymmetric, geometrically confined space may be different to those that would be generated in the absence of the host framework.
Crystallographic Data
CCDC 1905857 contain supplementary crystallographic data for the structure of {[Cu(tpt)(o-phthalate)]·31/3(C2H2Cl4)}n. These data can be obtained free of charge from The Cambridge Crystallographic Data Centre via www.ccdc.cam.ac.uk/data_request/cif.
Supplementary Material
TGA of {[Cu(tpt)(o-phthalate)]·31/3(C2H2Cl4)}n and EPR spectra of powdered bulk samples and powdered single crystals of {[Cu(tpt)(o-phthalate)](C2H2Cl4)3}n, [Cu(tpt)(o-phthalate)]n, and [Cu(tpt)(o-phthalate)n(NH3)2n] produced in situ by a flow of NH3 in He are available on the Journal’s website.
Conflicts of Interest
The authors declare no conflicts of interest.
Acknowledgements
This research did not receive any specific funding.
References
[1] H. Furukawa, K. E. Cordova, M. O’Keeffe, O. M. Yaghi, Science 2013, 341,| Crossref | GoogleScholarGoogle Scholar | 23990564PubMed |
[2] S. Kitagawa, R. Kitaura, S. Noro, Angew. Chem. Int. Ed. 2004, 43, 2334.
| Crossref | GoogleScholarGoogle Scholar |
[3] J.-R. Li, R. J. Kuppler, H.-C. Zhou, Chem. Soc. Rev. 2009, 38, 1477.
| Crossref | GoogleScholarGoogle Scholar | 19384449PubMed |
[4] X. Fang, B. Zong, S. Mao, Nano-Micro Lett. 2018, 10, 64.
| Crossref | GoogleScholarGoogle Scholar |
[5] H. Wang, W. P. Lustig, J. Li, Chem. Soc. Rev. 2018, 47, 4729.
| Crossref | GoogleScholarGoogle Scholar | 29532822PubMed |
[6] X. Zhao, Y. Wang, D.-S. Li, X. Bu, P. Feng, Adv. Mater. 2018, 30,
| Crossref | GoogleScholarGoogle Scholar | 30370676PubMed |
[7] J. Zhang, Z. Chen, J. Chromatogr. A 2017, 1530, 1.
| Crossref | GoogleScholarGoogle Scholar | 29150064PubMed |
[8] B. Timmer, W. Olthuis, A. van den Berg, Sens. Actuators B Chem. 2005, 107, 666.
| Crossref | GoogleScholarGoogle Scholar |
[9] G. W. Peterson, G. W. Wagner, A. Balboa, J. Mahle, T. Sewell, C. J. Karwacki, J. Phys. Chem. C. 2009, 113, 13906.
| Crossref | GoogleScholarGoogle Scholar |
[10] T. Kajiwara, M. Higuchi, D. Watanabe, H. Higashimura, T. Yamada, H. Kitagawa, Chem – Eur. J. 2014, 20, 15611.
| Crossref | GoogleScholarGoogle Scholar | 25313521PubMed |
[11] M. G. Campbell, D. Sheberla, S. F. Liu, T. M. Swager, M. Dincă, Angew. Chem. Int. Ed. 2015, 54, 4349.
| Crossref | GoogleScholarGoogle Scholar |
[12] A. Godiksen, F. N. Stappen, P. N. R. Vennestrøm, F. Giordanino, S. B. Rasmussen, L. F. Lundegaard, S. Mossin, J. Phys. Chem. C 2014, 118, 23126.
| Crossref | GoogleScholarGoogle Scholar |
[13] H. L. Anderson, S. Anderson, J. K. M. Sanders, J. Chem. Soc., Perkin Trans. 1 1995, 2231.
| Crossref | GoogleScholarGoogle Scholar |
[14] G. M. Sheldrick, SADABS V2012/1 1996 (University of Göttingen: Göttingen).
[15] G. M. Sheldrick, Acta Crystallogr. Sect. A: Found. Adv. 2015, 71, 3.
| Crossref | GoogleScholarGoogle Scholar |
[16] G. M. Sheldrick, Acta Crystallogr. Sect. C: Struct. Chem. 2015, 71, 3.
| Crossref | GoogleScholarGoogle Scholar |
[17] A. L. Spek, Acta Crystallogr. Sect. C: Struct. Chem. 2015, 71, 9.
| Crossref | GoogleScholarGoogle Scholar |
[18] O. Delgado-Friedrichs, Systre – Program for the Analysis of Periodic Nets v. 19.6.0 2019. Available at gavrog.org.
[19] A. F. Wells, Three-Dimensional Nets and Polyhedra 1977 (Wiley: New York, NY).
[20] A. F. Wells, Further Studies Of Three-dimensional Nets (ACA Monograph, No. 8) 1979 (American Crystallographic Association: New York, NY).
[21] M. O’Keeffe, M. A. Peskov, S. J. Ramsden, O. M. Yaghi, Acc. Chem. Res. 2008, 41, 1782.
| Crossref | GoogleScholarGoogle Scholar | 18834152PubMed |
[22] B. F. Hoskins, R. Robson, J. Am. Chem. Soc. 1990, 112, 1546.
| Crossref | GoogleScholarGoogle Scholar |
[23] R. Robson, B. F. Abrahams, S. R. Batten, R. W. Gable, B. F. Hoskins, J. Liu, in Supramolecular Architecture: Synthetic Control in Thin Films and Solids (Ed. T. Bein) 1992, pp. 256–273 (American Chemical Society: Washington, D.C.).
[24] M. O’Keeffe, B. G. Hyde, I. Crystal Structures, Patterns and Symmetry 1996 (Mineralogical Society of America: Washington, D.C.).
[25] B. F. Abrahams, S. R. Batten, M. J. Grannas, H. Hamit, B. F. Hoskins, R. Robson, Angew. Chem. Int. Ed. 1999, 38, 1475.
| Crossref | GoogleScholarGoogle Scholar |
[26] D.-S. Zhang, Z. Chang, Y.-F. Li, Z.-Y. Jiang, Z.-H. Xuan, Y.-H. Zhang, J.-R. Li, Q. Chen, T.-L. Hu, X.-H. Bu, Sci. Rep. 2013, 3, 3312.
| Crossref | GoogleScholarGoogle Scholar | 24264725PubMed |
[27] C. F. Macrae, P. R. Edgington, P. McCabe, E. Pidcock, G. P. Shields, R. Taylor, M. Towler, J. van de Streek, J. Appl. Cryst. 2006, 39, 453.
| Crossref | GoogleScholarGoogle Scholar |
[28] C. F. Macrae, I. J. Bruno, J. A. Chisholm, P. R. Edgington, P. McCabe, E. Pidcock, L. Rodriguez-Monge, R. Taylor, J. van de Streek, P. A. Wood, J. Appl. Cryst. 2008, 41, 466.
| Crossref | GoogleScholarGoogle Scholar |
[29] P. W. Anderson, P. R. Weiss, Rev. Mod. Phys. 1953, 25, 269.
| Crossref | GoogleScholarGoogle Scholar |
[30] R. Calvo, H. Isern, M. A. Mesa, Chem. Phys. 1985, 100, 89.
| Crossref | GoogleScholarGoogle Scholar |


