

Moister soils at elevated CO2 stimulate root biomass but suppress aboveground biomass production in Lolium perenne
Mark J. Hovenden A * , Amanda L. Sinclair A , Rose E. Brinkhoff A , Kate Stevenson A , Zachary A. Brown A , Meagan Porter A , Anna Flittner A , Marion Nyberg A and Richard P. Rawnsley B
A Biological Sciences, School of Natural Sciences, University of Tasmania, Private Bag 55, Hobart, Tas. 7001, Australia.
B Tasmanian Institute of Agriculture, University of Tasmania, Burnie, Tas. 7320, Australia.
Abstract
Increases in atmospheric carbon dioxide concentration ([CO2]) drive increases in biomass production via impacts on photosynthesis and water use. In grasslands, the scale of this stimulation is related to soil water availability. Recently, it has become clear that the way precipitation controls elevated CO2 (eCO2) effects on grassland biomass is strongly seasonal but no mechanism yet exists to explain these observations.
The aims of this study were to determine how seasonal water availability affects aboveground, belowground and total biomass responses of a perennial ryegrass pasture to [CO2].
We established the TasFACE2 experiment in a well-fertilised perennial ryegrass (Lolium perenne) monoculture with four seasonal irrigation schedules and three [CO2].
The total biomass production of perennial ryegrass pasture was strongly stimulated by eCO2, but this extra biomass was preferentially allocated to belowground growth. The relationship between soil water content and aboveground biomass varied seasonally but there was a strong positive relationship between soil water content and root biomass production in all seasons.
Increases in soil moisture caused by eCO2 contributed to increases in root growth, but root biomass production was also stimulated directly by eCO2. Restriction of irrigation, therefore, suppressed the belowground response to eCO2 and created a non-linear response of biomass to CO2 concentration.
Antagonistic above- and belowground responses mean that the rising [CO2] might not increase pasture production in the manner generally predicted.
Keywords: carbon dioxide, CO2 fertilisation effect, grassland, irrigation, pasture, perennial ryegrass, root growth, soil water content.
Introduction
There are convincing ecophysiological arguments to support the notion that the growth of C3 plants is limited by the current atmospheric concentration of carbon dioxide ([CO2]). Firstly, the net rate of photosynthetic carbon assimilation rises as the [CO2] increases in relation to the oxygen concentration because the carboxylation rate of ribulose-1,5-bisphosphate (RuBP) by Rubisco, the primary carboxylating enzyme, increases while the oxygenation rate of RuBP lessens (von Caemmerer and Farquhar 1981; Long 1991; Long and Drake 1992; Farquhar 1997; Long et al. 2004). Further, stomatal aperture reduces as [CO2] rises (Gifford 1979; Drake et al. 1997; Farquhar 1997; Long et al. 2004), reducing leaf and canopy-level transpiration and leading to water savings that prolong soil moisture benefits from precipitation or irrigation (Gifford 1979; Long et al. 2004; Morgan et al. 2004). Increases of growth by elevated CO2 concentration (eCO2), particularly of leaf area, have the potential to increase plant water use thereby counteracting the effects of reduced stomatal aperture (Fatichi et al. 2016; Gray et al. 2016), but many field studies have nonetheless demonstrated that eCO2 leads to a reduction in canopy transpiration (e.g. Hussain et al. 2013; Kellner et al. 2019), with a ~6% average eCO2-induced reduction of evapotranspiration across ecosystems (Bernacchi and VanLoocke 2015). These two physiological effects – increased photosynthesis and greater water use efficiency – lead to the widely held conclusion that the effect of elevated CO2 concentrations (eCO2) should be strongest when moisture is limited, most particularly in grasslands (Gifford 1979; Morgan et al. 2004; Reich et al. 2006a; Körner et al. 2007; McMurtrie et al. 2008; Morgan et al. 2011). This generalisation is supported by experimental results in which the biomass response to eCO2 was strongest in dry years (Morgan et al. 2004, 2011) and modelling shows stronger biomass responses to eCO2 in drier sites (Fatichi et al. 2016). However, other studies find no relationship between water supply and the strength of the eCO2 effect (Reich et al. 2006a; Norby and Zak 2011; Reich et al. 2014), limiting generalisations.
Both water availability and plant demand for water vary seasonally in grasslands (Knapp et al. 2001) meaning that any influences of eCO2 on improved water use efficiency would also vary seasonally. In addition, the eCO2 effect strengthens with increasing nitrogen (N) availability (Reich et al. 2006a, 2006b; McMurtrie et al. 2008), and N availability and N demand by plants are both strongly affected by the seasonal distribution of rainfall (Borken and Matzner 2009). Thus, it is logical that any relationships between the eCO2 effect on grassland biomass and water supply should vary seasonally. Indeed, results from the TasFACE experiment demonstrated that eCO2 stimulated grassland biomass production by an average of 13.9%, but this effect was heightened in years with more rainfall in summer and suppressed in years with more rainfall in autumn or spring (Hovenden et al. 2014). In addition, the differences among experiments in average grassland biomass response to eCO2 are strongly related to seasonal precipitation (Hovenden et al. 2019), indicating that the season in which precipitation occurs interacts with the mechanisms whereby eCO2 increases grassland biomass production.
Ultimately, one of the major objectives of investigating eCO2 effects on biomass production is to provide improved understanding and data to refine and constrain land–atmosphere and global climate models (De Kauwe et al. 2013, 2014, 2017; Zaehle et al. 2014; Medlyn et al. 2015; Ryan et al. 2017). However, the estimation of carbon balances to the rising [CO2] requires a detailed understanding of belowground as well as aboveground responses. This is particularly the case with grasslands, in which more than 50% of the biomass typically occurs belowground (Canadell et al. 1995; Carol Adair et al. 2009). Unfortunately, the difficulties inherent in estimating belowground biomass mean that there are far fewer reports of belowground responses to eCO2 (e.g. Owensby et al. 1993; Pineiro et al. 2017) than of aboveground responses (Ainsworth and Long 2005; Lee et al. 2010) and many estimations of vegetation responses to eCO2 rely solely on aboveground measurements. As biomass responses are often used to infer the impacts of rising [CO2] on carbon balance and sequestration, this could be problematic if belowground responses differ to those observed aboveground. Indeed, there is evidence that root responses to eCO2 are very variable (Arnone et al. 2000) and are dependent upon prevailing soil nutrient and moisture conditions. Assumptions that root responses to eCO2 are stimulated by limiting water and nutrient supply need to be tested directly (Madhu and Hatfield 2013). Pineiro et al. (2017) demonstrated that eCO2 effects on fine root growth decline with reducing water availability (Pineiro et al. 2017), in direct opposition to aboveground responses to eCO2, which are believed to increase as water availability declines (Fatichi et al. 2016). Therefore, relying solely on assessments of eCO2 effects on aboveground productivity could be misleading if total net primary productivity or carbon balance are of interest.
In an effort to reduce the impact of harvesting on experimental results, many manipulative experiments in grasslands collect an annual productivity estimate at peak biomass based on samples collected at one or very few times. Results from other experiments are often analysed and presented in terms of annual production, even if biomass is sampled many times per year. Therefore, despite evidence that the CO2 effect on grassland biomass production might be strongly seasonal and may be obscured by annual figures (Hovenden et al. 2014; Hovenden et al. 2019), few analyses have been designed specifically to determine how seasonal precipitation or irrigation influences the overall biomass response to eCO2 in grasslands.
Here, we use an experiment designed to investigate how alterations of seasonal water supply influence the biomass response of an agriculturally important grassland to eCO2. The TasFACE2 experiment was established in 2015 as the world’s only free air CO2 enrichment (FACE) experiment in which soil water supply was completely manipulated with no influence of precipitation on soil water content (Brinkhoff et al. 2019). By collecting relatively high-frequency estimates of above- and belowground biomass production, we aim to test whether limitation of water supply or the provision of excess water have different impacts on the biomass response to eCO2 in different seasons. By doing so in a system that is fertilised regularly, we reduce the impact of nutrient limitation on the growth response to eCO2, thus enabling the impacts of seasonal water availability itself to be determined. We also test whether the growth response to eCO2 is linear in this system by testing at three, rather than the usual two, CO2 concentrations. Specifically, here we test the following hypotheses: (1) that the stimulation of aboveground biomass production by eCO2 will be greater when water supply is restricted; (2) that the stimulation of belowground biomass production by eCO2 will be lower when water supply is restricted; (3) that the extent to which (1) and (2) occur will depend upon the season in which water supply is restricted; and (4) because of the divergent impacts of water restriction on the eCO2 effect on above- and belowground biomass production, that the total (i.e. above- + belowground) biomass response to eCO2 will not be predictable from aboveground responses.
Materials and methods
The TasFACE2 experiment
TasFACE2 is a free air CO2 enrichment experiment that was established at the University of Tasmania Farm in Cambridge, Tasmania (42°48′S, 147°25′E; 50 m above sea level) during the 2015 austral winter. The site has a Mediterranean climate with an annual mean maximum temperature of 17.5°C, minimum temperature of 8.2°C and mean annual precipitation of 492 mm over the past 30 years (see Supplementary Table S1). The soil is a strongly duplex, grey-brown chromosol (Isbell 2002) with sandy loam to a depth of ~30 cm on sandy medium to heavy clay. The site was a permanent pasture during preceding decades and prior to the establishment of TasFACE2 supported a relatively rich community dominated by cocksfoot (Dactylis glomerata), perennial ryegrass (Lolium perenne) and white clover (Trifolium repens). Five soil cores 20 cm in depth were collected immediately prior to site preparation for full soil analysis, which revealed that all essential elements were within the recommended range for ryegrass pastures in local conditions (Gourley et al. 2007). Late in the 2014/15 austral summer, the experimental site (~60 × 60 m) was sprayed with the non-selective herbicide glyphosate to kill all existing plants. Following the death of the pasture, the site was then mown and all plant material removed. The site was then irrigated and after 3 weeks sprayed again to kill plants that emerged from the seedbank. The site was then sown in April 2015 (mid-autumn) with Base AR37 Perennial Ryegrass cultivar (PGG Wrightson Seeds, Devonport, Tas., Australia) by direct drilling twice, each time at a rate of 20 kg seed ha−1, to give a total sowing rate of 40 kg seed ha−1 across the site. A combined nitrogen and phosphorus fertiliser (Nutriphos N:P:K 16:20:0, Hellagrolip, Athens, Greece) was applied 3 weeks after sowing at a rate of 30 kg N ha−1. At the beginning of the first summer (December 2015) phosphorus was applied as superphosphate at a rate of 1150 kg P ha−1 followed by subsequent applications of 250 kg P ha−1 every 6 months to prevent P-limitation (Gourley et al. 2007). Nitrogen was applied as urea immediately following each harvest at a rate of 2.3 kg N ha−1 day−1, which is approximately the application rate at which N-saturation of growth occurs in perennial ryegrass in Tasmania under well-watered conditions (Rawnsley et al. 2014).
In May 2015, 12 experimental plots (Fig. S1) were established, randomly distributed across the site with the restriction that no two plots should be within 6 m of each other. In each plot, a pentagon of 1.0 m circumradius was established by trenching to a depth of 1 m around the perimeter and along all five internal circumradii, giving five equal sectors of 0.48 m2. Each sector was wrapped with 0.2 mm plastic sheeting to a depth of 75 cm isolating it from adjacent sectors and surrounding soil. Each plot (containing five sectors) was covered by a 3 × 3 m rainout shelter of clear polycarbonate sheeting on a wooden frame at a height of 1.7 m (high side) and 1.4 m (lower side) to minimise the influence of natural precipitation on soil moisture. Each of these 12 experimental plots was randomly allocated to one of three [CO2] treatments; 400 μmol CO2 mol−1, 475 μmol CO2 mol−1, 550 μmol CO2 mol−1. [CO2] was manipulated by injection of pure CO2 in 2.0 m diameter ‘rings’ suspended over the centre of each plot and controlled using the technology used in the TasFACE experiment (Hovenden et al. 2006), with modification to provide three rather than two CO2 levels. The [CO2] in the centre of each elevated ring was monitored constantly by an infra-red gas analyser and the CO2 supply rate adjusted by proportional valves controlled via a central processing unit running a proportional integration algorithm (Hovenden et al. 2006). Each CO2 ring was raised as the pasture grew, to ensure that the ring was ~10 cm above the canopy, and then lowered again following each harvest. Plots receiving 400 μmol CO2 mol−1 had all infrastructure but received no additional CO2. Fumigation began 1 July 2015 with all eCO2 plots receiving an additional 10 μmol CO2 mol−1 above ambient. This value was increased by 10 μmol CO2 mol−1 each week until the target was reached, except that the final stepped increase in [CO2] was only 5 μmol CO2 mol−1 for plots receiving 475 μmol CO2 mol−1. Thus, the target of 475 μmol CO2 mol−1 was reached on 19 August 2015 and that of 550 μmol CO2 mol−1 on 7 October 2015. Fumigation was year round, commencing each day at sunrise and ceasing at sunset, and continued in all weather conditions including high winds. During the study period, all plots were within 20% of the set-point 93% of the time and within 10% of the set-point 85% of the time, with a mean [CO2] in eCO2 plots of 476 ± 0.2 μmol CO2 mol−1 and 549 ± 0.3 μmol CO2 mol−1.
Each of the five sectors in each plot was watered via an independent irrigation system. Irrigation water was delivered to each sector twice weekly by five evenly spaced dripper heads connected to automated irrigation controllers. Water demand was determined using the biophysical pasture simulation model DairyMod (Cullen et al. 2008; Johnson et al. 2008; Perring et al. 2010). DairyMod is a fully mechanistic pasture simulation model developed for Australian and New Zealand conditions that uses weather, soil properties, soil water, soil nutrient availability and light-penetration profiles to drive pasture growth on a daily timestep (Johnson et al. 2008). The model contains a soil water module, a biogeochemical module that includes decomposition, soil organic matter and inorganic nutrient dynamics. Management modules include irrigation, fertiliser application and animal activity and stocking rates (Johnson et al. 2008). The model was originally developed for ryegrass-based pastures and simulates pasture production rates well for such pastures in Australian temperate zones (Cullen et al. 2008). The simulation was parameterised for perennial ryegrass and site soil properties and mimicked management at the experimental site with pasture being cut monthly to 20 mm, harvested biomass removed and N fertiliser applications as detailed above. Daily weather conditions for the site averaged over the preceding 5 years were used to simulate growth and to calculate monthly irrigation requirements assuming zero precipitation. Model simulation runs were conducted as explained in Perring et al. (2010). Simulation results were used to determine an ‘adequate’ irrigation depth (mm) assuming a [CO2] of 400 μmol CO2 mol−1.
Four of the five sectors in each plot were used to investigate how seasonal irrigation supply affected the CO2 growth response. Because of the strong influence of seasonal precipitation on the influence of eCO2 on the annual production of south-eastern Australian native pasture (Hovenden et al. 2014) and indeed on the mean biomass response across 19 grassland eCO2 experiments (Hovenden et al. 2019), we decided to restrict or increase the water supply in each of the seasons other than winter. We did not vary water supply during winter because growth rates are low and previous research indicated that variation in precipitation during winter had little influence on the impacts of eCO2 on biomass production in Tasmania (Hovenden et al. 2014). Thus, one of the five sectors in each plot was designated to receive restricted irrigation in spring but excess in summer, one to receive restricted irrigation in summer but excess in spring and autumn and one to receive restricted irrigation in autumn but excess in spring. A fourth sector was designated to receive adequate irrigation in all seasons and in a sense to act as an irrigation ‘control’. Irrigation in all seasons not specifically mentioned was as in the adequate sectors and all plots received adequate irrigation during winter. Those sectors receiving restricted irrigation in a particular season received 40% less than those receiving adequate irrigation, whereas those sectors receiving excess irrigation received 25% more than that received by the adequate sectors. Thus, both the total amount of irrigation differed among the sectors as did the seasonal distribution of that irrigation. Irrigation volumes were not adjusted for presumed influences of eCO2 on evapotranspirational demand, such that those sectors receiving adequate irrigation received the same volume of irrigation water regardless of their [CO2]. Irrigation occurred between midnight and ~5 a.m. twice per week. Full details of the irrigation treatments are supplied in Table S2. The fifth sector in each plot was used for a separate study and received the same irrigation supply as the adequate sectors but data from these sectors were not used in this study. Each sector within each plot was randomly allocated to a particular treatment, so the arrangement of the sectors varied among plots.
Soil volumetric water content (SWC) was estimated in both the surface 10 cm and at a depth of 20 cm. Surface SWC was measured twice weekly using a FieldScout 300 TDR probe (Spectrum Technologies, Aurora, IL, USA) with five evenly spaced measurements taken in each sector. SWC at 20 cm was logged continuously with underground time-domain reflectometry (TDR) sensors (CS616, Campbell Scientific Australia, Townsville, Qld) installed horizontally at a depth of 20 cm. Data from the buried sensors were logged continuously and recorded hourly on a CR1000 datalogger (Campbell Scientific Australia).
The experiment concluded mid-May 2017.
Plant growth measurements
The sown pasture was left to grow until mid-October 2015 (mid-spring) to allow full ground coverage to develop and to allow the target [CO2] to be reached in all plots. Two weeks after the 550 μmol CO2 mol−1 plots first received their target [CO2], aboveground biomass was removed from all sectors in all plots by defoliating to a residual height of 20 mm using handheld grass shears. At this time, the pasture was fully developed with a dense, continuous grass sward and no visible bare ground. Subsequent harvests occurred when plants reached the three-leaf regrowth stage to maintain vegetative growth and to prevent flowering, with the pasture in each sector in each plot defoliated to a residual height of 20 mm. Consequently, plants did not produce flowers during the experimental period. All harvested material was returned to the laboratory, dried at 60°C for 1 week then weighed.
Root biomass production was estimated using root ingrowth bags from April 2016 until April 2017. Soil was cored to a depth of 20 cm with a 2.5 cm diameter auger in three places, each randomly located in one-third of the triangular plot sector (i.e. outer left, outer right and inner thirds) and soil and roots returned to the laboratory. All holes were filled to a depth of 10 cm with sieved, bulked soil collected from the study site but outside of the plots. In each hole, a cylindrical bag of nylon 2 mm mesh was inserted to a depth of 10 cm and filled with sieved, bulked local soil, with the mesh extending 2 cm above the soil surface to allow them to be relocated. These root ingrowth bags were replaced approximately every 2 months with bags being removed by cutting around the outside perimeter of each bag with a sharp knife, removing the bag and its contents, replacing the mesh bag with a new bag and refilling the bag with sieved soil. Root ingrowth bags were returned to the laboratory and frozen until processing. Processing involved soaking the bags in 5% sodium hexametaphosphate solution for ~24 h, then manually washing the slurry into a sequence of sieves ending in 0.25 mm mesh size. All root material was picked from the sieves, dried at 60°C for 1 week and weighed. Collected root material was combined at the sector level in the laboratory and processed as a single sample. Initially, we used two separate root ingrowth bags, one covering 10–20 cm depth and one 0–10 cm, but there was such small quantities of root material collected from the 10–20 cm depth in any plot that root growth measurements were limited to a depth of 0–10 cm. Further, extraction of individual plants at the end of the experiment revealed that >90% of all root biomass at this site was located in the top 5 cm of the soil profile regardless of treatment. Therefore, we are confident that obtaining root growth estimates at 0–10 cm effectively estimates total root growth in this species at this site. Root biomass production was expressed per unit ground surface area and extrapolated to the sub-plot (sector) level by multiplying by sector area. Total biomass was then calculated as the sum of aboveground and root biomass, each expressed per unit area.
Statistical analyses
All data were analysed by linear mixed effect models using the lme4 (Bates et al. 2015) and car (Fox and Weisberg 2019) packages in the R statistical software environment, ver. 4.0.0 (R Core Team 2020). Each harvest was analysed separately with a mixed effect model using CO2 as a fixed factor applied at the plot level with sector (irrigation treatment) in sub-plots nested within plots. Because the likelihood ratios from the mixed models indicated an interaction between irrigation and [CO2] that differed among harvests, differences in biomass production among CO2 levels were analysed separately for each irrigation treatment at each harvest. To test for the influence of season and the relationship between soil water content, growth and the CO2 response, data were pooled by season and analysed by season with a model containing CO2 as a fixed effect and seasonal soil water content at the sector level as a covariate. Comparisons of estimated marginal means were made using the emmeans package (Lenth 2022). All data were checked for heteroscedasticity and normality by plotting and using the Box–Cox function of the MASS package (Venables and Ripley 2002) in R. When required, dependent variables were transformed as indicated by the Box–Cox test.
Results
Aboveground biomass and soil water content
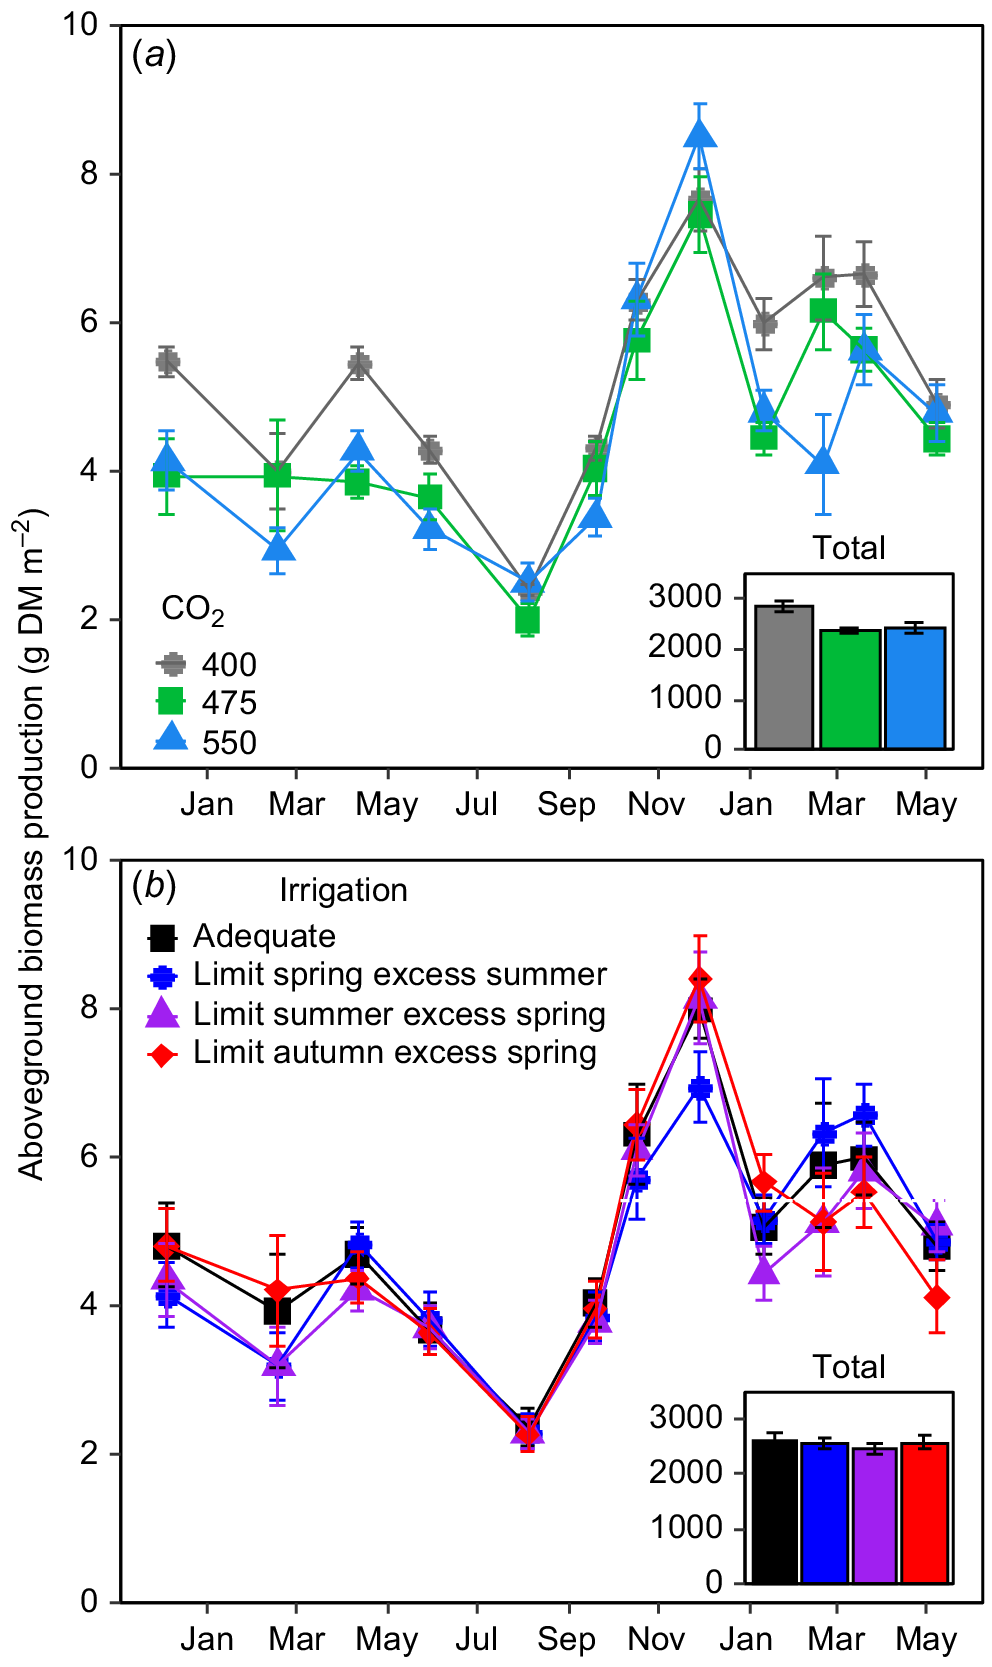
Elevated CO2 did not stimulate daily aboveground biomass production of perennial ryegrass in any watering treatment at any time in the TasFACE2 experiment (Fig. 1a). In fact, daily aboveground biomass production was reduced by eCO2 in 6 of the 12 harvest periods with there being no impact of CO2 treatments in the remainder of sampling period (Fig. 1a). Importantly, irrigation treatment had no influence on the CO2 effect on aboveground biomass production (CO2 × Irrigation P = 0.99). Reductions in aboveground biomass production by eCO2 seemed to be limited to summer, autumn and winter, with no differences in aboveground biomass among FACE treatment levels in spring (Fig. 1a). The impact of a 75 μmol CO2 mol−1 increase in [CO2] was mostly similar to the impact of an increase of 150 μmol CO2 mol−1, indicating that the CO2-response of aboveground biomass production was not dose-related (Fig. 1a). When considered cumulatively over the entire 19 month sampling period, plots exposed to 400 μmol CO2 mol−1 produced 2868 ± 95.8 g DM m−2 aboveground biomass whereas those exposed to 475 μmol mol−1 produced 16.0% less (2409 ± 52.9 g DM m−2) and those exposed to 550 μmol CO2 mol−1 produced an essentially identical 2420 ± 90.7 g DM m−2, a reduction of 15.6% from the controls.
The impact of (a) [CO2] and (b) irrigation treatments on aboveground biomass production in the TasFACE2 experiment. Main panels display daily dry matter production; insets show total dry matter production over the sample period. Those plots receiving limited water supply received 40% less water than those in adequate plots and those receiving excess received 25% more. Values shown are means ± s.e. (n = 4 in (a), n = 12 in (b)).
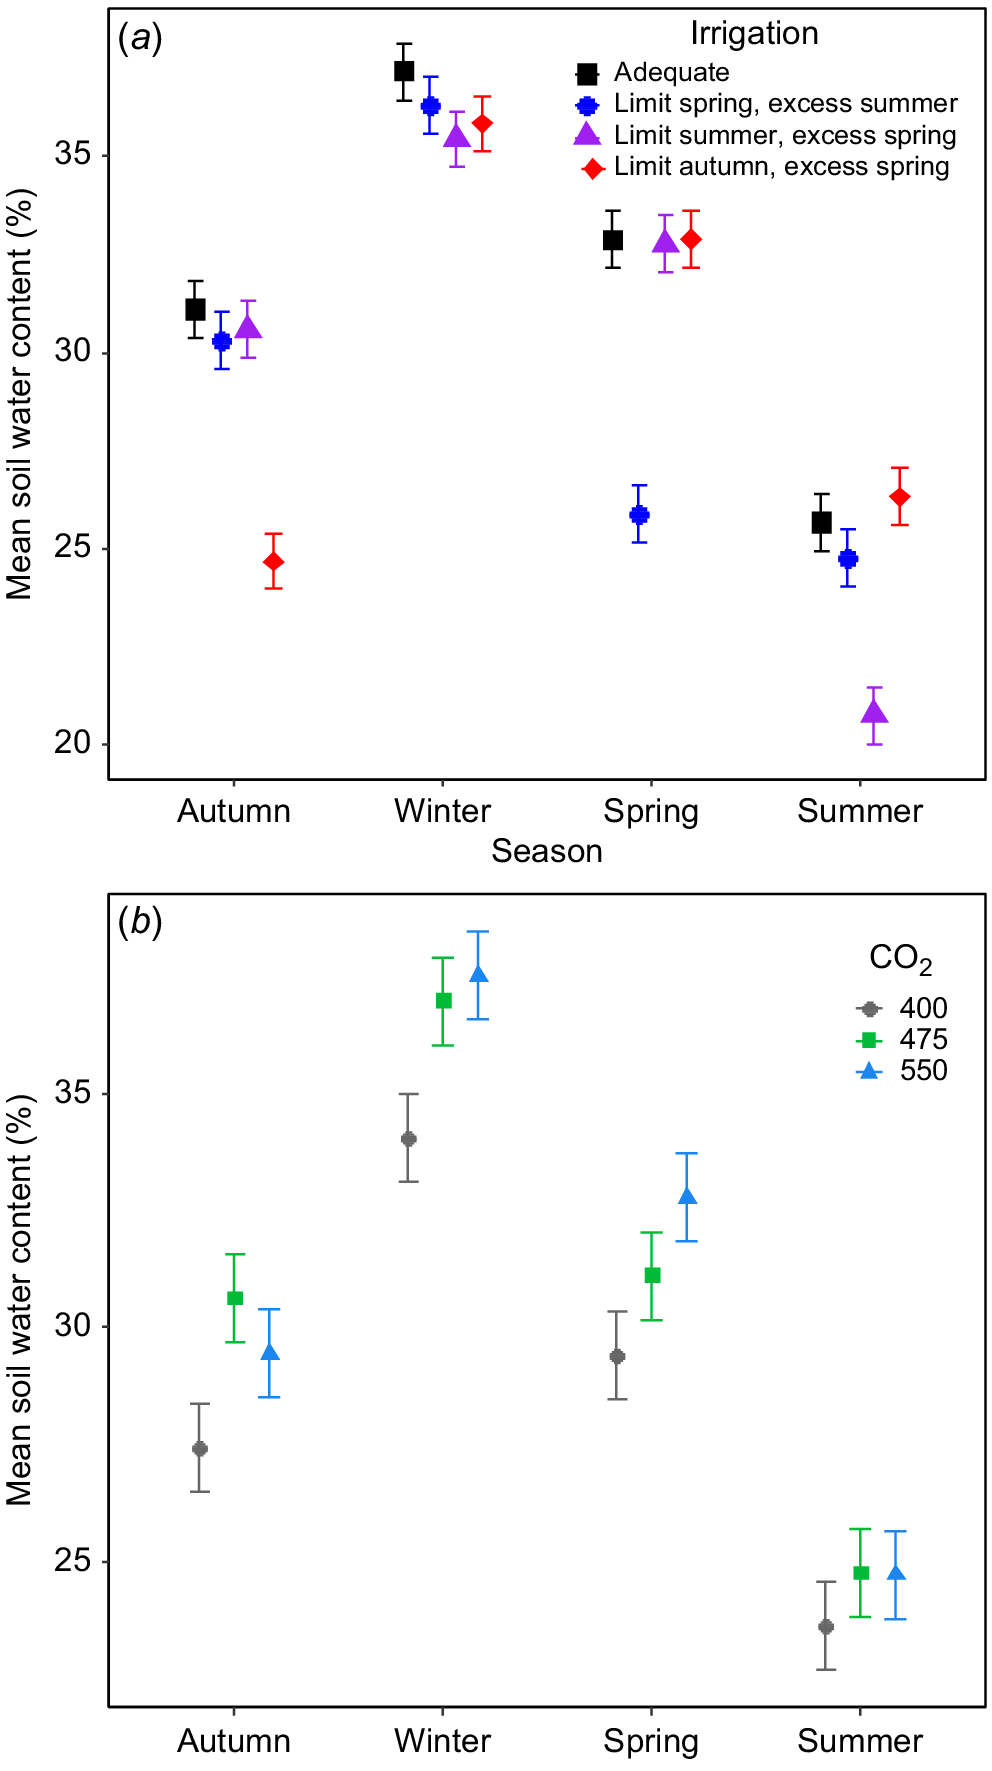
CO2 treatments and irrigation both influenced soil water content (SWC) but this effect varied among seasons (Fig. 2). The seasonal restriction of irrigation had obvious impacts on soil water content (SWC) in the top 10 cm of the soil at each [CO2], demonstrating the effectiveness of the irrigation treatments (Fig. 2a), with plots receiving limited irrigation having ~6% lower SWC than the other plots (Fig. 2a). SWC did not differ between sectors receiving excess irrigation and those receiving adequate irrigation in any season (Fig. 2a). Although SWC varied substantially over time, eCO2 tended to increase SWC; but this effect varied seasonally (Fig. 2b). Overall, the soils was moister in plots at 475 and 550 μmol CO2 mol−1 than in control plots in autumn and winter but in spring only plots at 550 μmol CO2 mol−1 had higher SWC than control plots, with plots at 475 μmol CO2 mol−1 lying in between. Interestingly, there was no effect of eCO2 on SWC during summer (Fig. 2b).
The impact of (a) irrigation and (b) [CO2] on mean seasonal soil water content in the uppermost 10 cm in the TasFACE2 experiment. Those plots receiving limited water supply received 40% less water than those in adequate plots and those receiving excess received 25% more. Values shown are means ± s.e. (n = 12 in (a), n = 4 in (b)).
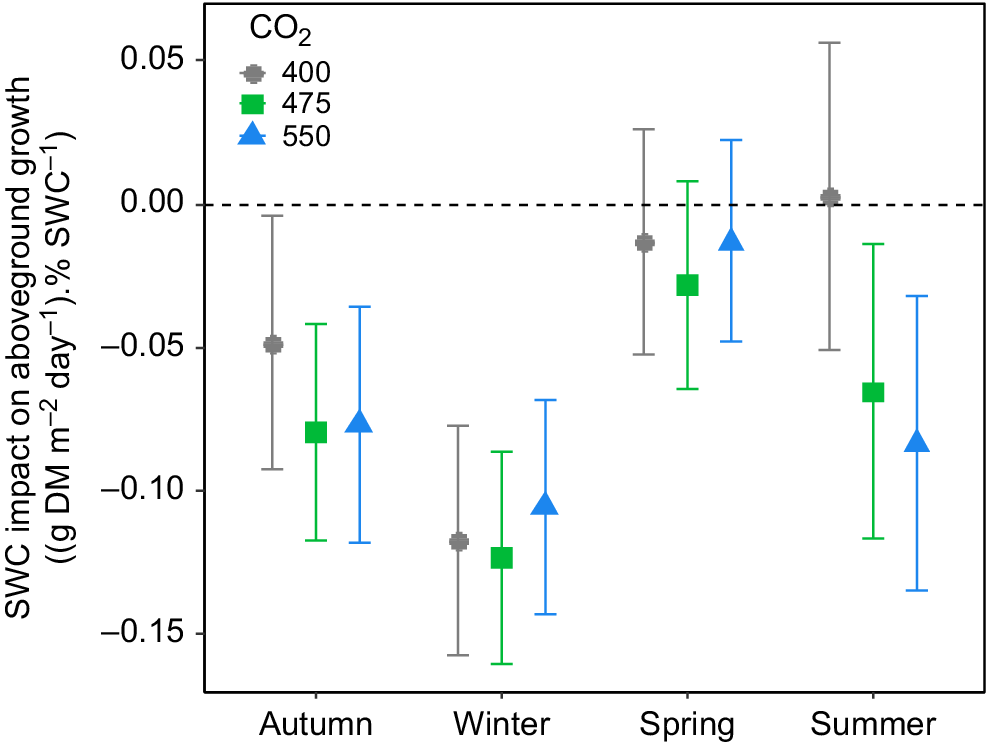
Irrigation treatments also did not influence the daily aboveground biomass production in the TasFACE2 experiment (Fig. 1b), nor did they interact with CO2 treatment. In general, the moister the soil, the lower the production rate of aboveground biomass (Fig. 3). In autumn and winter, the reduction in aboveground biomass production by increasing SWC was consistent across CO2 levels (Fig. 3). In spring, however, aboveground biomass production was not affected by SWC at any [CO2] (Fig. 3). The only substantial influence of [CO2] on the relationship between SWC and aboveground biomass production occurred during summer, at which time increasing SWC tended to reduce aboveground biomass production in eCO2 plots but not in control plots, as indicated by the negative slope of the relationship between SWC and aboveground biomass (Fig. 3). Therefore, increasing soil water content tended to reduce aboveground biomass production in autumn and winter in all plots and during summer in plots exposed to eCO2.
The influence of soil water content (SWC) on mean daily aboveground biomass production as a function of [CO2] in the TasFACE2 experiment. Values shown are average slopes with 95% confidence limits of the relationship between aboveground biomass production and SWC. The dashed line shows a slope of zero. Positive values indicate a stimulatory effect; negative values indicate a suppressive effect of increasing SWC.
Root biomass
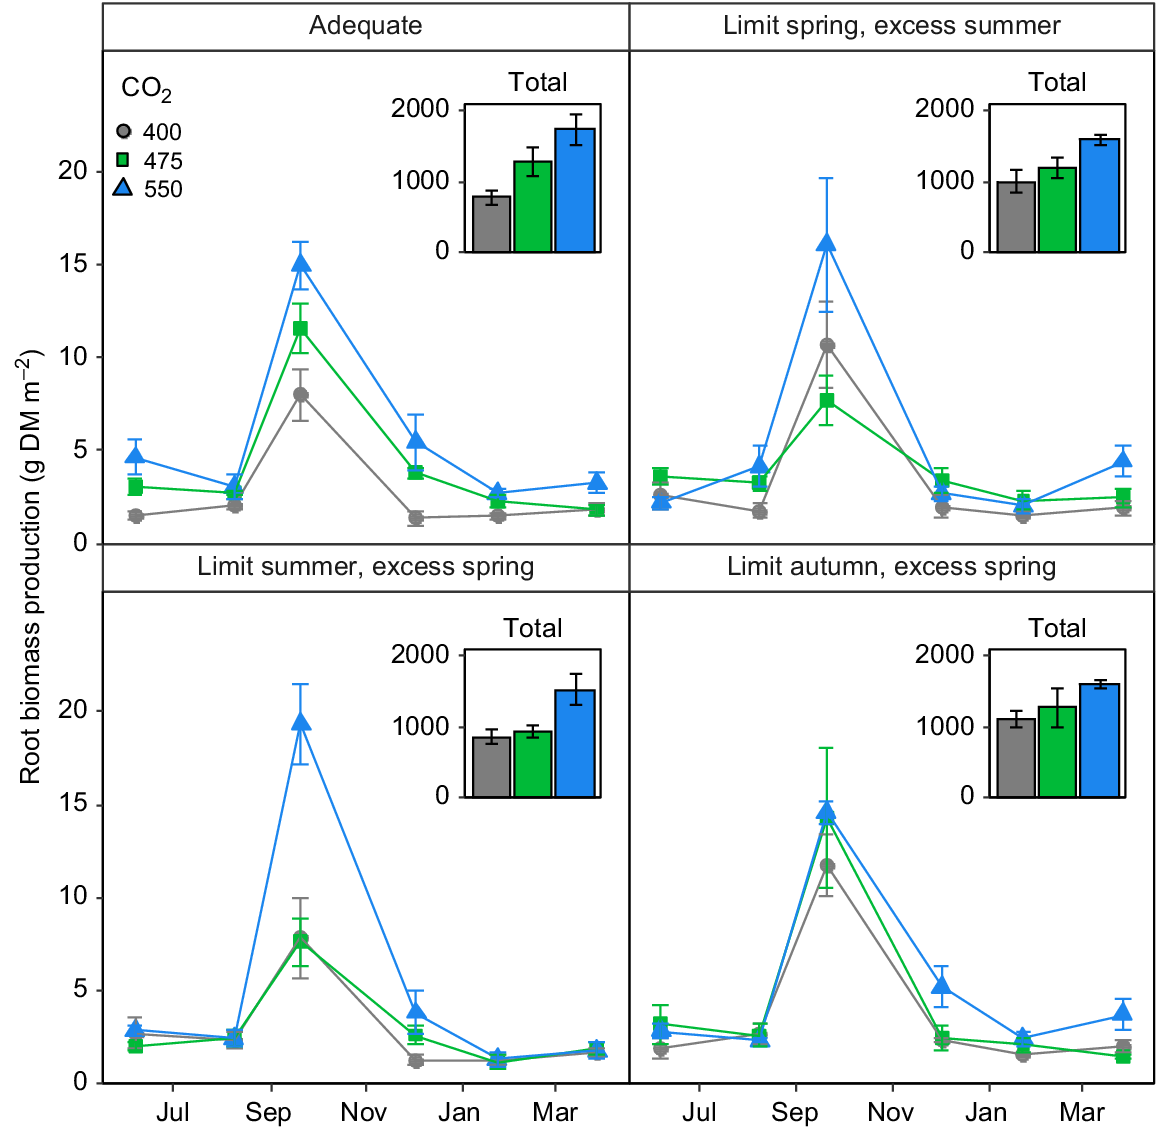
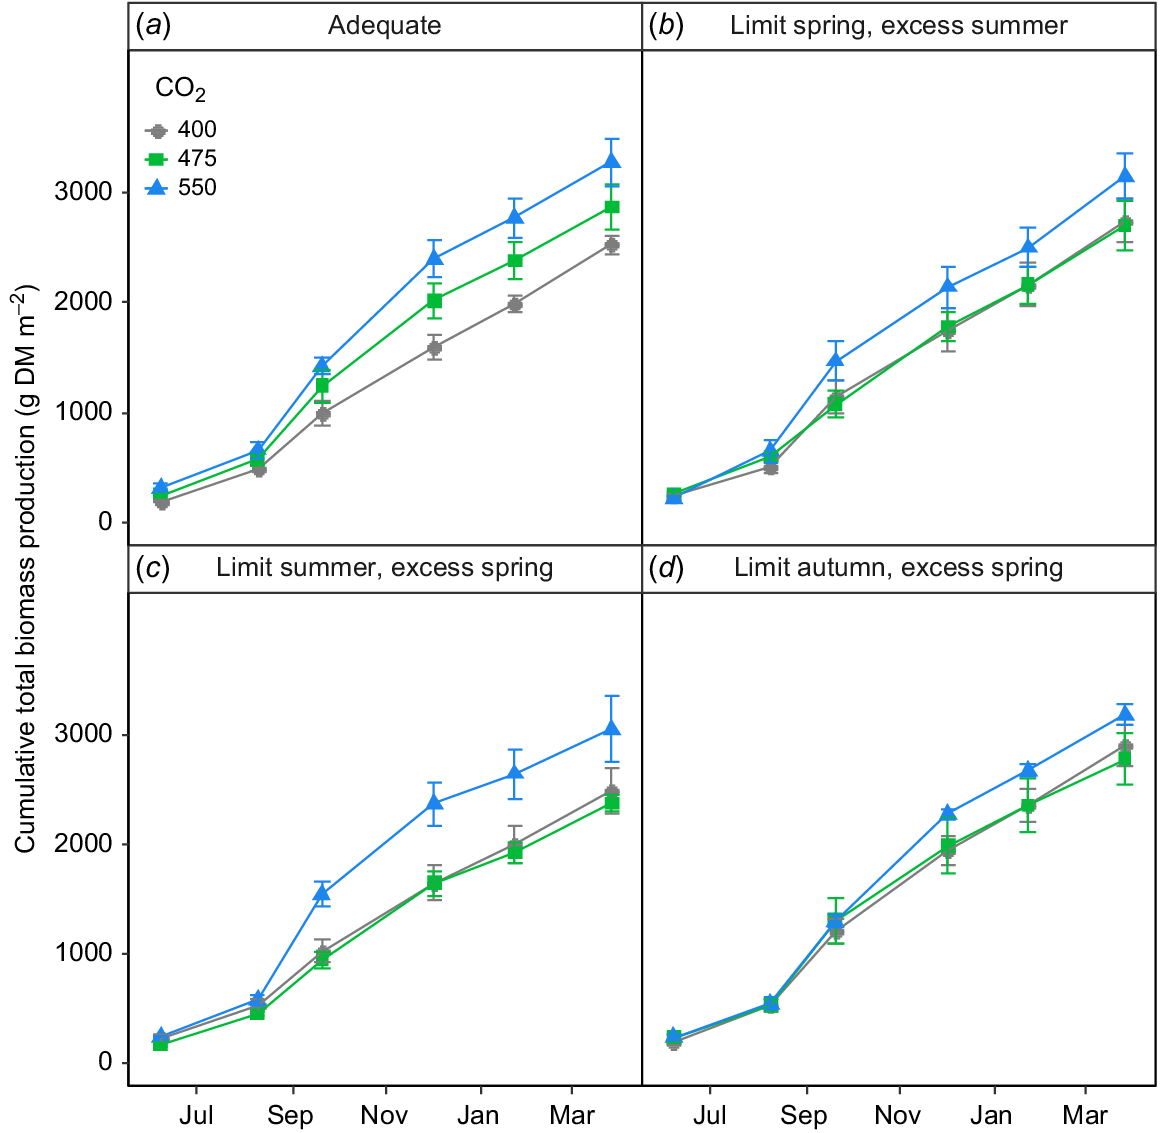
The lack of any stimulation of aboveground biomass by eCO2 was not reflected in root biomass production (Fig. 4). Indeed, there was a strong impact of FACE treatment on root biomass production (P = 0.01), but this effect was mediated both by time and the irrigation treatment (P < 0.02). Root biomass production tended to increase with increasing [CO2] more or less linearly and rather consistently over time (Fig. 4a) in plots provided with adequate irrigation, whereas limiting irrigation in some seasons and providing excess in others had complex impacts on root growth (Fig. 4b–d).
The impact of [CO2] on root growth in the TasFACE2 experiment, as a function of irrigation treatments. Main panels display daily dry matter production; insets show total dry matter production over the sample period. Those plots receiving limited water supply received 40% less water than those in adequate plots and those receiving excess received 25% more. Values shown are means ± s.e. (n = 4).
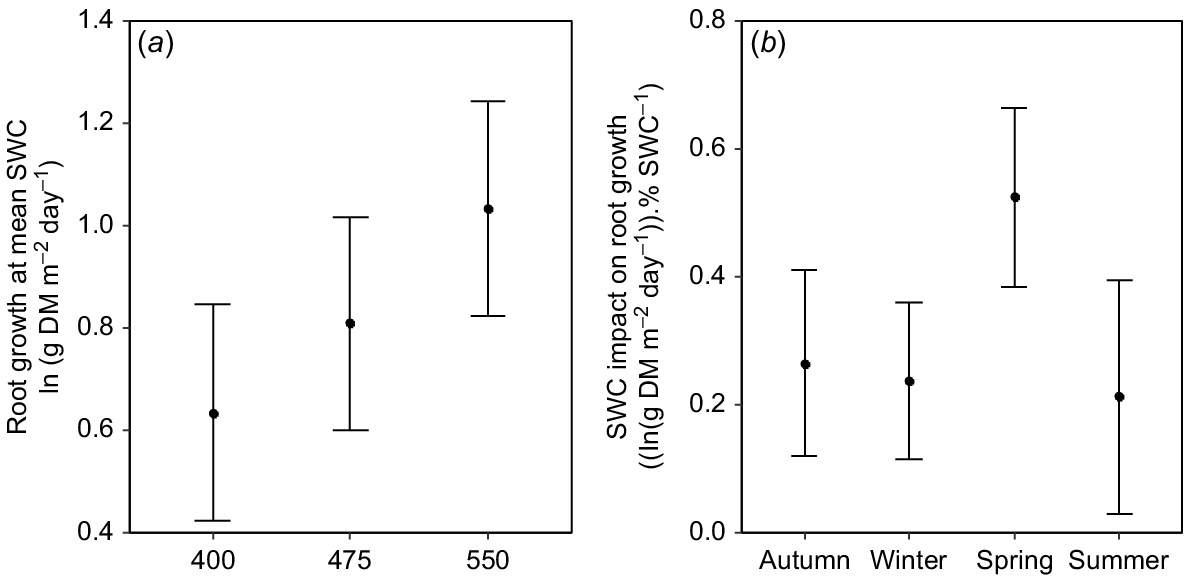
When treatment effects on SWC were taken into consideration, there was a consistent and positive effect of eCO2 on root biomass production (Fig. 5a). When compared at overall mean SWC, root biomass production at 550 μmol mol−1 was 63% greater than that at 400 μmol CO2 mol−1 (Fig. 5a). Further, there was a positive relationship between SWC and root biomass production (F1,274 = 12.9, P < 0.001) in all seasons (Fig. 5b). Overall, therefore, moister soils led to greater root biomass production, particularly in spring, but there was a strong, independent stimulatory effect of eCO2 (Fig. 5a).
(a) Mean daily root production at overall mean soil water content (SWC) as a function of [CO2] in the TasFACE2 experiment. Values shown are marginal means with 95% confidence limits. (b) The influence of increasing SWC on mean daily root production as a function of season in the TasFACE2 experiment. Values shown are the slopes with 95% confidence limits of the relationship between the natural logarithm of daily root biomass production and SWC in each season.
Root:shoot and total biomass
Plants growing in eCO2 plots had a considerably increased root-to-shoot ratio compared to plants growing in control plots across all harvest periods and all irrigation treatments (P < 0.01; Fig. S2), although the degree of stimulation of root-to-shoot ratio by eCO2 varied both seasonally (P < 0.001) and with irrigation treatment (P = 0.01). The mean root-to-shoot ratio of plants supplied with adequate irrigation was 187% greater at 550 μmol CO2 mol−1 than at 400 μmol CO2 mol−1 but in plots receiving less than adequate irrigation in any season, the root-to-shoot ratio at 550 μmol CO2 mol−1 was approximately double that at 400 μmol CO2 mol−1 (Fig. S2). Similarly, although eCO2 increased the root-to-shoot ratio across the year, the stimulation was greatest in spring (Fig. S2).
Limiting irrigation or supplying excess water in any season altered the relationship between [CO2] and total biomass production (Fig. 6b–d), which was remarkably linear in plots supplied with adequate water at all times (Fig. 6a). Thus, elevating the [CO2] to 475 μmol CO2 mol−1 had virtually no impact on total biomass production in any plots in which irrigation was restricted at any time of year (Fig. 6b–d). The situation at 550 μmol CO2 mol−1, however, was quite different with some increase in total biomass production occurring in all plots and substantial increases occurring in two of the four irrigation treatments (Fig. 6). Thus, CO2-response of total biomass production in this ecosystem was strongly non-linear when water supply was limited or excessive in any season.
The impact of [CO2] on cumulative total biomass (i.e. above- + belowground biomass) production in the TasFACE2 experiment, as a function of irrigation treatments. Those plots receiving limited water supply received 40% less water than those in adequate plots and those receiving excess received 25% more. Values shown are means ± s.e. (n = 4).
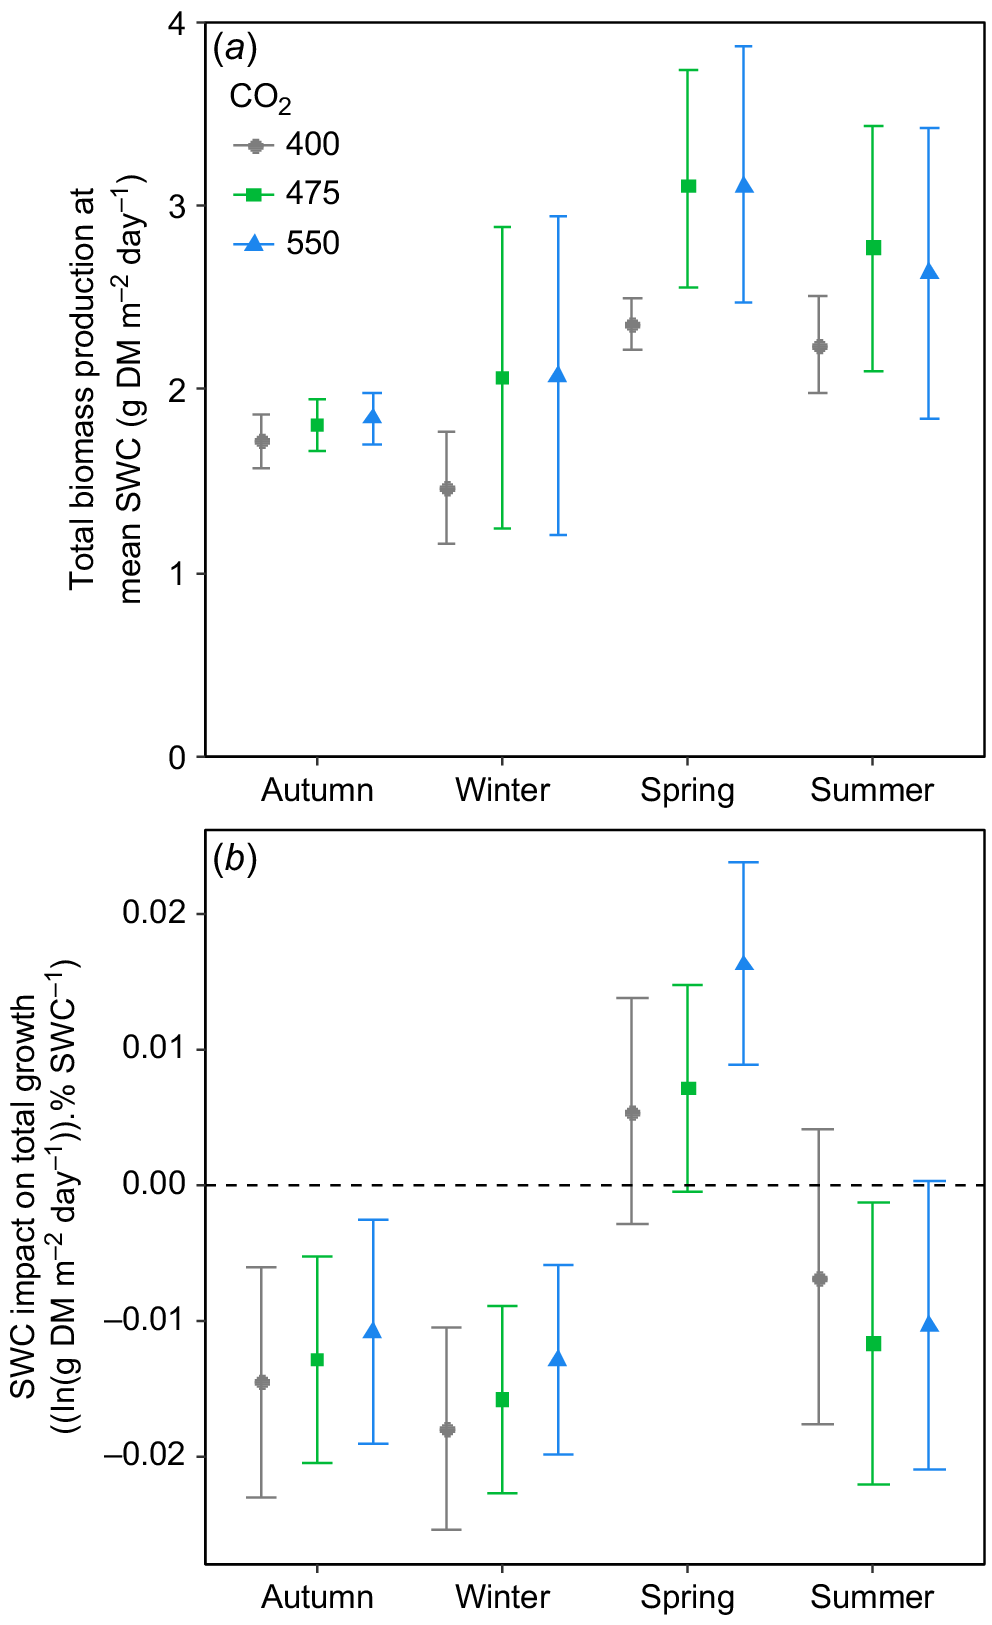
When compared at a common SWC, eCO2 tended to increase total biomass production, most consistently during spring (Fig. 7a), with the response being strongly variable in both winter and summer. There was a striking effect of season on the influence of [CO2] on the slope of the relationship between total biomass production and SWC (Fig. 7b). In autumn, winter and spring, increasing [CO2] tended to increase the slope of the relationship of SWC with biomass, but this effect was most pronounced in the spring (Fig. 7b). During summer, eCO2 had little impact on the relationship between SWC and biomass, but what influence there was tended to be negative (Fig. 7b). Importantly, it was only during spring that total biomass production increased with increasing SWC, as in all other seasons, total biomass production tended to be reduced by increases in SWC (Fig. 7b).
(a) Daily total biomass (i.e. above- + belowground biomass) production at overall mean soil water content (SWC) as a function of [CO2] and season in the TasFACE2 experiment. Values shown are marginal means with 95% confidence limits. (b) The influence of increasing SWC on daily total biomass production as a function of season and [CO2] in the TasFACE2 experiment. Values shown are the slopes with 95% confidence limits of the relationship between the natural logarithm of daily total biomass production and SWC in each season at each [CO2]. The dashed line shows a slope of zero.
Discussion
In this study, we sought to determine whether experimentally-applied seasonal shortages or excesses in water supply altered the growth responses of a widely-sown C3 pasture grass to elevated CO2 concentrations. As hypothesised, we found that the growth responses to eCO2 above ground differed markedly to those below ground, but the details of the responses themselves were quite unexpected. Our first hypothesis, that eCO2 will stimulate aboveground biomass production more when water is limited was not proven, as this aspect of production was never stimulated by eCO2 at TasFACE2. We did, however, find strong support for our second hypothesis, namely that eCO2 will stimulate below ground biomass production less when water supply is limited.
In our experiment, aboveground biomass production was never increased by eCO2, regardless of seasonal water supply, completely contrary to our first hypothesis. In contrast, there were substantial interactions between [CO2] and irrigation on root growth. Generally, root growth increased with increasing [CO2] but the degree of growth response depended strongly upon the irrigation treatment. Root growth in perennial ryegrass is strongly dependent upon the supply of C from the shoot (Robin et al. 2018), so it is logical that root growth will respond strongly to eCO2 in this species. Our analyses revealed complex relationships between season, soil water content and biomass production that influenced the CO2 response, meaning the results did not comply with our second or third hypotheses either. Finally, the results confirmed that total biomass responses could not be inferred from aboveground responses, complying with our fourth hypothesis, but not for the reasons we suggested.
Overall, the results from the TasFACE2 experiment delivered several important outcomes. First, total biomass (i.e. the sum of above and belowground biomass) production increased almost perfectly linearly with [CO2] when plots were supplied with adequate irrigation in all seasons. In fact, total biomass increased by 14.0% when the [CO2] was increased by 18.75% from 400 to 475 μmol CO2 mol−1. A further increase in the [CO2] from 475 to 550 μmol CO2 mol−1, led to an additional 13.6% increase in total biomass, giving an overall productivity increase of 29.5% for a 150 μmol CO2 mol−1, or 37.5%, increase in [CO2]. This is almost exactly the figure (31%) reported by Ainsworth and Long (2005) as the mean stimulation of light-saturated photosynthetic carbon assimilation of C3 plants in FACE experiments. Moreover, a biomass increase of 29.5% is close to the theoretically calculated value for the direct growth stimulation for Lolium perenne, given the photosynthetic response to eCO2 of ~40% in this species (Ainsworth et al. 2003; Ainsworth and Long 2005). Thus, in conditions of continuously adequate water supply and non-limiting nutrient availability, L. perenne plants in the TasFACE2 experiment increased their whole-plant growth rate in line with the eCO2 stimulation of photosynthetic carbon assimilation, demonstrating that substantial increases in grassland biomass production are possible at elevated [CO2], but also that this does not necessarily result in increased herbage production.
Second, the unique design of TasFACE2, permitting complete control of water supply, allowed us to determine that withholding water in one season, and supplying it in excess in another season, fundamentally changed the shape of the relationship between total biomass production and [CO2]. In fact, increasing the [CO2] from 400 to 475 μmol CO2 mol−1 resulted in no change in total biomass production if water supply was anything other than adequate in all seasons. This was unexpected because the water-savings effects of reduced stomatal conductance at eCO2 were expected to lead to greater effects of eCO2 on biomass production in periods during which water supply was less than adequate. It was clear from the results shown here that this was not the case, even when water was withheld in the warmest months. Our analysis of the relationships between soil water content and biomass production are key to understanding these findings.
Root biomass production was obviously strongly seasonal in L. perenne at this site, with highest growth rates occurring during spring. As previously suggested (Arnone et al. 2000; Pineiro et al. 2017), limiting water supply during this period of peak root growth reduced the belowground biomass response to eCO2, because of the strong sensitivity of root growth to soil water content during spring (Fig. 5). Hence, the reaction of root growth to [CO2] during the spring dominated the biomass responses. Root growth was increased by 81% (475 μmol CO2 mol−1) and 141% (550 μmol CO2 mol−1) in plots supplied with adequate irrigation in the spring, but CO2 treatments had much less impact in plots receiving less than adequate irrigation, because the reduction in soil water content restricted root biomass production (Fig. 5b). What is also apparent is that under ‘ideal’ conditions, the root growth response to [CO2] in L. perenne was linear up to 550 μmol CO2 mol−1, as has been demonstrated before (Anderson et al. 2010), and varying irrigation from adequate in any season alters this relationship. This influence of water supply on the response to [CO2] is supported by other studies demonstrating that interactions among environmental factors can lead to substantial non-linearity of responses (Ackerly and Bazzaz 1995; Gill et al. 2002; Zhou et al. 2008; Zhu et al. 2016).
Our analyses demonstrate that the strong impact of eCO2 on root biomass production at TasFACE2 was due to (1) a direct stimulatory effect of eCO2, (2) the positive relationship between root production and increasing soil water content and (3) eCO2-driven increases in soil water content. It is also evident that the large stimulation of root biomass production by eCO2 in spring coincided with a substantially increased sensitivity of root biomass production to soil water content. Importantly, we found no evidence that eCO2 altered the relationship between root production and soil water content. Instead, eCO2 drove increases in root growth directly and by increasing soil water content.
Third, whereas both total biomass and root growth responses to eCO2 were strong, at least at 550 μmol CO2 mol−1 and in some irrigation treatments, biomass allocation to aboveground plant parts was either unaffected or reduced by eCO2. This is a surprising result, as it would be expected that shoot growth would be stimulated by eCO2 in this fast-growing pasture grass, particularly under the conditions of relatively high nutrient availability. The reduction in aboveground growth occurred in all seasons but was least pronounced during the spring. Previous studies that have shown an overall suppression of aboveground production by eCO2 have linked this to low productivity and overall growth (Song et al. 2019), but this is not the case here where total biomass was stimulated and aboveground biomass production rate was still high. The situation at TasFACE2 appears to be more a matter of altered biomass allocation, as the total biomass response to eCO2 was strong. An increase in biomass allocation to roots at eCO2 has been observed in many studies (Sage 1994; Anderson et al. 2010; Arndal et al. 2014, 2018), but this generally does not occur to the extent that aboveground growth is reduced. Further, shoot growth rate was high in all treatments, with annual herbage yield being well over 20 t ha−1 in all plots, which is comparable to local production in optimal conditions (Rawnsley et al. 2014).
The reduced allocation to aboveground growth was unlikely to have been driven by P availability (Conroy et al. 1992) because the experiment was supplied with more than adequate P fertiliser (Rawnsley et al. 2014). Soil tests at the experimental site prior to establishment indicated that nutrients other than N and P were sufficient to support substantial growth, so it is unlikely that the results were due to any form of micronutrient deficiency.
Rather, it appears that the eCO2-derived suppression of aboveground biomass production was due to a fundamental relationship between soil water content and aboveground growth and eCO2 effects on soil water content. In autumn, winter and summer, aboveground growth at TasFACE2 tended to reduce as soil water content increased, probably because of increased allocation belowground. Thus, increases in soil water content driven by eCO2 would lead to reductions in aboveground growth. Further, eCO2 increased the sensitivity of aboveground biomass production to soil water content during summer, meaning that eCO2 reduced aboveground biomass production independent of treatment effects on soil water content.
It is unclear why eCO2 led to the reduction in shoot growth in this experiment. It is possible that eCO2-induced alteration of shoot morphology drove the shoot growth response (Brinkhoff et al. 2019), possibly due to an increase in self-shading associated with the eCO2-driven increase in tiller branching. Many long-term eCO2 experiments in herbaceous vegetation have found that eCO2 suppresses aboveground growth in particular years (Larsen et al. 2011; Hovenden et al. 2014; Andresen et al. 2018), including in sites with high productivity. Factors such as insufficient N supply and water deficit can prevent eCO2 from stimulating biomass production (Reich et al. 2014), and eCO2-driven reductions in soil N availability (Luo et al. 2004; Hovenden et al. 2008, 2017; Newton et al. 2010) could potentially lead to suppression of growth. Altering the seasonal water supply at TasFACE2 did change seasonal aboveground production, but this response was not influenced by [CO2]. Thus, eCO2 suppressed aboveground biomass production in the TasFACE2 experiment irrespective of water supply. The mechanisms leading to the reductions in shoot growth are still unknown and must surely be a matter of future research concentration, particularly as this could lead to a diminution of some of the supposed benefits from the rising [CO2] (Hovenden and Newton 2018).
The pasture at TasFACE2 had only been established for 2 years by the end of the study period, so it is possible that experimental results from a long-established pasture would differ. Although the sward appeared fully developed, the root systems might still have been establishing 2 years after sowing. Thus, the preferential allocation of biomass to the roots, which was increased by eCO2, might not be as pronounced in long-established pastures (Luscher et al. 2000). However, high-input pastures are regularly re-sown, at approximately 10-year intervals in intensively-managed sites, to introduce newly released varieties, to manage species composition or invigorate productivity or as part of rotational practices, so the results presented here are relevant to the grazing industry. Moreover, longer-term experiments in similar ecosystems (Lüscher et al. 1997; Obermeier et al. 2017; Andresen et al. 2018) do not show substantial changes in eCO2 effects after the initial years, so it is possible that the results shown here would persist over the longer term. It is also possible that the restriction in irrigation applied in this experiment was not sufficient to cause marked water stress. Greater restriction of irrigation might have contributed to a greater impact of eCO2 on biomass production, as benefits from eCO2-derived water savings would only be likely to occur at lower soil water contents.
The climatic conditions during the experiment did not deviate greatly from long-term means (Table S1), although the impact of climate change is evident in the slightly warmer conditions (+0.6°C at night and +0.8°C in the day) during the study period than the average from the previous 30 years. Therefore, it is unlikely that climatic peculiarities drove the patterns observed. The substantial site works involved in establishing the experiment could have caused some degree of soil compaction and this might have influenced soil hydraulic conductivity and root growth patterns compared to a less-disturbed site. However, intensively-managed pastures tend to have high levels of traffic from stock and vehicles, so potential alterations of soil bulk density caused by the establishment of the experiment would not be as extreme as might be the case in a less intensively-managed ecosystem. Finally, the rainfall exclosures themselves caused some shading, potentially reducing leaf temperature as well as light exposure. All experimental plots had the same infrastructure, but it is possible that the light exposure varied among sub-plots within each plot. The randomisation of irrigation treatments among the sub-plots should have prevented any confounding effects but it is possible that some degree of difference in light exposure among the replicate sub-plots could have obscured the effects of irrigation. However, the fact that the site is on a gently north-facing (i.e. sunward) slope in a region with naturally high insolation, means that the implications of shading are likely to be minor.
The linear relationship between [CO2] and total biomass production in sectors supplied with adequate irrigation in all seasons indicates both that the experiment was operating effectively and that the direct stimulation of photosynthesis by eCO2 was as expected. Few other studies have investigated grassland biomass production along a [CO2] gradient (Johnson et al. 1993; Anderson et al. 2001; Fay et al. 2015; Polley et al. 2019). Our results show that underlying relationships between biomass production rates and soil water content can influence the outcome of eCO2 treatments on root and shoot growth, and provide strong evidence that these relationships vary seasonally. Our analyses allowed us to compare biomass production rates at a common soil water content, thus separating the influence on growth of eCO2-driven differences in soil water content from more direct eCO2 influences. Disentangling the exact mechanisms leading to the strongly disparate and seasonal relationships between eCO2, soil water content and above- versus belowground growth will improve our ability to predict future agricultural production and carbon cycle responses to the rising [CO2].
Data availability
The data supporting the findings of this study are openly available via the University of Tasmania Research Data Portal (https://rdp.utas.edu.au).
Declaration of funding
This research was supported by the Australian Research Council Discovery Projects Scheme grant numbers DP150102426 and DP190102025.
Author contributions
MJH and RPR designed the study. REB, MP and AF maintained the experiment and ALS, REB, KS, ZAB, MP, AF, MN and MJH collected the data. MJH, ALS and ZAB analysed the data and all authors contributed to interpretation of the results. MJH, ALS and RPR wrote the manuscript with assistance from all authors. All authors gave their final approval for publication.
Acknowledgements
We thank David Squibb from PGG Wrightson seeds for supplying the Base AR37 seeds and Ronald and Chris Gunn for their assistance in establishing the TasFACE2 site. Michael Oates helped to establish the experimental infrastructure.
References
Ackerly DD, Bazzaz FA (1995) Plant growth and reproduction along CO2 gradients: non-linear responses and implications for community change. Global Change Biology 1, 199-207.
| Crossref | Google Scholar |
Ainsworth EA, Long SP (2005) What have we learned from 15 years of free-air CO2 enrichment (FACE)? A meta-analytic review of the responses of photosynthesis, canopy properties and plant production to rising CO2. New Phytologist 165, 351-372.
| Crossref | Google Scholar | PubMed |
Ainsworth EA, Davey PA, Hymus GJ, Osborne CP, Rogers A, Blum H, Nösberger J, Long SP (2003) Is stimulation of leaf photosynthesis by elevated carbon dioxide concentration maintained in the long term? A test with Lolium perenne grown for 10 years at two nitrogen fertilization levels under Free Air CO2 Enrichment (FACE). Plant, Cell & Environment 26, 705-714.
| Crossref | Google Scholar |
Anderson LJ, Maherali H, Johnson HB, Polley HW, Jackson RB (2001) Gas exchange and photosynthetic acclimation over subambient to elevated CO2 in a C3–C4 grassland. Global Change Biology 7, 693-707.
| Crossref | Google Scholar |
Anderson LJ, Derner JD, Polley HW, Gordon WS, Eissenstat DM, Jackson RB (2010) Root responses along a subambient to elevated CO2 gradient in a C3–C4 grassland. Global Change Biology 16, 454-468.
| Crossref | Google Scholar |
Andresen LC, Yuan N, Seibert R, Moser G, Kammann CI, Luterbacher J, Erbs M, Muller C (2018) Biomass responses in a temperate European grassland through 17 years of elevated CO2. Global Change Biology 24, 3875-3885.
| Crossref | Google Scholar | PubMed |
Arndal MF, Schmidt IK, Kongstad J, Beier C, Michelsen A (2014) Root growth and N dynamics in response to multi-year experimental warming, summer drought and elevated CO2 in a mixed heathland-grass ecosystem. Functional Plant Biology 41, 1-10.
| Crossref | Google Scholar |
Arndal MF, Tolver A, Larsen KS, Beier C, Schmidt IK (2018) Fine root growth and vertical distribution in response to elevated CO2, warming and drought in a mixed heathland-grassland. Ecosystems 21, 15-30.
| Crossref | Google Scholar |
Arnone JA, Zaller JG, Spehn EM, Niklaus PA, Wells CE, Korner C (2000) Dynamics of root systems in native grasslands: effects of elevated atmospheric CO2. New Phytologist 147, 73-85.
| Crossref | Google Scholar |
Bates D, Mächler M, Bolker B, Walker S (2015) Fitting linear mixed-effects models using lme4. Journal of Statistical Software 67, 1-48.
| Crossref | Google Scholar |
Bernacchi CJ, VanLoocke A (2015) Terrestrial ecosystems in a changing environment: a dominant role for water. Annual Review of Plant Biology 66, 599-622.
| Crossref | Google Scholar | PubMed |
Borken W, Matzner E (2009) Reappraisal of drying and wetting effects on C and N mineralization and fluxes in soils. Global Change Biology 15, 808-824.
| Crossref | Google Scholar |
Brinkhoff R, Porter M, Hovenden MJ (2019) Elevated CO2 causes large changes to morphology of perennial ryegrass (Lolium perenne). Crop & Pasture Science 70, 555-565.
| Crossref | Google Scholar |
Canadell JG, Pitelka LF, Ingram JSI (1995) The effects of elevated [CO2] on plant-soil carbon below-ground: a summary and synthesis. Plant and Soil 187, 391-400.
| Crossref | Google Scholar |
Carol Adair E, Reich PB, Hobbie SE, Knops JMH (2009) Interactive effects of time, CO2, N, and diversity on total belowground carbon allocation and ecosystem carbon storage in a grassland community. Ecosystems 12, 1037-1052.
| Crossref | Google Scholar |
Conroy JP, Milham PJ, Barlow EWR (1992) Effect of nitrogen and phosphorus availability on the growth response of Eucalyptus grandis to high CO2. Plant, Cell & Environment 15, 843-847.
| Crossref | Google Scholar |
Cullen BR, Eckard RJ, Callow MN, Johnson IR, Chapman DF, Rawnsley RP, Garcia SC, White T, Snow VO (2008) Simulating pasture growth rates in Australian and New Zealand grazing systems. Australian Journal of Agricultural Research 59, 761-768.
| Crossref | Google Scholar |
De Kauwe MG, Medlyn BE, Zaehle S, Walker AP, Dietze MC, Hickler T, Jain AK, Luo Y, Parton WJ, Prentice IC, Smith B, Thornton PE, Wang S, Wang Y-P, Warlind D, Weng E, Crous KY, Ellsworth DS, Hanson PJ, Seok Kim H, Warren JM, Oren R, Norby RJ (2013) Forest water use and water use efficiency at elevated CO2: a model-data intercomparison at two contrasting temperate forest FACE sites. Global Change Biology 19, 1759-1779.
| Crossref | Google Scholar | PubMed |
De Kauwe MG, Medlyn BE, Zaehle S, Walker AP, Dietze MC, Wang Y-P, Luo Y, Jain AK, El-Masri B, Hickler T, Warlind D, Weng E, Parton WJ, Thornton PE, Wang S, Prentice IC, Asao S, Smith B, McCarthy HR, Iversen CM, Hanson PJ, Warren JM, Oren R, Norby RJ (2014) Where does the carbon go? A model-data intercomparison of vegetation carbon allocation and turnover processes at two temperate forest free-air CO2 enrichment sites. New Phytologist 203, 883-899.
| Crossref | Google Scholar | PubMed |
De Kauwe MG, Medlyn BE, Walker AP, Zaehle S, Asao S, Guenet B, Harper AB, Hickler T, Jain AK, Luo Y, Lu X, Luus K, Parton WJ, Shu S, Wang Y-P, Werner C, Xia J, Pendall E, Morgan JA, Ryan EM, Carrillo Y, Dijkstra FA, Zelikova TJ, Norby RJ (2017) Challenging terrestrial biosphere models with data from the long-term multifactor Prairie heating and CO2 enrichment experiment. Global Change Biology 23, 3623-3645.
| Crossref | Google Scholar | PubMed |
Drake BG, Gonzàlez-Meler MA, Long SP (1997) More efficient plants: a consequence of rising atmospheric CO2? Annual Review of Plant Physiology and Plant Molecular Biology 48, 609-639.
| Crossref | Google Scholar | PubMed |
Farquhar GD (1997) Carbon dioxide and vegetation. Science 278, 1411.
| Crossref | Google Scholar |
Fatichi S, Leuzinger S, Paschalis A, Langley JA, Barraclough AD, Hovenden MJ (2016) Partitioning direct and indirect effects reveals the response of water-limited ecosystems to elevated CO2. Proceedings of the National Academy of Sciences of the United States of America 113, 12757-12762.
| Crossref | Google Scholar |
Fay PA, Newingham BA, Polley HW, Morgan JA, LeCain DR, Nowak RS, Smith SD (2015) Dominant plant taxa predict plant productivity responses to CO2 enrichment across precipitation and soil gradients. AoB Plants 7, plv027.
| Crossref | Google Scholar |
Gifford RM (1979) Growth and yield of CO2-enriched wheat under water-limited conditions. Australian Journal of Plant Physiology 6, 367-378.
| Google Scholar |
Gill RA, Polley HW, Johnson HB, Anderson LJ, Maherali H, Jackson RB (2002) Nonlinear grassland responses to past and future atmospheric CO2. Nature 417, 279-282.
| Crossref | Google Scholar | PubMed |
Gray SB, Dermody O, Klein SP, Locke AM, McGrath JM, Paul RE, Rosenthal DM, Ruiz-Vera UM, Siebers MH, Strellner R, Ainsworth EA, Bernacchi CJ, Long SP, Ort DR, Leakey ADB (2016) Intensifying drought eliminates the expected benefits of elevated carbon dioxide for soybean. Nature Plants 2, 16132.
| Crossref | Google Scholar | PubMed |
Hovenden MJ, Newton PCD (2018) Variability in precipitation seasonality limits grassland biomass responses to rising CO2: historical and projected climate analyses. Climatic Change 149, 219-231.
| Crossref | Google Scholar |
Hovenden MJ, Miglietta F, Zaldei A, Vander Schoor JK, Wills KE, Newton PCD (2006) The TasFACE climate-change impacts experiment: design and performance of combined elevated CO2 and temperature enhancement in a native Tasmanian grassland. Australian Journal of Botany 54, 1-10.
| Crossref | Google Scholar |
Hovenden MJ, Newton PCD, Carran RA, Theobald P, Wills KE, Vander Schoor JK, Williams AL, Osanai Y (2008) Warming prevents the elevated CO2-induced reduction in available soil nitrogen in a temperate, perennial grassland. Global Change Biology 14, 1018-1024.
| Crossref | Google Scholar |
Hovenden MJ, Newton PCD, Wills KE (2014) Seasonal not annual rainfall determines grassland biomass response to carbon dioxide. Nature 511, 583-586.
| Crossref | Google Scholar | PubMed |
Hovenden MJ, Newton PCD, Osanai Y (2017) Warming has a larger and more persistent effect than elevated CO2 on growing season soil nitrogen availability in a species-rich grassland. Plant and Soil 421, 417-428.
| Crossref | Google Scholar |
Hovenden MJ, Leuzinger S, Newton PCD, Fletcher A, Fatichi S, Lüscher A, Reich PB, Andresen LC, Beier C, Blumenthal DM, Chiariello NR, Dukes JS, Kellner J, Hofmockel K, Niklaus PA, Song J, Wan S, Classen AT, Langley JA (2019) Globally consistent influences of seasonal precipitation limit grassland biomass response to elevated CO2. Nature Plants 5, 167-173.
| Crossref | Google Scholar | PubMed |
Hussain MZ, VanLoocke A, Siebers MH, Ruiz-Vera UM, Cody Markelz RJ, Leakey ADB, Ort DR, Bernacchi CJ (2013) Future carbon dioxide concentration decreases canopy evapotranspiration and soil water depletion by field-grown maize. Global Change Biology 19, 1572-1584.
| Crossref | Google Scholar | PubMed |
Johnson HB, Polley HW, Mayeux HS (1993) Increasing CO2 and plant-plant interactions: effects on natural vegetation. Vegetatio 104/105, 157-170.
| Google Scholar |
Johnson IR, Chapman DF, Snow VO, Eckard RJ, Parsons AJ, Lambert MG, Cullen BR (2008) DairyMod and EcoMod: biophysical pasture-simulation models for Australia and New Zealand. Australian Journal of Experimental Agriculture 48, 621-631.
| Crossref | Google Scholar |
Kellner J, Houska T, Manderscheid R, Weigel H-J, Breuer L, Kraft P (2019) Response of maize biomass and soil water fluxes on elevated CO2 and drought—from field experiments to process-based simulations. Global Change Biology 25, 2947-2957.
| Crossref | Google Scholar | PubMed |
Knapp AK, Briggs JM, Koelliker JK (2001) Frequency and extent of water limitation to primary production in a mesic temperate grassland. Ecosystems 4, 19-28.
| Crossref | Google Scholar |
Larsen KS, Andresen LC, Beier C, Jonasson S, Albert KR, Ambus P, Arndal MF, Carter MS, Christensen S, Holmstrup M, Ibrom A, Kongstad J, Van Der Linden L, Maraldo K, Michelsen A, Mikkelsen TN, Pilegaard K, Priemé A, Ro-Poulsen H, Schmidt IK, Selsted MB, Stevnbak K (2011) Reduced N cycling in response to elevated CO2, warming, and drought in a Danish heathland: synthesizing results of the CLIMAITE project after two years of treatments. Global Change Biology 17, 1884-1899.
| Crossref | Google Scholar |
Lee M, Manning P, Rist J, Power SA, Marsh C (2010) A global comparison of grassland biomass responses to CO2 and nitrogen enrichment. Philosophical Transactions of the Royal Society B: Biological Sciences 365, 2047-2056.
| Crossref | Google Scholar |
Lenth RV (2022) emmeans: estimated marginal means aka least-squares means.(R package version 1.8.7) Available at https://CRAN.R-project.org/package=emmeans
Long SP (1991) Modification of the response of photosynthetic productivity to rising temperature by atmospheric CO2 concentrations: has its importance been underestimated? Plant, Cell and Environment 14, 729-739.
| Crossref | Google Scholar |
Long SP, Ainsworth EA, Rogers A, Ort DR (2004) Rising atmospheric carbon dioxide: plants FACE the future. Annual Review of Plant Biology 55, 591-628.
| Crossref | Google Scholar | PubMed |
Luo Y, Su B, Currie WS, Dukes JS, Finzi A, Hartwig U, Hungate B, McMurtrie RE, Oren R, Parton WJ, Pataki DE, Shaw MR, Zak DR, Field CB (2004) Progressive nitrogen limitation of ecosystem responses to rising atmospheric carbon dioxide. BioScience 54, 731-739.
| Crossref | Google Scholar |
Lüscher A, Hendrey GR, Nösberger J (1997) Long-term responsiveness to free air CO2 enrichment of functional types, species and genotypes of plants from fertile permanent grassland. Oecologia 113, 37-45.
| Crossref | Google Scholar |
Luscher A, Hartwig UA, Suter D, Nosberger J (2000) Direct evidence that symbiotic N2 fixation in fertile grassland is an important trait for a strong response of plants to elevated atmospheric CO2. Global Change Biology 6, 655-662.
| Crossref | Google Scholar |
Madhu M, Hatfield JL (2013) Dynamics of plant root growth under increased atmospheric carbon dioxide. Agronomy Journal 105, 657-669.
| Crossref | Google Scholar |
McMurtrie RE, Norby RJ, Medlyn BE, Dewar RC, Pepper DA, Reich PB, Barton CVM (2008) Why is plant-growth response to elevated CO2 amplified when water is limiting, but reduced when nitrogen is limiting? A growth-optimisation hypothesis. Functional Plant Biology 35, 521-534.
| Crossref | Google Scholar | PubMed |
Medlyn BE, Zaehle S, De Kauwe MG, Walker AP, Dietze MC, Hanson PJ, Hickler T, Jain AK, Luo Y, Parton W, Prentice IC, Thornton PE, Wang S, Wang Y-P, Weng E, Iversen CM, McCarthy HR, Warren JM, Oren R, Norby RJ (2015) Using ecosystem experiments to improve vegetation models. Nature Climate Change 5, 528-534.
| Crossref | Google Scholar |
Morgan JA, Pataki DE, Körner C, Clark H, Del Grosso SJ, Grünzweig JM, Knapp AK, Mosier AR, Newton PCD, Niklaus PA, Nippert JB, Nowak RS, Parton WJ, Polley HW, Shaw MR (2004) Water relations in grassland and desert ecosystems exposed to elevated atmospheric CO2. Oecologia 140, 11-25.
| Crossref | Google Scholar | PubMed |
Morgan JA, LeCain DR, Pendall E, Blumenthal DM, Kimball BA, Carrillo Y, Williams DG, Heisler-White J, Dijkstra FA, West M (2011) C4 grasses prosper as carbon dioxide eliminates desiccation in warmed semi-arid grassland. Nature 476, 202-205.
| Crossref | Google Scholar | PubMed |
Newton PCD, Lieffering M, Bowatte WMSD, Brock SC, Hunt CL, Theobald PW, Ross DJ (2010) The rate of progression and stability of progressive nitrogen limitation at elevated atmospheric CO2 in a grazed grassland over 11 years of free air CO2 enrichment. Plant and Soil 336, 433-441.
| Crossref | Google Scholar |
Norby RJ, Zak DR (2011) Ecological lessons from Free-Air CO2 Enrichment (FACE) experiments. Annual Review of Ecology, Evolution, and Systematics 42, 181-203.
| Crossref | Google Scholar |
Obermeier WA, Lehnert LW, Kammann CI, Müller C, Grünhage L, Luterbacher J, Erbs M, Moser G, Seibert R, Yuan N, Bendix J (2017) Reduced CO2 fertilization effect in temperate C3 grasslands under more extreme weather conditions. Nature Climate Change 7, 137-141.
| Crossref | Google Scholar |
Owensby CE, Coyne PI, Ham JM, Auen LM, Knapp AK (1993) Biomass production in a tallgrass prairie ecosystem exposed to ambient and elevated CO2. Ecological Applications 3, 644-653.
| Crossref | Google Scholar | PubMed |
Perring MP, Cullen BR, Johnson IR, Hovenden MJ (2010) Modelled effects of rising CO2 concentration and climate change on native perennial grass and sown grass-legume pastures. Climate Research 42, 65-78.
| Crossref | Google Scholar |
Pineiro J, Ochoa-Hueso R, Delgado-Baquerizo M, Dobrick S, Reich PB, Pendall E, Power SA (2017) Effects of elevated CO2 on fine root biomass are reduced by aridity but enhanced by soil nitrogen: a global assessment. Scientific Reports 7, 15355.
| Crossref | Google Scholar |
Polley HW, Aspinwall MJ, Collins HP, Gibson AE, Gill RA, Jackson RB, Jin VL, Khasanova AR, Reichmann LG, Fay PA (2019) CO2 enrichment and soil type additively regulate grassland productivity. New Phytologist 222, 183-192.
| Crossref | Google Scholar | PubMed |
Rawnsley RP, Langworthy AD, Pembleton KG, Turner LR, Corkrey R, Donaghy DJ (2014) Quantifying the interactions between grazing interval, grazing intensity, and nitrogen on the yield and growth rate of dryland and irrigated perennial ryegrass. Crop & Pasture Science 65, 735-746.
| Crossref | Google Scholar |
Reich PB, Hungate BA, Luo Y (2006a) Carbon-nitrogen interactions in terrestrial ecosystems in response to rising atmospheric carbon dioxide. Annual Review of Ecology Evolution, and Systematics 37, 611-636.
| Crossref | Google Scholar |
Reich PB, Hobbie SE, Lee T, Ellsworth DS, West JB, Tilman D, Knops JMH, Naeem S, Trost J (2006b) Nitrogen limitation constrains sustainability of ecosystem response to CO2. Nature 440, 922-925.
| Crossref | Google Scholar | PubMed |
Reich PB, Hobbie SE, Lee TD (2014) Plant growth enhancement by elevated CO2 eliminated by joint water and nitrogen limitation. Nature Geoscience 7, 920-924.
| Crossref | Google Scholar |
Robin AHK, Irving LJ, Khaembah EN, Matthew C (2018) Modelling carbon fluxes as an aid to understanding perennial ryegrass (Lolium perenne) root dynamics. Agronomy 8, 236.
| Crossref | Google Scholar |
Ryan EM, Ogle K, Peltier D, Walker AP, De Kauwe MG, Medlyn BE, Williams DG, Parton W, Asao S, Guenet B, Harper AB, Lu X, Luus KA, Zaehle S, Shu S, Werner C, Xia J, Pendall E (2017) Gross primary production responses to warming, elevated CO2, and irrigation: quantifying the drivers of ecosystem physiology in a semiarid grassland. Global Change Biology 23, 3092-3106.
| Crossref | Google Scholar | PubMed |
Sage RF (1994) Acclimation of photosynthesis to increasing atmospheric CO2: the gas exchange perspective. Photosynthesis Research 39, 351-368.
| Crossref | Google Scholar | PubMed |
Song J, Wan S, Piao S, Hui D, Hovenden MJ, Ciais P, Liu Y, Liu Y, Zhong M, Zheng M, Ma G, Zhou Z, Ru J (2019) Elevated CO2 does not stimulate carbon sink in a semi-arid grassland. Ecology Letters 22, 458-468.
| Crossref | Google Scholar | PubMed |
von Caemmerer S, Farquhar GD (1981) Some relationships between the biochemistry of photosynthesis and the gas exchange of leaves. Planta 153, 376-387.
| Crossref | Google Scholar | PubMed |
Zaehle S, Medlyn BE, De Kauwe MG, Walker AP, Dietze MC, Hickler T, Luo Y, Wang Y-P, El-Masri B, Thornton P, Jain A, Wang S, Warlind D, Weng E, Parton W, Iversen CM, Gallet-Budynek A, McCarthy H, Finzi A, Hanson PJ, Prentice IC, Oren R, Norby RJ (2014) Evaluation of 11 terrestrial carbon-nitrogen cycle models against observations from two temperate free-air CO2 enrichment studies. New Phytologist 202, 803-822.
| Crossref | Google Scholar | PubMed |
Zhou X, Weng E, Luo Y (2008) Modeling patterns of nonlinearity in ecosystem responses to temperature, CO2, and precipitation changes. Ecological Applications 18, 453-466.
| Crossref | Google Scholar | PubMed |
Zhu K, Chiariello NR, Tobeck T, Fukami T, Field CB (2016) Nonlinear, interacting responses to climate limit grassland production under global change. Proceedings of the National Academy of Sciences 113, 10589-10594.
| Crossref | Google Scholar |