

Utilisation of unmanned aerial vehicle imagery to assess growth parameters in mungbean (Vigna radiata (L.) Wilczek)
Yiyi Xiong A , Lucas Mauro Rogerio Chiau A B , Kylie Wenham C , Marisa Collins A C D and Scott C. Chapman A *
A
B
C
D
Abstract
Unmanned aerial vehicles (UAV) with red–green–blue (RGB) cameras are increasingly used as a monitoring tool in farming systems. This is the first field study in mungbean (Vigna radiata (L.) Wilzcek) using UAV and image analysis across multiple seasons.
This study aims to validate the use of UAV imagery to assess growth parameters (biomass, leaf area, fractional light interception and radiation use efficiency) in mungbean across multiple seasons.
Field experiments were conducted in summer 2018/19 and spring–summer 2019/20 for three sowing dates. Growth parameters were collected fortnightly to match UAV flights throughout crop development. Fractional vegetation cover (FVC) and computed vegetation indices: colour index of vegetation extraction (CIVE), green leaf index (GLI), excess green index (ExG), normalised green-red difference index (NGRDI) and visible atmospherically resistant index (VARI) were generated from UAV orthomosaic images.
(1) Mungbean biomass can be accurately estimated at the pre-flowering stage using RGB imagery acquired with UAVs; (2) a more accurate relationship between the UAV-based RGB imagery and ground data was observed during pre-flowering compared to post-flowering stages in mungbean; (3) FVC strongly correlated with biomass (R2 = 0.79) during the pre-flowering stage; NGRDI (R2 = 0.86) showed a better ability to directly predict biomass across the three experiments in the pre-flowering stages.
UAV-based RGB imagery is a promising technology to replace manual light interception measurements and predict biomass, particularly at earlier growth stages of mungbean.
These findings can assist researchers in evaluating agronomic strategies and considering the necessary management practices for different seasonal conditions.
Keywords: biomass, fractional light interception, ground truth data, growth parameters, leaf area, mungbean physiology, radiation use efficiency, RGB images and vegetation indices.
Introduction
Mungbean (Vigna radiata (L.) Wilczek) is a summer crop grown in sub-tropical farming systems in Australia as a summer rotation crop. Mungbean has a short crop cycle, is relatively drought tolerant, improves soil fertility and can be used as a break crop for pest and disease control. Mungbean is also considered a high-value crop by Australian growers due to demand from international markets (Noble 2017; Chauhan and Williams 2018).
Crop growth is studied by measuring leaf area, biomass, light interception and ground cover assessment. Measures of effective leaf area are crucial to estimating plant growth and biomass, evaluating competition between crops and weeds, and examining water exchanges in the plant–soil–atmosphere continuum (Khan and Khalil 2010). Biomass and leaf area monitoring are regarded as necessary in precision agriculture optimising agronomic practices and identifying pest damage in crops (Ballesteros et al. 2018). Biomass is an indicator of crop growth strongly associated with solar energy utilisation, yield and grain quality (Yue et al. 2017). Accurately measuring biomass and leaf area can help farmers determine the most efficient use of resources such as water, fertilisers and pesticides, leading to improved crop yields and reduced environmental impact.
Biomass is the product of the accumulated solar energy absorption over time and the average efficiency of transformation of intercepted energy into new biomass (Monteith 1977). Solar energy interception, or fractional light interception, is the light intercepted by the crop canopy. Radiation (light) levels have a direct impact on crop photosynthesis, mass accumulation and crop growth (Sinclair and Muchow 1999). The proportion of radiation not intercepted can be measured by an under-canopy light meter and allows computation of radiation captured (i.e. difference compared to incoming radiation) and the canopy radiation use efficiency (RUE), which is a fundamental parameter of crop growth response to accumulated radiation (Monteith 1977).
Understanding the dynamics of leaf area, biomass and fractional light interception is essential for predicting crop yield under various management systems. By analysing these parameters, it is possible to identify the impacts of critical environmental conditions during stages of yield determination, which can result from different sowing dates from spring to summer or changes in water availability (Li et al. 2014). Additionally, time of sowing can influence the risk of exposure to biotic pressure and consequent yield loss (Sadeghipour 2008). For mungbean in Australia, there are two recommended sowing periods: summer (typically around December/January) and spring (September–November). By carefully considering the optimal sowing date and environmental conditions, farmers can optimise crop growth and yield relative to the risk of heat events, reduce the risk of pests and diseases, and increase the overall sustainability of their farming operations.
Unmanned aerial vehicle (UAV) techniques are considered a feasible approach to crop monitoring with many benefits, including greater flexibility, faster data collection and higher resolution imaging in comparison to traditional methods such as manual field sampling. Consumer-level drones equipped with red, green and blue (RGB) cameras offer many advantages as an affordable remote-sensing tool for small-scale research projects. These advantages include quicker data delivery to the users, the ability to fly at low altitudes, acquisition of high spatial resolution images at low operational cost and the opportunity for analysing the data in near real time (Chapman et al. 2014; Gago et al. 2015; Mahajan and Raj 2016). RGB camera-equipped drones are demonstrably cost-effective for studying the influence of abiotic and biotic stresses, analysis of plant growth and crop senescence (Casadesús et al. 2007).
UAVs have been increasingly applied as useful monitoring tools in crop systems. Researchers have utilised UAV imagery with RGB cameras to assess crop growth and development parameters in multiple crops, including wheat (Du and Noguchi 2017), corn (García-Martínez et al. 2020) and sugarcane (Du and Noguchi 2017; Lu et al. 2021; Sumesh et al. 2021). Previous scientific publications have employed RGB imaging techniques to investigate various growth parameters of mungbean. For example, Mileva (2017) utilised both smartphones and UAVs to assess fractional vegetation cover in the field; and De Silva and Senanayake (2017) used smartphones to examine water stress. Abud et al. (2022) analysed seedling growth in a laboratory using only RGB imagery. Additionally, Rane et al. (2021) conducted research on biomass prediction under the influence of water stress in mungbean, utilising near-infrared (NIR) imaging techniques in a controlled glasshouse environment. These studies were carried out on a small scale and only within a single growing season.
Fractional vegetation cover (FVC) is a commonly used metric to estimate fractional light interception in vegetation. The FVC metric, which incorporates the impact of both radiation scattering within a canopy and the transmission of radiation through the leaves, can be accurately measured through UAV data (Duan et al. 2017). This parameter is a crucial metric for monitoring and modelling vegetation productivity, as well as for predicting final yield estimation (Jiapaer et al. 2011; Liu et al. 2012; Shafian et al. 2018). Field surveys and remote-sensing inversion are the two main methods for determining FVC (Nemani et al. 1996). FVC can be estimated through the use of remote-sensing technologies that rely on vegetation index methods, unmixed pixel models and regression models (Jia et al. 2015). These methods are commonly utilised for approximating FVC at large scales, such as for forests or grasslands. Vegetation indices and FVC have been applied in many studies, for instance, leaf cover mapping in cereals (Torres-Sánchez et al. 2015) and chlorophyll content (Hunt et al. 2013). These indices can be applied to assess changes in the fraction of light intercepted, leaf area index (LAI), biomass and photosynthesis by separating the spectral information from a living and non-living structure (Xue and Su 2017). FVC and vegetation indices are instrumental in proximal sensing, where they can be characterised for each plot in an experimental research trial.
This study aims to assess the potential use of UAVs mounted with affordable RGB cameras to determine crop growth parameters associated with radiation interception/utilisation and to predict mungbean biomass. Although there have been studies utilising UAV-RGB imagery to assess growth parameters in other crops, such as maize, wheat and soybean, to our knowledge, there have been limited studies on mungbean. Three different sowing dates across two seasons of irrigated field experiments were conducted. The research team collected data on leaf area, biomass and ground cover using intensive destructive methods, as well as data on vegetation indices and FVC using UAV imagery, allowing us to accurately and efficiently measure crucial indicators of crop growth and productivity. Additionally, the study also aimed to determine if the UAV results were comparable to light interception measurements obtained through traditional methods using a ceptometer. As biomass prediction for mungbean over multiple seasons in the field has not been widely explored, this may provide a method for determining paddock variability, early biomass estimation and the impact of management strategies across seasons.
Materials and methods
Study site and experimental design
Three experiments were conducted at the University of Queensland, Gatton Campus (27.55°S, 152.34°E), to establish mungbean crops with variable growth and biomass/yield dynamics. Weeds, pests and diseases were managed as required. Experiments were sown in January 2018, October and November 2019.
Experiment 1 was conducted from 16 January 2018 (sowing date) to 9 April 2018 on a 2-ha plot comprising five replicates of two mungbean genotypes (Jade-AU and Satin II). Additionally, a zinc (Zn) fertiliser was applied with seeds as a starter, at a rate of 20–30 kg/ha. This experiment was conducted under conditions of high-water availability with 100 mm of irrigation at sowing, and a further 50 mm of irrigation after emergence due to a high-temperature period. No additional water was applied after this as adequate rainfall of 263 mm occurred. Row spacing was 40 cm with six rows per pass.
Experiments 2 and 3 were respectively conducted from 22 October 2019 (sowing date) to 2 February 2020 and 28 November 2019 (sowing date) to March 2020. Two mungbean cultivars (Jade-AU and Crystal) were grown in four replicates under irrigated conditions. A Zn fertiliser was applied with seeds as a starter, at a rate of 20–30 kg/ha. Each plot size was 13 m long and 4.35 m wide. A total of 381.4 mm and 333.1 mm of irrigation were applied in Experiments 2 and 3 across the season. These two experiments were planted on 50-cm row spacing with eight rows per plot.
Data collection
Meteorological data, including maximum and minimum temperature, total rainfall, solar radiation and relative humidity, were obtained from a weather station for Experiment 1. The weather station was located at the University of Queensland in Gatton, which was 1 km north of the field experiment. The data was downloaded through the Bureau of Meteorology website. For Experiments 2 and 3, similar weather data were collected from a HOBO® RX3000 logger (HOBOlink®, Australia) weather station installed within the field trial area.
Four to six biomass harvests were taken in the experiments. In Experiment 1, four inner rows along a 1-m transect (1.2 m2) inside the plot area were sampled from 10 plots (two genotypes, five replicates). In Experiments 2 and 3, a sampling area of 1 m2 within three inner rows per plot was used to collect data across the experiments in eight plots (two genotypes and four replicates). Table 1 presents the dates for manual harvesting and UAV data collection at different growth stages for Experiments 1, 2 and 3. Growing degree days (GDD) were calculated based on the difference between the daily mean temperature and the base temperature (Arnold 1959), using a base temperature of 7.5°C (Robertson et al. 2002; Rachaputi et al. 2015; Chauhan and Williams 2018). When mungbean plants reached 50% flowering during all three experiments, the date of flowering was recorded.
| Flight/Sampling | UAV date | Cumulative GDD, UAV | Harvesting date | Cumulative GDD, Ground | Stage at harvest | ||
|---|---|---|---|---|---|---|---|
| Experiment 1 (UAV, 15 meters) | 1 | 21/11/2019 | 492 | 19/11/2019 | 450 | Mid vegetative | |
| 2 | 14/02/2018 | 516 | 14/02/2018 | 516 | End juvenile | ||
| 3 | 20/02/2018 | 636 | 20/02/2018 | 636 | Pre-anthesis | ||
| 4 | 9/03/2018 | 931 | 12/03/2018 | 975 | Start podding | ||
| 5 | 21/03/2018 | 1122 | 26/03/2018 | 1204 | Mid podding | ||
| 6 | 5/04/2018 | 1368 | 9/04/2018 | 1425 | End grain filling | ||
| Experiment 2 (UAV, 20 meters) | 1 | 21/11/2019 | 492 | 19/11/2019 | 450 | Mid vegetative | |
| 2 | 6/12/2019 | 785 | 3/12/2019 | 728 | End juvenile | ||
| 3 | 10/12/2019 | 868 | 17/12/2019 | 1020 | Start podding | ||
| 4 | 10/01/2020 | 1444 | 2/01/2020 | 1319 | Mid podding | ||
| 5 | 17/01/2020 | 1618 | 15/01/2020 | 1580 | Grain filling | ||
| 6 | 28/01/2020 | 1845 | 27/01/2020 | 1825 | End grain filling | ||
| Experiment 3 (UAV, 20 meters) | 1 | 10/01/2020 | 855 | 30/12/2019 | 628 | End vegetative | |
| 2 | 17/01/2020 | 989 | 13/01/2020 | 914 | Pod filling | ||
| 3 | 28/01/2020 | 1217 | 29/01/2020 | 1239 | Mid grain filling | ||
| 4 | 14/02/2020 | 1536 | 13/02/2020 | 1516 | End grain filling |
The total number of plants and leaf fresh weight of each sampling plot were recorded. The leaf area of each sample was obtained from a LI-3100C (LI-COR) leaf area meter. Subsequently, all leaves and stems were oven-dried for 6 days in paper bags at 65°C and their dry weights were recorded. From flowering onwards, leaves and stems, as well as reproductive organs (flowers, green and black pods), were split into components, weighed and dried separately. At the final harvest, pod counts and seed weight per plot were recorded.
Light interception measurements were collected using an AccuPAR LP-80 ceptometer (Meter Environment®, USA). Measurements prior to every biomass harvest in experiment plots were performed under the full sun between 11:00 hours and 13:00 hours in six different locations under the canopy with four measures of incoming radiation above. The locations were fixed per plot to calculate accumulated light intercepted as the same canopy structure expanded over time, corresponding to the biomass and leaf area measurements.
All the UAV images were collected to match with the ground truth data measurements undertaken in the vegetative and reproductive stages. Therefore, weekly or fortnightly flights were launched during the growing seasons at 15 m altitude in Experiment 1 and 20 m in Experiments 2 and 3 over the field trials. These flights were conducted under low wind speed conditions and clear sky from 11:00 hours to 14:00 hours. The UAV platform used to collect images was a DJI Phantom 4 Pro. This UAV has a 20 Megapixel RGB camera that captures light in the visible spectrum (400–700 nm) in red, green and blue wavebands. To ensure accurate geolocation of the images, at least four ground control points (GCPs) were placed in the field prior to capturing the first set of images. The GPS coordinates of these targets were obtained using a GPS survey kit (Aeropoints https://www.propelleraero.com/aeropoints/), which allowed for precise location determination of the trials. The reference of GCPs ensures accurate geolocation of the images.
Ground truth data pre-processing
Intercepted radiation (R) is calculated as:
where I is incident radiation (MJ/m2 per day) and f is fractional interception of incident light (De Costa et al. 1999). Hence, incident solar radiation (MJ/m2 per day) from the Bureau of Meteorology reference station and fractional light interception obtained from AccuPAR LP-80 Ceptometer were used to calculate intercepted radiation at each sampling time.
Using all replicates per genotype and all harvest samples, RUE was calculated as the average value of the above-ground biomass and cumulative intercepted radiation from sowing to anthesis before photosynthetic capacity decreased during the grain-filling stage (Monteith 1977).
Using all sampled LAI replicates and light interception across multiple harvests, the radiation extinction coefficient (k) calculation was based on the Beer–Lambert Law. Monsi and Saeki (1953) concluded the formula as below, derived from Beer and Lamberts’ law:
where I represents the intercepted radiation, I0 is the total incident light at the top canopy layer, f is the fractional light interception coefficient, k is a slope of the linear regression between −ln (1−f) and LAI (Steven et al. 1986; Hirose 2005).
Image data pre-processing
RGB image data were processed using the PhenoCopter tool (https://phenocopter.netlify.app/) and commercial software Pix4D (https://www.pix4d.com/) to produce orthomosaic images. We then applied plot segmentation, binary image classification and extraction of phenotype values: FVC and vegetation indices per plot for each UAV flight. Although PhenoCopter is no longer accessible, this pipeline can be replicated using Pix4D and GIS tools such as QGIS to create a matrix of plots to extract the data. Image classification is also available using EasyPCC (https://www.quantitative-plant.org/software/easypcc) directly (Guo et al. 2017).
The set of 80% overlapped images for these three experiments collected in each flight was imported directly to the PhenoCopter website to generate an orthomosaic image. The raw images were stitched together to develop the orthomosaic images for each flight in different mungbean growth stages, as shown as an example in Fig. 1a.
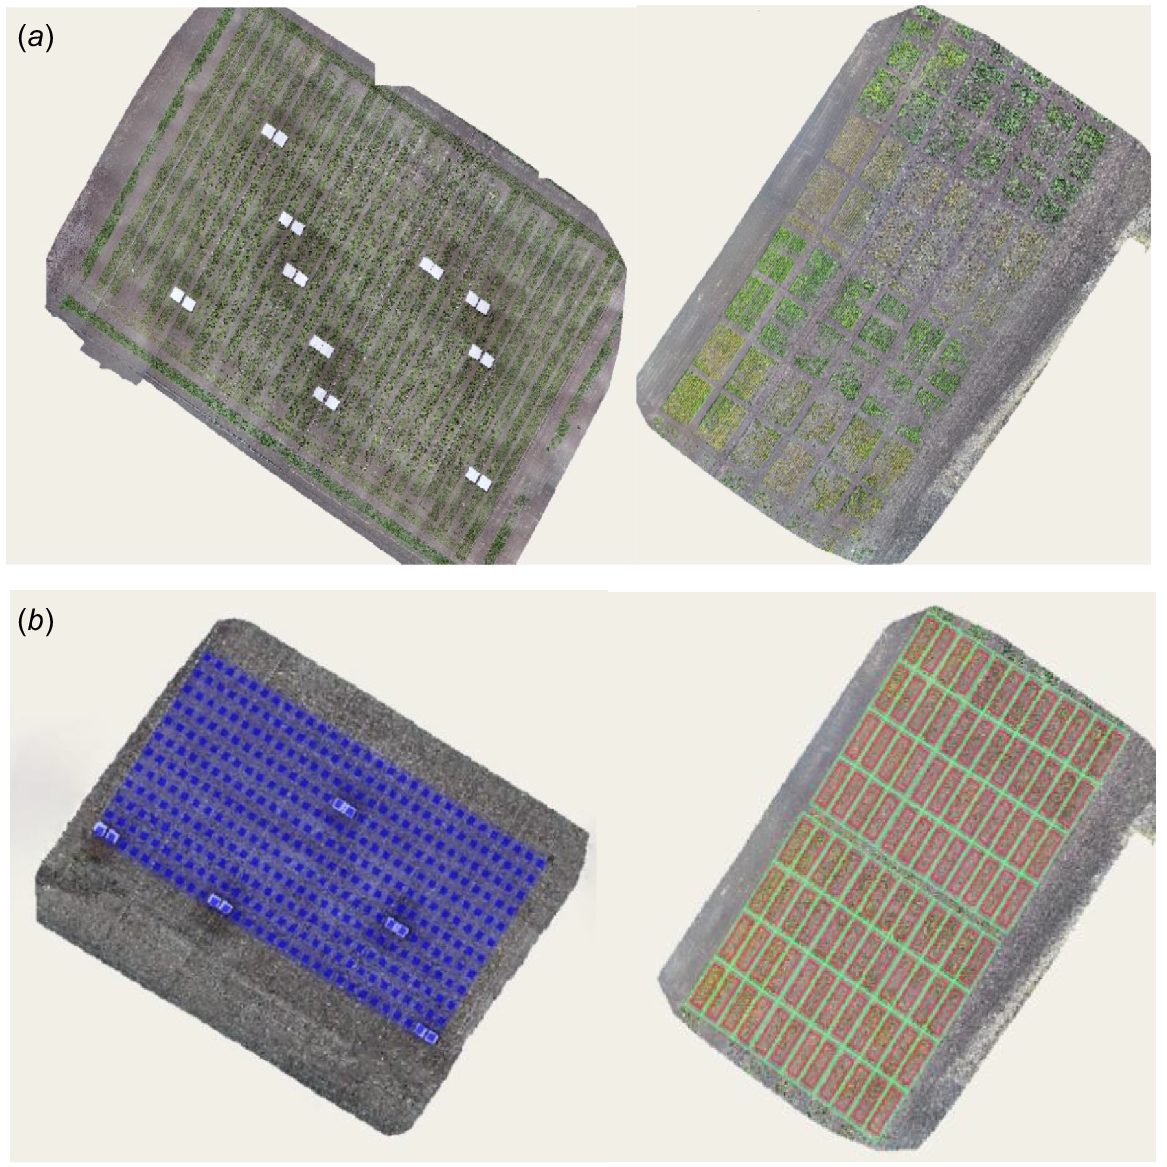
Mungbean fields were divided into small plots using the plot segmentation method, which involves drawing vector layers to separate the information from the orthomosaic images. This was done through the PhenoCopter website to align the orthomosaic images with the ground truth data collected per plot during the experiments. The whole field used for Experiment 1 was divided into 360 (12 × 30 = 360) plots (Fig. 1b). The total of 60 plots harvested for ground truth data was matched with UAV data. For Experiments 2 and 3, a total of 96 (12 × 8 = 96) plots were segmented, as shown in Fig. 1b, with only 16 plots assessed in Experiments 2 and 3.
An image classification procedure was undertaken using PhenoCopter website to differentiate the vegetation material from non-plant materials, including soil and mungbean shadows for each flight. Therefore, two distinct training datasets, one consisting of vegetation and the other non-plant materials, were generated for each flight to enable the PhenoCopter software to accurately extract phenotypic information, including FVC and vegetation indices. This method can be replicated using the methods of Guo et al. (2017).
FVC were calculated effectively from an orthomosaic image with hundreds of three-channel RGB images by separating and classifying vegetation pixels from soil pixels and other non-vegetation pixels (Guo et al. 2013; Sharma et al. 2015) as demonstrated by (Duan et al. 2017). FVC is the ratio of the vertical projected area of vegetation to the total ground area (Lin and Qi 2004). Torres-Sánchez et al. (2014) concluded an expression for high-resolution images per plot as below:
Vegetation indices, including CIVE, GLI, ExG, NGRDI and VARI, were calculated using the PhenoCopter tools based on the equations and references displayed in Table 2. Note that the PhenoCopter website is no longer functional, but these indices can be computed using Pix4D directly (as PhenoCopter used). In these equations, blue is the visible wavelength of 450–495 nm, green is the visible wavelength of 495–570 nm, and red is the visible wavelength of 625–750 nm (Bruno and Svoronos 2005). No adjustment was made of the RGB channels in the images from the Phantom 4 Pro camera, which have a wider wavelength of response.
| Name | Abbreviation | Equation | Reference | |
|---|---|---|---|---|
| Colour index of vegetation extraction | CIVE | 0.441 × Red − 0.881 × Green + 0.385 × Blue + 18.78745 | Kataoka et al. (2003) | |
| Excess green index | ExG | 2 × Green − Red – Blue | Woebbecke et al. (1995) | |
| Green leaf index | GLI | (2 × Green − Red − Blue)/(2 × Green + Red + Blue) | Louhaichi et al. (2001) | |
| Normalised green-red difference index | NGRDI | (Green − Red)/(Green + Red) | Gitelson et al. (2002) | |
| Visible atmospherically resistant index | VARI | (Green − Red)/(Green + Red − Blue) | Gitelson et al. (2002) |
Data analysis
Customised Python code scripts (Python ver. 3.10.9) were used to analyse the UAV and ground truth data. A two-sample t-test at a 5% significance level was calculated to compare the performance of the varieties for each experiment at the observation date. A test for homogeneity of variances and normality of residues was performed to validate these analyses. In addition, to validate the use of UAV imagery from RGB cameras, regression analysis and Pearson correlation tests were used to compare ground data (biomass, leaf area and fractional light interception) and UAV imagery (vegetation indices and FVC) for the three mungbean cultivars and each sowing period. After preliminary analysis showed no cultivar and seasonal differences, the data from three cultivars from three experiments were combined to represent the mungbean features to analyse the relationship between UAV imagery and ground data during pre- and post-flowering stages. The UAV analysis grouped the data into two different subgroups (pre-flowering and post-flowering) based on the flowering dates across the three experiments.
For Experiment 1, only three UAV flights (1, 2 and 3) were used to match with three sets of field sampling from the same period due to technical issues and data losses of the later three flights. However, these three early flights were sufficient to perform the correlation analysis between field data and UAV imagery and predict biomass at the pre-flowering stage. As a result, UAV data collected in Flights 1, 2 and 3 in Experiment 1 and Flights 1 and 2 in Experiment 2 (Table 1) was considered pre-flowering data. UAV data from Flights 5 and 6 in Experiment 2 and Flights 2, 3 and 4 in Experiment 3 were considered post-flowering data. Other flights in Experiments 2 and 3 were excluded due to the discrepancy between the field collection and drone flight dates.
Results
Trial weather data across Experiments 1–3
The relationship between growing degree days (GDD) and the average maximum and minimum temperatures, as well as rainfall in mungbean Experiments 1, 2 and 3 are depicted in Fig. 2a. The average maximum and minimum temperatures for Experiment 1 were 31.8°C and 17.6°C, respectively. In Experiment 1, large temperature fluctuations with higher rainfall were apparent pre-anthesis (690 GDD, 20% flowering) but were more stable post-anthesis. The highest maximum daily temperatures and rainfall occurred towards the end of the vegetative stages.
Weather data for Experiments 1, 2 and 3. (a) Average maximum and minimum temperature (°C) and rainfall (mm); (b) average measured relative humidity (%) and solar radiation (MJ/m2).
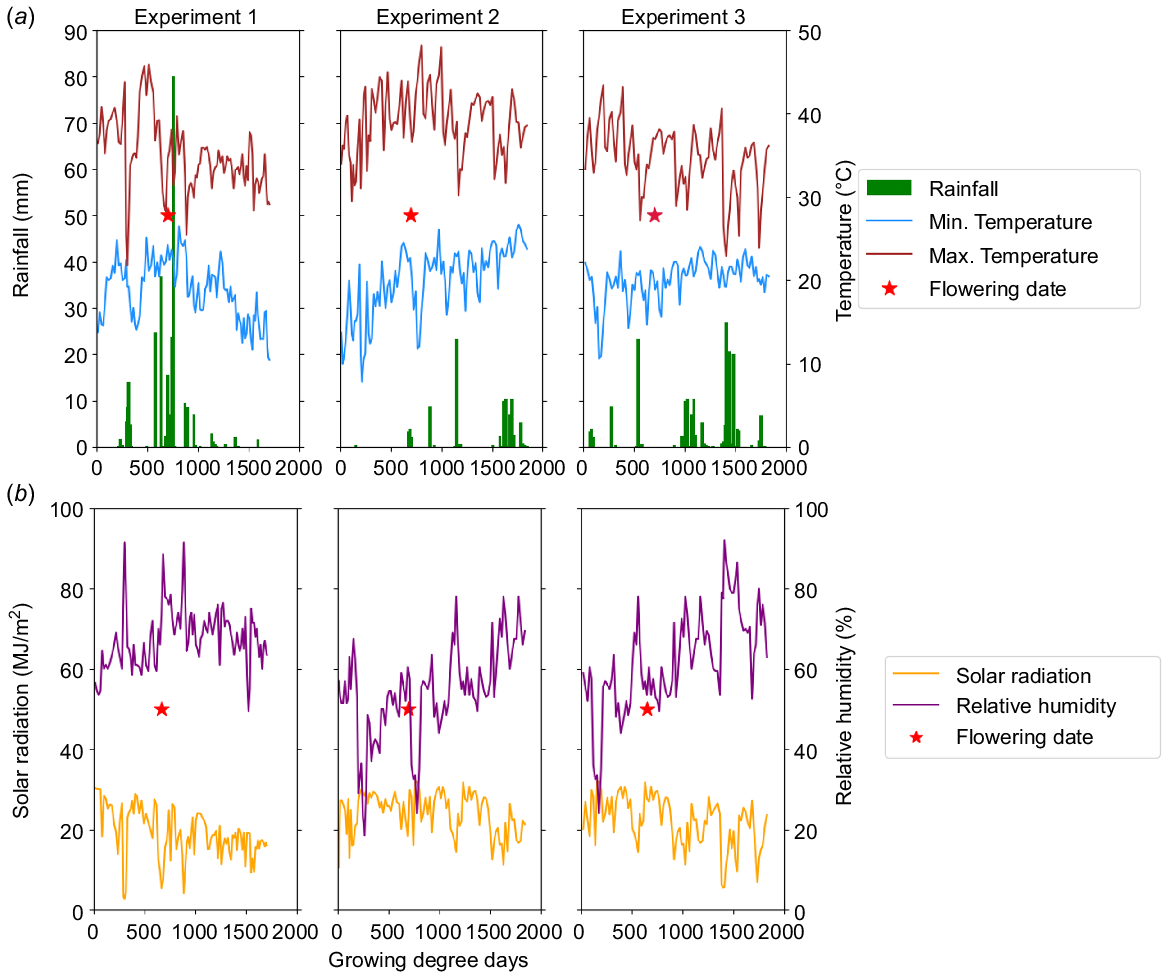
In Experiment 2, the average minimum and maximum temperatures were 17.7°C and 35°C, respectively. In Experiment 3, the average minimum and maximum temperatures were 20°C and 34.37°C, respectively. In Experiment 2, the highest temperature was observed during the flowering period, whereas in Experiment 3, it occurred during the early growth stages. During Experiment 2, higher temperatures with relatively higher rainfall were seen during the flowering period (766 GDD, 50% flowering). In Experiment 3, higher temperatures and lower rainfall were observed in the period around the flowering (752 GDD, 50% flowering).
In-crop rainfall was relatively low across the three experiments. Total rainfall of 263 mm, 93 mm and 192 mm was observed in Experiments 1, 2 and 3, respectively. Most of the in-season rainfall occurred before flowering in Experiment 1 and after flowering in Experiments 2 and 3 (Fig. 2a). Relative humidity (RH) varied across the seasons and experiments. Experiment 1 had consistently high RH (49.5–91.5%) across the season, whereas Experiments 2 and 3 had increasing RH values as the season progressed (Fig. 2b). The solar radiation (MJ/m2) among the experiments showed a relatively stable trend with an average of 19.7 MJ/m2, 24.1 MJ/m2 and 21.73 MJ/m2 for Experiments 1, 2 and 3, respectively (Fig. 2b). The average of solar radiation in Experiment 1 was lower than in Experiments 2 and 3.
Ground truth data
There were no significant differences (Experiment 1, P = 0.649; Experiment 2, P = 0.178; Experiment 3, P = 0.317) over time between the varieties used in Experiments 1, 2 and 3. As a result, two varieties were combined to present LAI for each experiment. For Experiment 1, LAI rapidly increased until canopy closure (around 619 GDD), then slowly rose and finally decreased as leaf senescence began. In Experiments 2 and 3, LAI increased to a peak at the pod and grain development stage (around 1319 GDD and 1259 GDD, respectively). During pod development, accelerating leaf senescence increased biomass partitioning to developing pods, thereby reducing canopy development. Maximum LAI for the three experiments were observed at the grain-filling stage as shown in Fig. 3a.
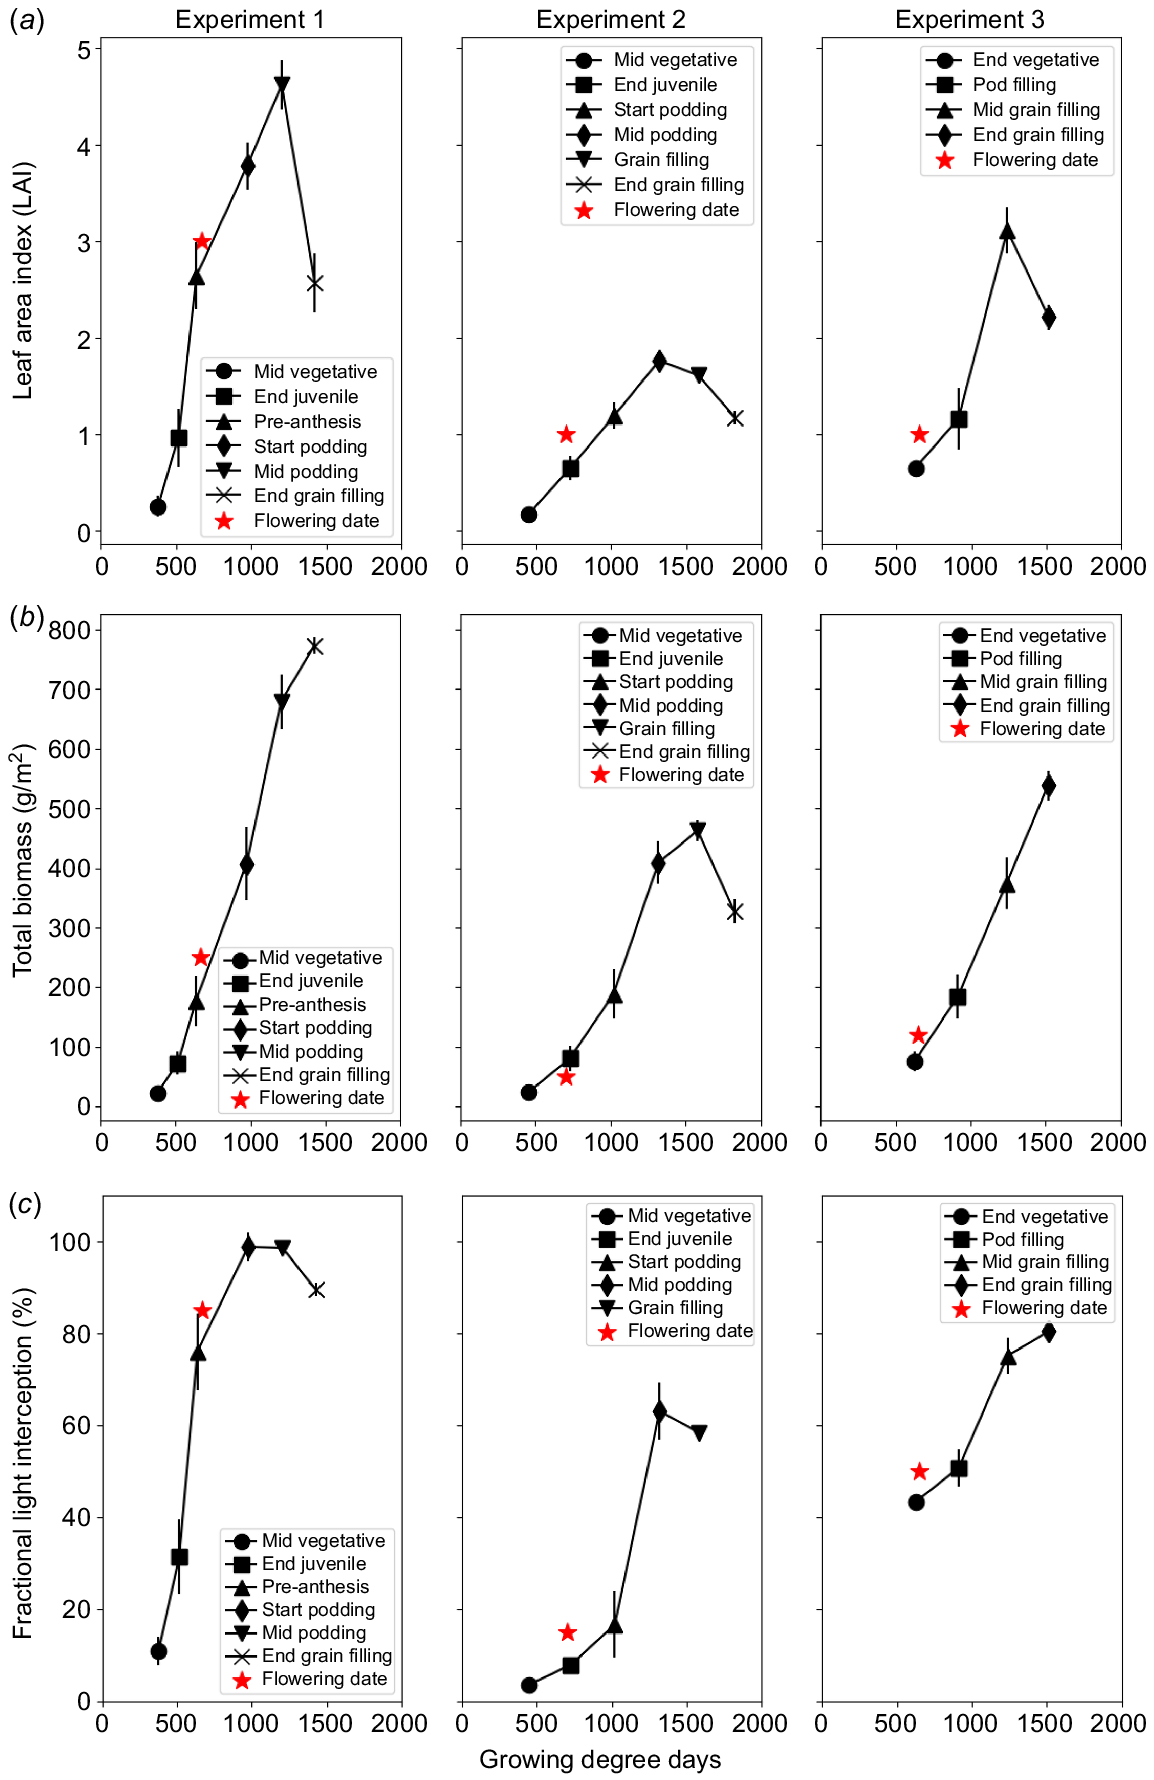
Development of biomass (g/m2) throughout the seasons in Experiments 1, 2 and 3 are shown in Fig. 3b. Overall, there were no significant differences (Experiment 1, P = 0.859; Experiment 2, P = 0.169; Experiment 3, P = 0.663) for cultivars in biomass in three experiments over time. In Experiments 1 and 3, the average total biomass tended to increase steadily throughout the entire growing period, whereas during Experiment 2, the varieties reached a peak during the filling stage around 1500 GDD.
There were no significant differences between cultivars for fractional light interception in the three experiments (Experiment 1, P = 0.855; Experiment 2, P = 0.711; Experiment 3, P = 0.971). Overall, although fractional light interception throughout the growing season for three mungbean cultivars varied across the experiments, it consistently increased throughout the season, reaching a peak during early to mid-podding (seasonally dependent) and then declined before crop maturity as leaves senesced (Fig. 3c). In Experiment 1, the peak of fractional light interception occurred at the early pod filling stage (1170 GDD) at around 98%. The peak was around 60% and 80% for Experiments 2 and 3, respectively.
The radiation extinction coefficient for the different mungbean varieties was computed for each experiment, using a linear relationship between the −ln(1−fractional light interception) and LAI and forcing this relationship to pass through 0 (Fig. 4a).
Growth parameters: Extinction coefficient values (k) and radiation use efficiency for Experiments 1, 2 and 3. (a) Extinction coefficient values (k) from the relationship between −ln (1−fractional light interception) and LAI for three different mungbean varieties (Jade-AU, Satin II and Crystal); (b) radiation use efficiency (RUE).
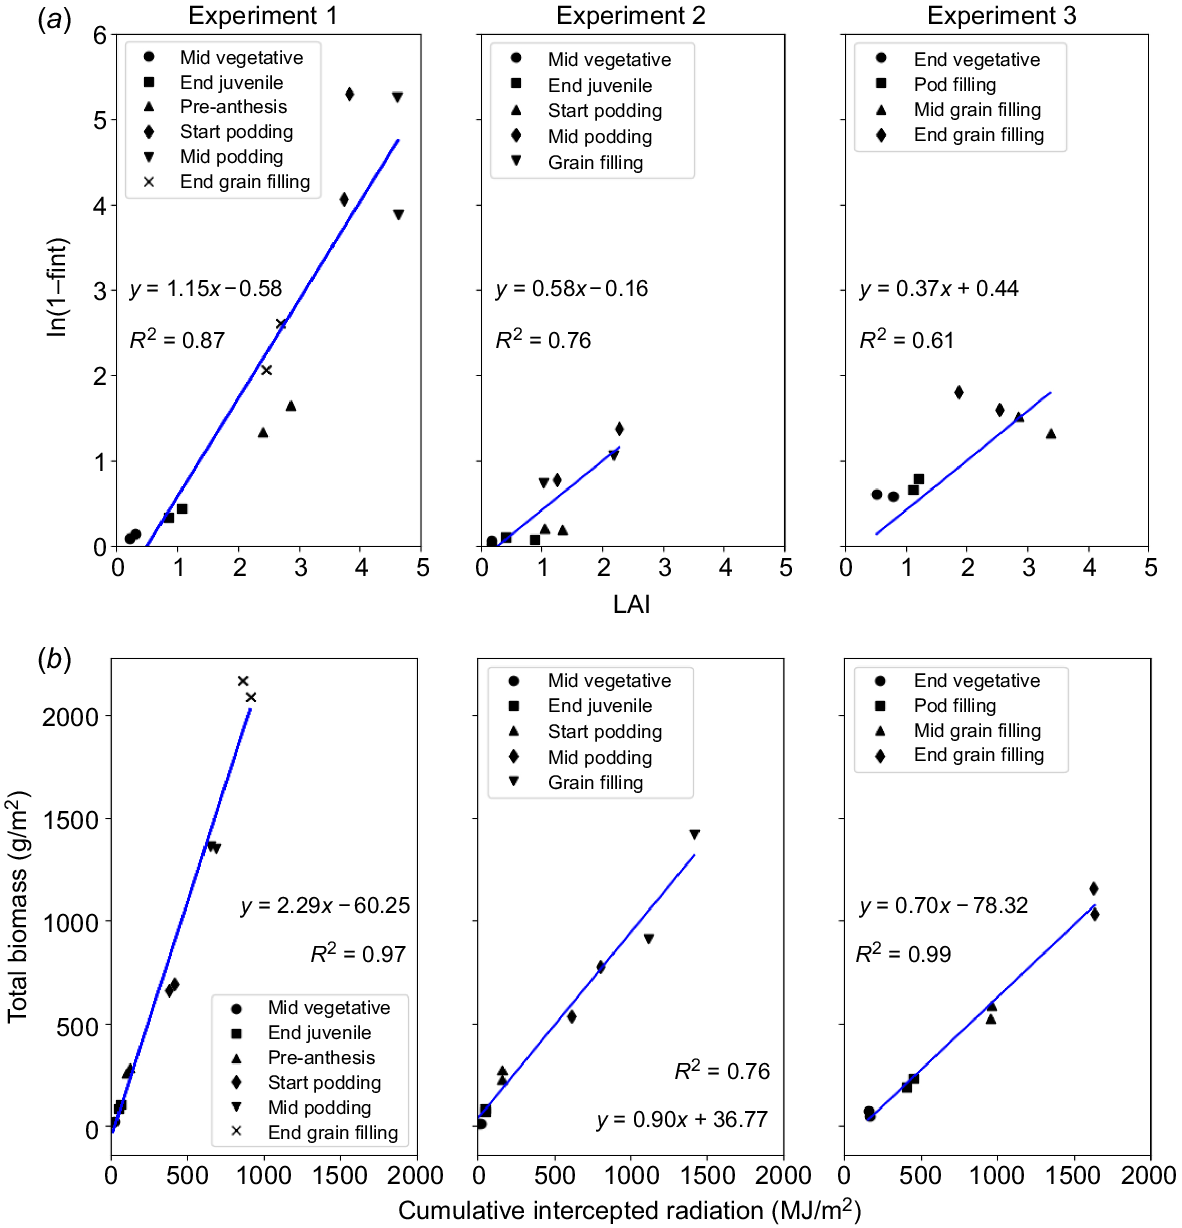
Statistically significant differences between varieties for k were only observed in Experiment 3 (P = 0.027). In Experiment 3, k values of 0.66 and 0.48 (R2 = 0.88) were calculated for Jade-AU and Crystal, respectively. During Experiment 1, where LAI values were relatively higher, k values for Jade-AU and Satin II were 0.72 and 0.68 (R2 = 0.93), respectively. In Experiment 2, Jade-AU and Crystal had k values of 0.45 and 0.41 (R2 = 0.73), respectively.
Overall, statistical differences for RUE among the varieties were exclusively observed in Experiment 2 (P = 0.020) for Crystal and Jade-AU. In this context, RUE values were 1.00 g/MJ for Crystal and 0.84 g/MJ for Jade-AU, as depicted in Fig. 4b: Experiment 2. These differences are discernible specifically in the mid-podding and grain-filling stages for Experiment 2. No statistically significant differences were observed between the varieties in Experiments 1 (P = 0.659) and 3 (P = 0.156).
UAV imagery data
All three experiments’ data were combined to analyse the relationship between UAV imagery and ground data, because no significant differences existed in LAI, biomass and fractional light interception between cultivars across the season. However, ground truth data was split into pre- and post-flowering data as the relationships between biomass development and light interception changed significantly in the post-flowering period. As a result, UAV data analysis was also divided into two different subgroups (pre-flowering and post-flowering) across the three experiments.
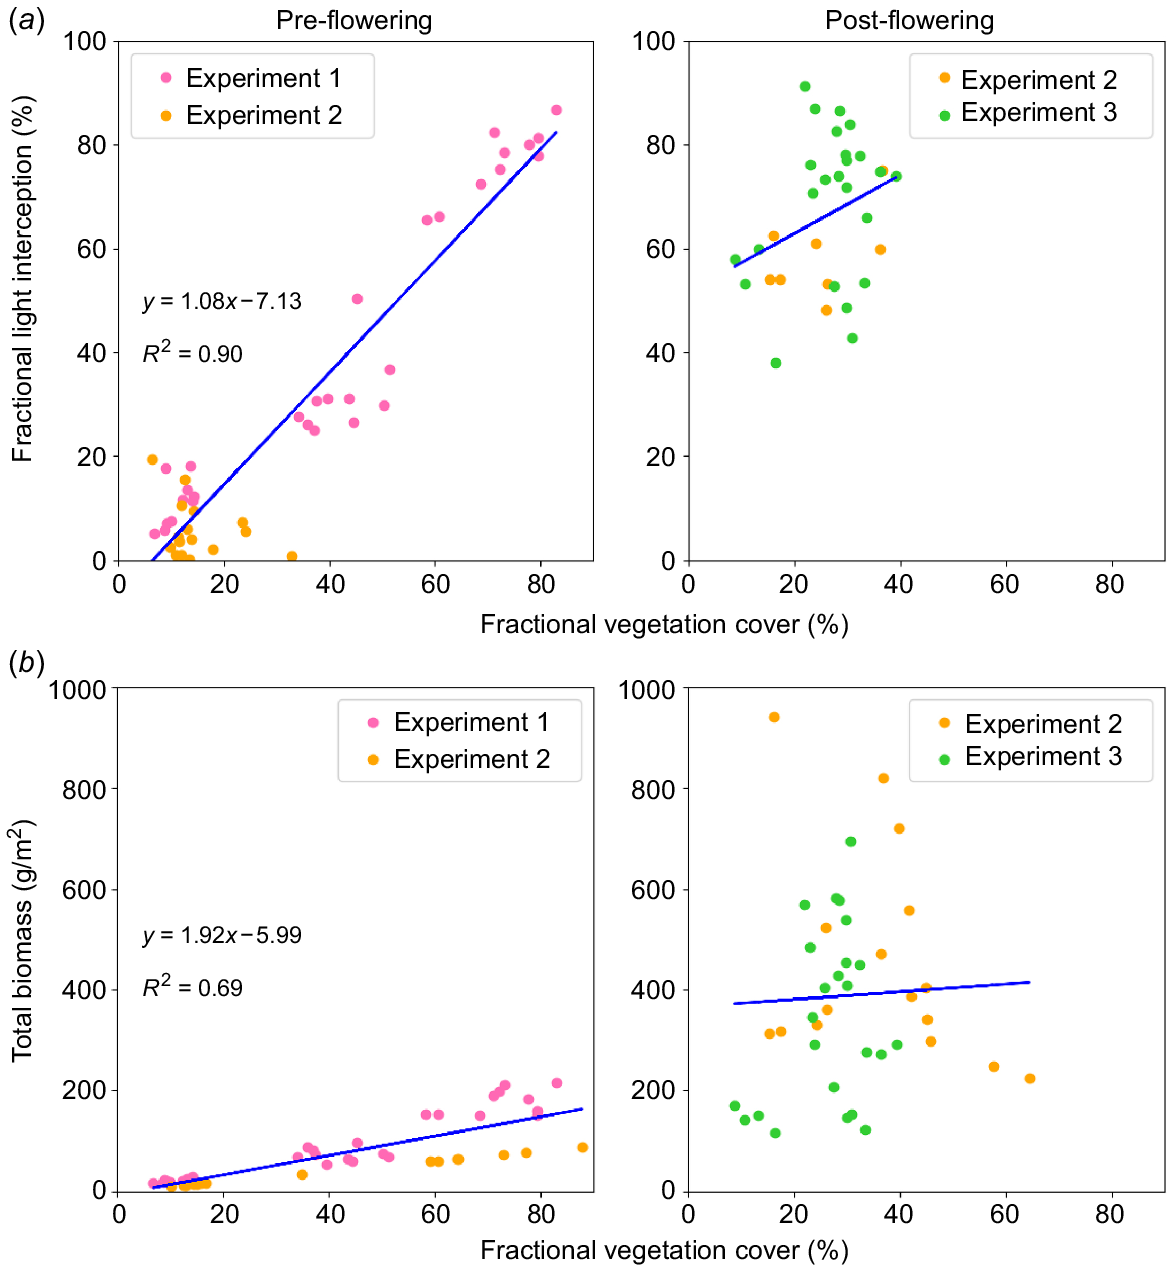
Pre-flowering there was a strong linear relationship between fractional light interception and FVC (R2 = 0.90), but post-flowering this relationship was weak (R2 = 0.09) in Fig. 5a. There was also a relatively strong relationship (R2 = 0.69) between total biomass and FVC at pre-flowering stages, which disappeared at post-flowering stages (R2 < 0.01), seen in Fig. 5b.
Relationship between fractional light interception, total biomass, and fractional vegetation cover for pre-flowering and post-flowering stages. (a) Relationship between the fractional light interception (%) and fractional vegetation cover; (b) relationship between total biomass (g/m2) and fractional vegetation cover (%).
Overall, the strength of the relationships between total biomass, LAI and all vegetation indices (CIVE, GLI, ExG, NGRDI and VARI) was significantly influenced by crop growth and phenological stages. During the pre-flowering stages, biomass and LAI were correlated with all vegetation indices (Table 3; all R2 > 0.60). In comparison, biomass was poorly correlated (R2 ≤ 0.08) with all vegetation indices post-flowering, and only weak relationships (R2 ≤ 0.41) occurred with LAI in the post-flowering period. Biomass and LAI had the most robust association with NGRDI (R2 = 0.87 and R2 = 0.89, respectively) before flowering.
| Stage | Vegetation index | R 2 | ||
|---|---|---|---|---|
| Biomass | LAI | |||
| Pre-flowering | CIVE | 0.60 | 0.64 | |
| ExG | 0.86 | 0.89 | ||
| GLI | 0.86 | 0.89 | ||
| NGRDI | 0.87 | 0.89 | ||
| VARI | 0.80 | 0.81 | ||
| Post-flowering | CIVE | 0.04 | 0.41 | |
| ExG | 0.08 | 0.41 | ||
| GLI | 0.08 | 0.41 | ||
| NGDRI | 0.01 | 0.37 | ||
| VARI | 0.03 | 0.01 | ||
Bolded data indicates biomass and LAI had the most robust association with NGRDI at pre-flowering stage.
There was a strong relationship between the predicted biomass from FVC and observed biomass pre-flowering (R2 = 0.79), which disappeared post-flowering (R2 < 0.01). Across the vegetation indices, the highest correlations were observed with NGRDI and ExG during pre-and post-flowering stages. The predicted biomass from NGRDI had a positive and robust relationship with the observed biomass during the pre-flowering stages (R2 = 0.86).
Discussion
Growth parameters under different sowing times
This study found no significant differences in leaf area index (LAI), biomass, fractional light interception, radiation extinction coefficient (k) or radiation use efficiency (RUE) among three genotypes: Jade-AU, Satin II and Crystal. Given that the three varieties have similar morphological characteristics, including a determinate growth pattern and similar plant architecture, with flower buds differentiating at the apex of the main stems or branches (Chauhan and Williams 2018), this may not be surprising. The lack of differences in the measured traits could be due to the similarities in the photosynthetic capacities, environmental responses and resource utilisation of the three varieties (Geetika et al. 2022a). Jade-AU, Satin II and Crystal, which account for over 90% of the country’s mungbean seed production, all have large green seeds (Chauhan and Williams 2018). Geetika et al. (2022a) reported similar findings, showing that there was no significant difference in radiation extinction (k) or RUE between the genotypes Jade-AU, Opal-AU and Satin-II in two field trials. Opal-AU, like the mungbean varieties used in this study, is also a large-seeded shiny green genotype (Australian Mungbean Association 2020).
Although Experiments 2 and 3 received additional irrigation after sowing, the canopy structure of Experiment 1 was substantially more vigorous and larger throughout the growing season in terms of LAI, fractional light interception and biomass, possibly due to the high in-season rainfall during the vegetative stage in Experiment 1. In Experiments 2 and 3, the rainfall mainly occurred during the post-flowering stages when the canopy growth rate had started to decrease. This led to variations in canopy development among the experiments.
Biomass accumulation is determined by LAI, radiation extinction coefficient (k), the duration of fractional light interception, and RUE (Tesfaye et al. 2006; Chauhan and Williams 2018). Biomass in legumes is generally positively correlated with LAI under conditions with no water stress; LAI is reduced dramatically when the plants are stressed with high temperatures and water stress during the vegetative stages (Tesfaye et al. 2006). Extremely high temperatures (above 40°C) and direct effects of heat during flowering (Experiment 2) and pod stages (Experiment 3) may have affected biomass accumulation of Jade-AU and Crystal. Patriyawaty et al. (2018a) found that high temperatures significantly reduced dry matter production and grain yield of mungbean cultivars Jade-AU and Crystal. High temperatures impact floral abortion rates, decrease pollen viability and reduce biomass accumulation (Patriyawaty et al. 2018b; Rachaputi et al. 2019). Temperature fluctuations and unpredictable rainfall have been observed to negatively affect mungbean biomass. This is consistent with previous research in Geetika et al. (2022b), which has shown that extreme temperatures and moisture stress during the growing season can reduce mungbean growth and yield. For example, high temperatures during the flowering stage can reduce pod set and seed filling, and prolonged drought can reduce leaf area and photosynthesis, leading to reduced biomass accumulation.
Sowing time also affects biomass. As observed in this study, the optimal time to achieve maximum mungbean biomass is the summer season (around January) due to the favourability of warmer weather at the vegetative stages (Robertson et al. 2000). The highest biomass accumulation occurred in Experiment 1 planted in February 2018, whereas biomass was reduced in Experiments 2 and 3 sown in October and mid-November 2019, respectively. High levels of in-season rainfall in Experiment 1 also contributed to increased biomass.
Higher LAI results in higher fractional light interception, which enhances crop growth rate and consequently leads to higher biomass (Yousefi et al. 2021). Greater LAI can contribute to higher biomass in mungbean, but it is not the only determining factor. Experiment 1 had much higher LAI and fractional light interception than Experiments 2 and 3, which likely contributed to its higher biomass accumulation. Agronomic management practices such as row spacing and plant density have been recognised as crucial strategies that can significantly impact the canopy radiation environment under favourable growing conditions (Geetika et al. 2022a).
Experiment 1 showed higher estimated k and RUE compared to Experiments 2 and 3, possibly due to temperature–radiation imbalances and higher temperatures during mungbean’s reproductive stages. According to Rachaputi et al. (2015), a decrease in k can result in a reduction in fractional light interception per unit of LAI and dry matter accumulation. The RUE values of the three cultivars in Experiments 1 and 2 were consistent with earlier studies on mungbean, which reported baseline RUE values of 0.8–1 g/MJ in well-watered environments (Muchow et al. 1993; Rachaputi et al. 2015; Chauhan and Williams 2018). Experiment 1, which was conducted during the summer season of 2018, was associated with the highest RUE, of up to 1.3 g/MJ. This value is consistent with the findings of Geetika et al. (2022a), who reported a RUE of 1.3 g/MJ for the same genotypes (Jade-AU and Satin II) in field trials conducted in the summer season of 2019 and 2020. Variations observed among the three experiments could be attributed to fluctuations in temperature–radiation equilibrium, particularly during the reproductive stages of mungbean growth (Geetika et al. 2022b).
Relationship between UAV imagery and ground data on mungbean biomass prediction
FVC has been utilised to monitor vegetation conditions and estimate biomass from UAV-based RGB imagery (Yan et al. 2019; Yue et al. 2019). In this study, FVC from the UAV image data strongly correlated with the fractional light interception (R2 = 0.90) during the pre-flowering stage. This high level of correlation means that using FVC derived from UAV data provides a valid alternative to more detailed ground-based, time and labour-intensive ceptometer measurements of light interception (Steven et al. 1986; Gitelson 2013). This study shows that UAV-based measurements can provide an alternative approach to estimate RUE using FVC, which is strongly correlated with biomass but is not equivalent to biomass itself.
Crop canopy structure, field background, separation and classification in the process of orthomosaic images can affect FVC computation in later stages (Bendig et al. 2015; Wan et al. 2021). Factors such as shading, increased canopy density with overlapping leaf layers, cessation of vegetative growth and later leaf senescence are likely to influence the accuracy of fractional light interception and consequently, the quantification of FVC at post-anthesis stages in all three experiments.
At the pre-anthesis stages, we observed that the relationships between FVC and fractional light interception, as well as between FVC and biomass, were comparable to the strong correlation between UAV-derived vegetation indices and biomass or LAI. Specifically, all the vegetation indices showed a strong relationship (all R2 > ~0.80, except CIVE) at pre-flowering stages. These relationships all became poor (all R2 < 0.41) at post-flowering stages (Table 3). In particular, biomass and LAI had the most robust relationship with NGRDI in the pre-flowering stage. Based on these results, NGRDI can accurately predict growth parameters of mungbean before flowering. NGRDI is considered to be a greenness index representing the combined effect of canopy architecture, leaf area and chlorophyll concentration that is strongly linked with biomass (Torres-Sánchez et al. 2014). Additionally, Jannoura et al. (2015) showed a relatively good relationship (R2 = 0.58–0.78) between the above-ground biomass and NGRDI in three different crops/combinations of crops (sole peas, intercropped peas/oats, and sole oats).
In this study, a significant correlation was also found between biomass, LAI, and the vegetation indices GLI, ExG and VARI during the pre-flowering stages. High positive GLI values indicate the presence of healthy green leaves and stems, which are useful for monitoring vegetation growth and assessing vegetation health (Louhaichi et al. 2001). The advantage of ExG is that it can provide a clear contrast between plants and soil and produce near binary images, whilst VARI can reduce the sensitivity to atmospheric factors to estimate biomass and LAI (Woebbecke et al. 1995; Gitelson et al. 2002). Marcial-Pablo et al. (2019) compared vegetation indices from the visible spectrum (ExG, CIVE and NGRDI) and other vegetation indices, such as normalised difference vegetation index (NDVI), green NDVI and normalised green from NIR sensors in maize by separating vegetation and bare soil as accurately as possible. They demonstrated high accuracy of ExG to monitor FVC at earlier growth stages, whereas later growing stages would require using a near-infrared sensor. (Kataoka et al. 2003) claimed that CIVE could separate vegetation from soil background to evaluate crop growing status and have a high correlation with growth parameters in sugar beet and soybean. However, CIVE in this study had the lowest correlation with biomass and LAI compared to other vegetation indices during the pre-flowering period.
Other studies have also observed weak correlations between biomass/LAI and vegetation indices at later growth stages, possibly to due saturation at high LAI and biomass. Hunt et al. (2005) argued that dry biomass from zero to 120 g/m2 (early stage: before canopy closure) was linearly correlated with NGRDI obtained from digital cameras in soybeans, but beyond this point, NGRDI saturated and did not show any further increase when soybean biomass increased from 150 to 600 g/m2 (later stage). Motohka et al. (2010) noticed significant saturation happened in the middle of the growing period using NDVI to monitor biomass, although it usually had a marginally better cross-validation result than the NGRDI index. According to Yue et al.(2019), the estimates of biomass by using vegetation indices based on UAV data from RGB camera presented high accuracy at an early stage compared to later crop growth stages in wheat, since saturation and no unchanged cover are seen in the later growth stages. Across all crops, including mungbean in this study, these relationships are strong pre-flowering and weak post-flowering as canopy density increases.
Another potential reason for the better biomass prediction models originating from FVC and NGRDI (highest correlation with biomass and LAI) during pre-flowering stages may relate to canopy morphological structure. Mungbean plants grow tightly together and overlap each other after flowering in the field, although row spacing was applied within the range recommended for this crop. This made accurately predicting biomass more difficult as the season progressed because UAV images were captured above the ground, and overlapped biomass in image pixels cannot represent real biomass at later stages in the field.
The study on the relationship between UAV imagery and ground data on mungbean biomass prediction found a strong correlation between the two methods at pre-flowering stages. The research team was able to accurately and efficiently measure growth parameters and biomass estimation using UAV imagery. These findings suggest that UAV imagery can be a reliable and cost-effective method for measuring crop growth parameters, particularly in crops like mungbean where ground-based measurements are challenging. The study’s implications for future research in mungbean and other crops include the potential for wider adoption of UAV technology in crop monitoring and management. Additionally, the study highlights the need for further research to optimise the use of UAV imagery for crop monitoring and to better understand the relationship between UAV and ground-based data. Other modified vegetation indices from high-resolution RGB cameras or combining an RGB with NIR sensor to assess biomass in the mungbean’s later stages may need to be considered. More studies with UAV-based RGB imagery in legumes, particularly mungbean, are encouraged by using FVC through different crop growth stages, locations including glasshouse and fields, genotypes and experimental designs in future years.
Conclusions
In this study, we compared UAV imagery with field sampling (biomass, leaf area and fractional light interception) to assess growth parameters in mungbean, providing a new and innovative approach to monitor and estimate biomass. The use of UAV applications with RGB imagery in mungbean fields provided an alternative to manual collection of light interception measurements for estimating biomass during pre-flowering stages. This was achieved by developing models using vegetation indices, specifically NGRDI, and FVC. These two biomass prediction models allow relatively accurate non-destructive biomass prediction before flowering under no water stress conditions through two seasons/three sowing date experiments in the field. This study has shown that using a UAV-mounted RGB camera is a practical and cost-effective replacement to manual measurements for collecting data on mungbean at the pre-flowering stage. The results demonstrate that this method can provide accurate information with less labour and lower costs compared to traditional methods. This information is important for developing strategies to improve mungbean productivity and increase food security, particularly in regions where mungbean is an important crop for smallholder farmers.
Declaration of funding
This study was supported by Queensland Alliance for Agriculture and Food Innovation (QAAFI), School of Agriculture and Food Sciences (SAFS) from the University of Queensland, and the Commonwealth Scientific and Industrial Research Organisation CSIRO (Australia) with experiments in part funded by the Grains Research and Development Corporation (projects UQ1808-003RTX).
Author contributions
Yiyi Xiong performed the conceptualisation, methodology, experimentation, formal analysis, data curation and prepared the manuscript with contributions from Lucas Mauro Rogerio Chiau, who contributed to conceptualisation, experimentation and data curation. Scott Chapman proposed the research topic and methods; Marisa Collins and Kylie Wenham supervised the study, acquired funding and reviewed and edited. All authors have read and approved the manuscript.
Acknowledgements
We would like to thank Dr. Bangyou Zheng from the Commonwealth Scientific and Industrial Research Organisation (CSIRO) for the assistance of data analysis, Mr. Timothy Rossignol for piloting the drone, Dr. Vincent Mellor for helping in statistical analyses, Mr. Lachlan Fowler, Mr. Kurt Deifel and Ms. Bec Archer for field harvesting and laboratory help, and Dr. Cheryl McCarthy provided comments and feedback on the final manuscript.
References
Abud HF, Mesquita CMdS, Sarmento ECS, Melo RdS, Lima KAPd, Silva AKFd (2022) Image analysis of the seeds and seedlings of Vigna radiata L. Revista Ciência Agronômica 53, e20207303.
| Google Scholar |
Arnold CY (1959) The determination and significance of the base temperature in a linear heat unit system. Proceedings of the American Society for Horticultural Science 74, 430-445.
| Google Scholar |
Ballesteros R, Ortega JF, Hernandez D, Moreno MA (2018) Onion biomass monitoring using UAV-based RGB imaging. Precision Agriculture 19, 840-857.
| Crossref | Google Scholar |
Bendig J, Yu K, Aasen H, Bolten A, Bennertz S, Broscheit J, Gnyp ML, Bareth G (2015) Combining UAV-based plant height from crop surface models, visible, and near infrared vegetation indices for biomass monitoring in barley. International Journal of Applied Earth Observation and Geoinformation 39, 79-87.
| Crossref | Google Scholar |
Casadesús J, Kaya Y, Bort J, Nachit MM, Araus JL, Amor S, Ferrazzano G, Maalouf F, Maccaferri M, Martos V, Ouabbou H, Villegas D (2007) Using vegetation indices derived from conventional digital cameras as selection criteria for wheat breeding in water-limited environments. Annals of Applied Biology 150, 227-236.
| Crossref | Google Scholar |
Chapman SC, Merz T, Chan A, Jackway P, Hrabar S, Dreccer MF, Holland E, Zheng B, Ling TJ, Jimenez-Berni J (2014) Pheno-copter: a low-altitude, autonomous remote-sensing robotic helicopter for high-throughput field-based phenotyping. Agronomy 4, 279-301.
| Crossref | Google Scholar |
Chauhan YS, Williams R (2018) Physiological and agronomic strategies to increase Mungbean yield in climatically variable environments of Northern Australia. Agronomy 8, 83.
| Crossref | Google Scholar |
De Costa WAJM, Shanmugathasan KN, Joseph KDSM (1999) Physiology of yield determination of mung bean (Vigna radiata (L.) Wilczek) under various irrigation regimes in the dry and intermediate zones of Sri Lanka. Field Crops Research 61, 1-12.
| Crossref | Google Scholar |
Du M, Noguchi N (2017) Monitoring of wheat growth status and mapping of wheat yield’s within-field spatial variations using color images acquired from UAV-camera system. Remote Sensing 9, 289.
| Crossref | Google Scholar |
Duan T, Zheng B, Guo W, Ninomiya S, Guo Y, Chapman SC (2017) Comparison of ground cover estimates from experiment plots in cotton, sorghum and sugarcane based on images and ortho-mosaics captured by UAV. Functional Plant Biology 44, 169-183.
| Crossref | Google Scholar | PubMed |
Gago J, Douthe C, Coopman RE, Gallego PP, Ribas-Carbo M, Flexas J, Escalona J, Medrano H (2015) UAVs challenge to assess water stress for sustainable agriculture. Agricultural Water Management 153, 9-19.
| Crossref | Google Scholar |
García-Martínez H, Flores-Magdaleno H, Ascencio-Hernández R, Khalil-Gardezi A, Tijerina-Chávez L, Mancilla-Villa OR, Vázquez-Peña MA (2020) Corn grain yield estimation from vegetation indices, canopy cover, plant density, and a neural network using multispectral and RGB images acquired with unmanned aerial vehicles. Agriculture 10, 277.
| Crossref | Google Scholar |
Geetika G, Hammer G, Smith M, Singh V, Collins M, Mellor V, Wenham K, Rachaputi RCN (2022a) Quantifying physiological determinants of potential yield in mungbean (Vigna radiata (L.) Wilczek). Field Crops Research 287, 108648.
| Crossref | Google Scholar |
Geetika G, Collins M, Singh V, Hammer G, Mellor V, Smith M, Rachaputi RCN (2022b) Canopy and reproductive development in mungbean (Vigna radiata). Crop & Pasture Science 73, 1142-1155.
| Crossref | Google Scholar |
Gitelson AA (2013) Remote estimation of crop fractional vegetation cover: the use of noise equivalent as an indicator of performance of vegetation indices. International Journal of Remote Sensing 34, 6054-6066.
| Crossref | Google Scholar |
Gitelson AA, Kaufman YJ, Stark R, Rundquist D (2002) Novel algorithms for remote estimation of vegetation fraction. Remote Sensing of Environment 80, 76-87.
| Crossref | Google Scholar |
Guo W, Rage UK, Ninomiya S (2013) Illumination invariant segmentation of vegetation for time series wheat images based on decision tree model. Computers and Electronics in Agriculture 96, 58-66.
| Crossref | Google Scholar |
Guo W, Zheng B, Duan T, Fukatsu T, Chapman S, Ninomiya S (2017) EasyPCC: benchmark datasets and tools for high-throughput measurement of the plant canopy coverage ratio under field conditions. Sensors 17, 798.
| Crossref | Google Scholar | PubMed |
Hirose T (2005) Development of the Monsi–Saeki theory on canopy structure and function. Annals of Botany 95, 483-494.
| Crossref | Google Scholar | PubMed |
Hunt ER, Jr., Cavigelli M, Daughtry CST, Mcmurtrey JE, III, Walthall CL (2005) Evaluation of digital photography from model aircraft for remote sensing of crop biomass and nitrogen status. Precision Agriculture 6, 359-378.
| Crossref | Google Scholar |
Hunt ER, Jr., Doraiswamy PC, McMurtrey JE, Daughtry CST, Perry EM, Akhmedov B (2013) A visible band index for remote sensing leaf chlorophyll content at the canopy scale. International Journal of Applied Earth Observation and Geoinformation 21, 103-112.
| Crossref | Google Scholar |
Jannoura R, Brinkmann K, Uteau D, Bruns C, Joergensen RG (2015) Monitoring of crop biomass using true colour aerial photographs taken from a remote controlled hexacopter. Biosystems Engineering 129, 341-351.
| Crossref | Google Scholar |
Jia K, Liang S, Liu S, Li Y, Xiao Z, Yao Y, Jiang B, Zhao X, Wang X, Xu S, Cui J (2015) Global land surface fractional vegetation cover estimation using general regression neural networks from MODIS surface reflectance. IEEE Transactions on Geoscience and Remote Sensing 53, 4787-4796.
| Crossref | Google Scholar |
Jiapaer G, Chen X, Bao A (2011) A comparison of methods for estimating fractional vegetation cover in arid regions. Agricultural and Forest Meteorology 151, 1698-1710.
| Crossref | Google Scholar |
Khan A, Khalil SK (2010) Effect of leaf area on dry matter production in aerated mung bean seed. International Journal of Plant Physiology and Biochemistry 2, 52-61.
| Google Scholar |
Li L, Zhang Q, Huang D (2014) A review of imaging techniques for plant phenotyping. Sensors 14, 20078-20111.
| Crossref | Google Scholar | PubMed |
Lin Z-S, Qi X-Z (2004) Vegetation evolution with degenerating soil ecology under unequal competition. Pedosphere 14, 355-361.
| Google Scholar |
Liu Y, Mu X, Wang H, Yan G (2012) A novel method for extracting green fractional vegetation cover from digital images. Journal of Vegetation Science 23, 406-418.
| Crossref | Google Scholar |
Louhaichi M, Borman MM, Johnson DE (2001) Spatially located platform and aerial photography for documentation of grazing impacts on wheat. Geocarto International 16, 65-70.
| Crossref | Google Scholar |
Lu J, Cheng D, Geng C, Zhang Z, Xiang Y, Hu T (2021) Combining plant height, canopy coverage and vegetation index from UAV-based RGB images to estimate leaf nitrogen concentration of summer maize. Biosystems Engineering 202, 42-54.
| Crossref | Google Scholar |
Mahajan U, Raj B (2016) Drones for normalized difference vegetation index (NDVI), to estimate crop health for precision agriculture: a cheaper alternative for spatial satellite sensors. In ‘Proceedings of the International Conference on Innovative Research in Agriculture, Food Science, Forestry, Horticulture, Aquaculture, Animal Sciences, Biodiversity, Ecological Sciences and Climate Change (AFHABEC-2016)’, Delhi, India, 22 October 2016. (Krishi Sanskriti: India)
Marcial-Pablo MdJ, Gonzalez-Sanchez A, Jimenez-Jimenez SI, Ontiveros-Capurata RE, Ojeda-Bustamante W (2019) Estimation of vegetation fraction using RGB and multispectral images from UAV. International Journal of Remote Sensing 40, 420-438.
| Crossref | Google Scholar |
Monsi M, Saeki T (1953) Uber den Lichtfaktor in den Pflanzengesellschaften und seine Bedeutung fur die Stoffproduktion. Japanese Journal of Botany 14, 22-52.
| Google Scholar |
Monteith JL (1977) Climate and the efficiency of crop production in Britain. Philosophical Transactions of the Royal Society of London. B, Biological Sciences 281, 277-294.
| Crossref | Google Scholar |
Motohka T, Nasahara KN, Oguma H, Tsuchida S (2010) Applicability of green-red vegetation index for remote sensing of vegetation phenology. Remote Sensing 2, 2369-2387.
| Crossref | Google Scholar |
Muchow RC, Robertson MJ, Pengelly BC (1993) Accumulation and partitioning of biomass and nitrogen by soybean, mungbean and cowpea under contrasting environmental conditions. Field Crops Research 33, 13-36.
| Crossref | Google Scholar |
Nemani RR, Running SW, Pielke RA, Chase TN (1996) Global vegetation cover changes from coarse resolution satellite data. Journal of Geophysical Research: Atmospheres 101, 7157-7162.
| Crossref | Google Scholar |
Noble T (2017) Development of the Mungbean Nested Association Mapping (NAM) Resource. InterDrought 5, 218.
| Google Scholar |
Patriyawaty NR, Rachaputi RCN, George D, Douglas C (2018a) Genotypic variability for tolerance to high temperature stress at reproductive phase in Mungbean [Vigna radiata (L.) Wilczek]. Scientia Horticulturae 227, 132-141.
| Crossref | Google Scholar |
Patriyawaty NR, Rachaputi RCN, George D (2018b) Physiological mechanisms underpinning tolerance to high temperature stress during reproductive phase in mungbean (Vigna radiata (L.) Wilczek). Environmental and Experimental Botany 150, 188-197.
| Crossref | Google Scholar |
Rachaputi RCN, Chauhan Y, Douglas C, Martin W, Krosch S, Agius P, King K (2015) Physiological basis of yield variation in response to row spacing and plant density of mungbean grown in subtropical environments. Field Crops Research 183, 14-22.
| Crossref | Google Scholar |
Rachaputi RCN, Sands D, McKenzie K, Agius P, Lehane J, Seyoum S (2019) Eco-physiological drivers influencing mungbean [Vigna radiata (L.) Wilczek] productivity in subtropical Australia. Field Crops Research 238, 74-81.
| Crossref | Google Scholar |
Rane J, Raina SK, Govindasamy V, Bindumadhava H, Hanjagi P, Giri R, Jangid KK, Kumar M, Nair RM (2021) Use of phenomics for differentiation of mungbean (Vigna radiata L. Wilczek) genotypes varying in growth rates per unit of water. Frontiers in Plant Science 12, 692564.
| Crossref | Google Scholar |
Robertson MJ, Carberry PS, Lucy M (2000) Evaluation of a new cropping option using a participatory approach with on-farm monitoring and simulation: a case study of spring-sown mungbeans. Australian Journal of Agricultural Research 51, 1-12.
| Crossref | Google Scholar |
Robertson MJ, Carberry PS, Huth NI, Turpin JE, Probert ME, Poulton PL, Bell M, Wright GC, Yeates SJ, Brinsmead RB (2002) Simulation of growth and development of diverse legume species in APSIM. Australian Journal of Agricultural Research 53, 429-446.
| Crossref | Google Scholar |
Sadeghipour O (2008) Response of mungbean varieties to different sowing dates. Pakistan Journal of Biological Sciences 11, 2048-2050.
| Crossref | Google Scholar | PubMed |
Shafian S, Rajan N, Schnell R, Bagavathiannan M, Valasek J, Shi Y, Olsenholler J (2018) Unmanned aerial systems-based remote sensing for monitoring sorghum growth and development. PLoS ONE 13, e0196605.
| Crossref | Google Scholar | PubMed |
Sharma B, Ritchie GL, Rajan N (2015) Near-remote green: red perpendicular vegetation index ground cover fraction estimation in cotton. Crop Science 55, 2252-2261.
| Crossref | Google Scholar |
Sinclair TR, Muchow RC (1999) Radiation use efficiency. Advances in Agronomy 65, 215-265.
| Crossref | Google Scholar |
Steven MD, Biscoe PV, Jaggard KW, Paruntu J (1986) Foliage cover and radiation interception. Field Crops Research 13, 75-87.
| Crossref | Google Scholar |
Sumesh KC, Ninsawat S, Som-ard J (2021) Integration of RGB-based vegetation index, crop surface model and object-based image analysis approach for sugarcane yield estimation using unmanned aerial vehicle. Computers and Electronics in Agriculture 180, 105903.
| Crossref | Google Scholar |
Tesfaye K, Walker S, Tsubo M (2006) Radiation interception and radiation use efficiency of three grain legumes under water deficit conditions in a semi-arid environment. European Journal of Agronomy 25, 60-70.
| Crossref | Google Scholar |
Torres-Sánchez J, Peña JM, de Castro AI, López-Granados F (2014) Multi-temporal mapping of the vegetation fraction in early-season wheat fields using images from UAV. Computers and Electronics in Agriculture 103, 104-113.
| Crossref | Google Scholar |
Torres-Sánchez J, López-Granados F, Serrano N, Arquero O, Peña JM (2015) High-throughput 3-D monitoring of agricultural-tree plantations with unmanned aerial vehicle (UAV) technology. PLoS ONE 10, e0130479.
| Crossref | Google Scholar | PubMed |
Wan L, Zhu J, Du X, Zhang J, Han X, Zhou W, Li X, Liu J, Liang F, He Y, Cen H (2021) A model for phenotyping crop fractional vegetation cover using imagery from unmanned aerial vehicles. Journal of Experimental Botany 72, 4691-4707.
| Crossref | Google Scholar | PubMed |
Woebbecke DM, Meyer GE, Von Bargen K, Mortensen DA (1995) Color indices for weed identification under various soil, residue, and lighting conditions. Transactions of the ASAE 38, 259-269.
| Crossref | Google Scholar |
Xue J, Su B (2017) Significant remote sensing vegetation indices: a review of developments and applications. Journal of Sensors 2017, 1-17.
| Crossref | Google Scholar |
Yan G, Li L, Coy A, Mu X, Chen S, Xie D, Zhang W, Shen Q, Zhou H (2019) Improving the estimation of fractional vegetation cover from UAV RGB imagery by colour unmixing. ISPRS Journal of Photogrammetry and Remote Sensing 158, 23-34.
| Crossref | Google Scholar |
Yousefi A, Mirzaeitalarposhti R, Nabati J, Soufizadeh S (2021) Evaluation radiation use efficiency and growth indicators on two mung bean (Vigna radiata L.) genotypes under the influence of biological fertilizers. Journal of Plant Nutrition 44, 1095-1106.
| Crossref | Google Scholar |
Yue J, Yang G, Li C, Li Z, Wang Y, Feng H, Xu B (2017) Estimation of winter wheat above-ground biomass using unmanned aerial vehicle-based snapshot hyperspectral sensor and crop height improved models. Remote Sensing 9, 708.
| Crossref | Google Scholar |
Yue J, Yang G, Tian Q, Feng H, Xu K, Zhou C (2019) Estimate of winter-wheat above-ground biomass based on UAV ultrahigh-ground-resolution image textures and vegetation indices. ISPRS Journal of Photogrammetry and Remote Sensing 150, 226-244.
| Crossref | Google Scholar |