

Profitable, low-emission nitrogen application strategies in Western Australian dryland cropping
C. d’Abbadie A , S. Kharel A , R. Kingwell A B C * and A. Abadi Ghadim A
A
B
C
Abstract
Australian grain producers may need to report their farm greenhouse emissions. Accordingly, nitrogen fertiliser application strategies will need to include consideration of their environmental as well as economic impacts.
We aim to identify the nitrogen application strategies suited to dryland cropping in Western Australia that are highly profitable and that generate lower emissions.
Simulation modelling is used to examine the gross margins and emissions associated with four broadly different nitrogen strategies at 14 locations in the grainbelt of Western Australia for different frequencies of cropping.
Strategies that generate high gross margins and moderate emissions often focus on maximising the gross margin of crop production, and apply a decile 5 view of unfolding seasonal conditions. A similarly useful strategy applies nitrogen in a fixed ratio where a tonne of expected cereal receives 45 units of nitrogen from various sources, and a tonne of expected canola receives 70 units of nitrogen from various sources. Where a farmer prefers to apply a constant rate of nitrogen, then exceedingly high or low rates of application should mostly be avoided, either for economic or for environmental reasons, with the better option at many locations being to apply 50 or 75 kg N/crop ha.
A few preferred nitrogen application strategies are suggested to be applicable to dryland cropping in the study region. The strategies achieve high profits and generate moderate or low emissions.
Selection of highly profitable and lower emission nitrogen application strategies across the study region can deliver sizeable economic and environmental benefits.
Keywords: dryland cropping, economics, emissions, fertilisers, gross margins, nitrogen application, nitrogen strategies, state contingent.
Introduction
Until the mid-1990s, nitrogen (N) used by Australian dryland crops mostly came from mining of soil organic matter and from N supplied by N-fixing, legume-based pastures grown in rotation with crops (Angus and Grace 2016). However, after the mid-1990s, N fertiliser input increased to an average of ~45 kg N/crop ha, of which only about half was taken up by crops. The remainder was retained in the soil after harvest and about a quarter was lost via denitrification, ammonia volatilisation and leaching (Angus and Grace 2016).
These environmental losses became of increasing concern in the 2010s and onwards as Australian governments and agricultural businesses sought ways to reduce greenhouse gas emissions to help achieve carbon neutrality. In general, N losses from soils can have negative air and water resource impacts (Easton and Petrovic 2004; Guillard and Kopp 2004; Blaylock et al. 2005; Cameron et al. 2013; LeMonte et al. 2016), although in Australia, overuse of N fertiliser is uncommon, noting that Australian crop production and its input use, including N fertilisers, are not subsidised. Nonetheless, release of nitrous oxide (N2O), a greenhouse gas 300 times more potent than carbon dioxide (Burton et al. 2003; Cameron et al. 2013), does accompany use of N fertiliser (Dalal et al. 2003) and so is a target of environmental concern. That said, spikes in release of N2O in Australian cropping systems are often associated with the incidence of summer rain after crop harvest (Barton et al. 2008, 2022) rather than release solely during the growing season when N is applied.
Historically, emissions associated with farmers’ use of N fertilisers have not formed part of their decision-making processes about use of N fertiliser. The traditional farm-management decision framework, as set out by Anderson et al. (1988) and Dillon and Anderson (1990), simply considers crop yield response functions and their accompanying costs and returns. The optimising mathematics that draw on these relationships and price data are as follows.
The crop yield (Y) is multiplied by the price of the crop (Pc) to generate crop revenue; the variable costs of cropping are the amount of N applied (N) multiplied by the price of N (Pn) plus other variable costs (VCother) not dependent on the amount of N applied. The resulting cropping gross margin (GM) is:
To maximise this gross margin requires:
In words, to maximise the gross margin, the N applied must ensure that dY/dN (the slope of the yield response function) is equated to the ratio of the price of N and the price of the crop. This traditional optimisation condition highlights that farmers should maximise the gross margin of crop production rather than maximise crop yield (Malcolm et al. 2009), and that there is a unique application rate that delivers highest profit.
But the economic response near the optimum is often fairly flat (Anderson 1975; Pannell 2006), and uncertainty and volatility in the price and yield relationships often applies (Gandorfer et al. 2011; Farquharson et al. 2016). These features of uncertainty, volatility and flatness led Pannell (2016) to argue that research or extension to recommend a particular N rate may not often be very beneficial to farmers (unless they are off the payoff plateau). More bluntly, Anderson (1975) said that for fertiliser decisions ‘precision is pretence and greater accuracy is absurdity.’ (p. 195).
The traditional farm-management decision framework outlined in the preceding equations assumes that farmers are solely motivated by profit gains. The framework overlooks farmers’ risk attitudes (Monjardino et al. 2015) where risk aversion is known to affect N application rates. Colaço and Bramley (2018) outline how the farmer’s decision about how much N to apply is a multivariate, often complex, risk-optimisation problem that needs to accommodate different weather and soil conditions. Also, and especially important in current circumstances, the traditional framework fails to incorporate the environmental costs of N use (Burton et al. 2003; Cameron et al. 2013; Pannell 2017).
In the absence of inclusion of emission ramifications in their use of N fertiliser, most cropping farmers in Australia employ a few different strategies in applying N fertiliser (Farquharson et al. 2016; Umbers 2021). Some farmers apply a single rate, whereas a majority use split applications where N fertiliser is applied at sowing or at mid–late tillering and then, depending on the seasonal conditions already experienced and the prospective outlook, a ‘top-up’ application occurs. If the season to-date is already poor or the outlook for grain-filling is poor, then extra fertiliser is not applied. The seasonally dependent split-application strategy of farmers is consistent with a state contingent style of farm management (Crean et al. 2013, 2015). This implies that farmers face different states of nature and make decisions contingent on their assessment of the likelihood of a particular state of nature unfolding. A case study application by Colaço et al. (2021) illustrates how farmers in coming years additionally may rely on sensor-based machine-learning to discern the nature of a current weather-year (i.e. state of nature) and may then use artificial intelligence to determine their N applications to crops. However, use of this technology was not a strategy considered in this study.
The increased use of applied N in crop production in Australia now means that N fertilisers comprise up to one-quarter of farmers’ input expenditures (Lemon 2007), and use of N has become a more important farm business decision. Adding to the commercial importance of N application decisions is the shift toward more crop-dominant farming systems in Australia (Kirkegaard et al. 2011), including Western Australia (Planfarm 2022), with farmers’ crop yields becoming increasingly dependent on applied N.
Drawing on the work of Pannell (2017) and Pannell et al. (2019), the current study seeks to identify the environmental impacts (i.e. on-farm and off-farm related greenhouse gas emissions) and profitability of different N application strategies that farmers may employ in different cropping systems in different production environments in Western Australia. The study’s purpose is to identify whether some N application strategies are superior to others in generating high profits without adversely increasing greenhouse gas emissions. Our study differs from other studies in that we consider all sources of emissions (i.e. scopes 1, 2 and 3 emissions as described later) rather than emissions solely generated on the farm due to applied N. By considering different locations, different cropping systems and different environments, the robustness of selection of each strategy can be determined. The study’s framework allows agriculturalists to establish which changes in N application strategies are likely to have the greatest impacts on emissions and land-use sequence gross margins.
Methods
This study compares through simulation the gross margins and emissions associated with four different nitrogen strategies. Additionally, and relevant to a strategy of applying a single application of N at crop sowing, this study examines the merits of using a decile 5 rainfall statistical forecast (see DPIRD 2023) to determine expected yield and its associated relevant N application. The study also incorporates price and weather-year variation in determining the preference for and robustness of selection of each N application strategy.
This methodology section is structured as follows. Briefly, the study region and the nature of its farming systems are described. Then the emissions (i.e. scopes 1, 2 and 3 emissions; GGP 2015) associated with crop production via use of N fertiliser are described. Last, the four broadly different N strategies are outlined and the methodology for determining the gross margin and emissions from their N fertiliser use are mentioned.
Study region
The south-west of Australia (Fig. 1) is one of Australia’s main broadacre agricultural regions. In 2022–23, the region produced 26.1 Mt of grain, predominately winter crops of wheat, barley and canola (GIWA 2023). The region supplies almost 40% of Australia’s winter crop production, annually generating over AU$10 billion of agricultural production, and is the nation’s principal grain export region. Almost all agriculture in the region is dryland agriculture, underpinned by a Mediterranean-type climate that supports winter cropping and annual pasture production for sheep enterprises.
A map of the south-west of Australia showing isohyets based on climatology 1981–2010. Source: Bureau of Meteorology. Available at http://www.bom.gov.au/jsp/ncc/climate_averages/rainfall/index.jsp?period=an&area=wa#maps.
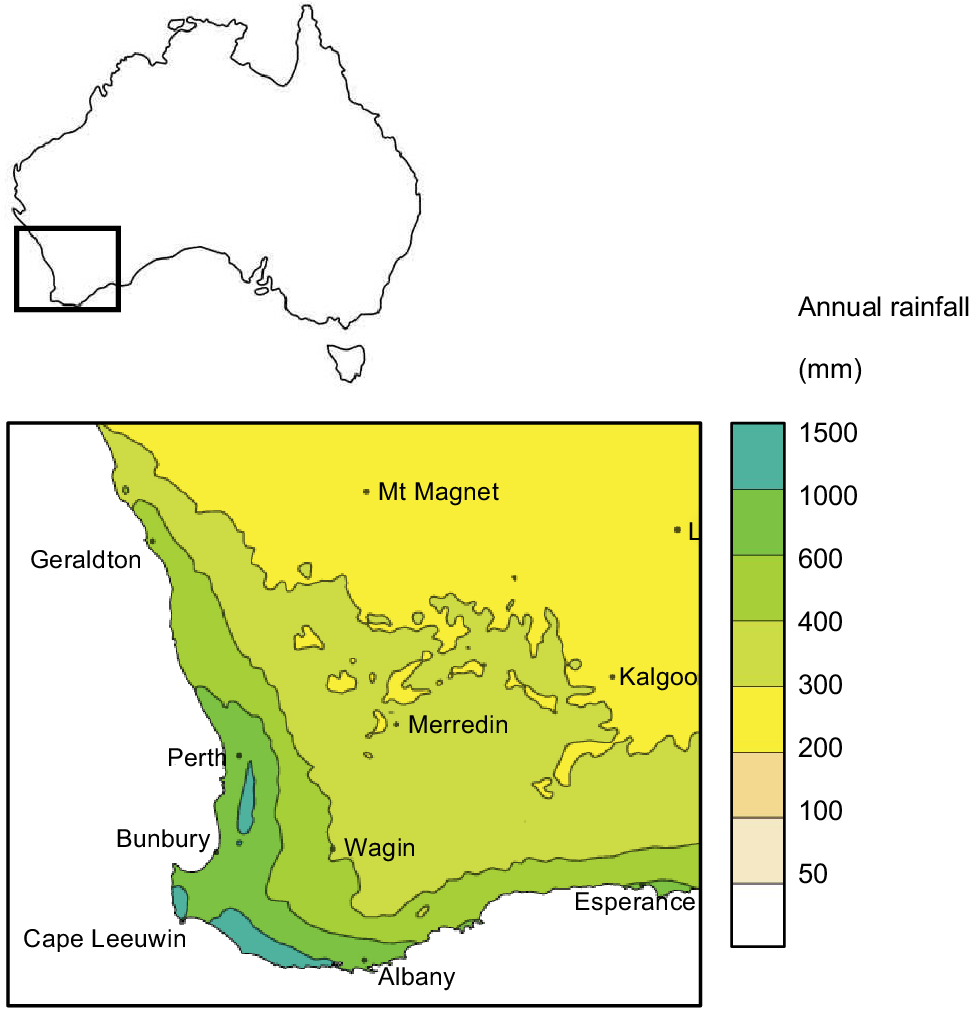
Farm size in the region is negatively correlated with annual rainfall, with large, crop-dominant farms located on the drier inland edges of the region. In these marginal fringes, annual rainfall is <300 mm and farm size is often >8000 ha. As reported by Umbers (2021), farmers in the marginal fringes are less likely to apply N post crop-planting and they apply much lower rates of N, despite N-fixing pastures playing a far lesser role in their farming systems. By contrast, in the most southerly, more reliable parts of the study region, Umbers (2021) notes that 73% of all N applied was applied post-planting in season 2021. Moving from the drier inland edges towards the coast sees increases in annual rainfall, reductions in farm size, higher rates of applied N, higher crop yields, and a higher proportion of N-fixing pastures in rotations. In the far south-west, near the coast, annual rainfall is as much as 1000 mm and small, mixed-enterprise farms under 500 ha are dominant. Sheep production more commonly features in farming systems in the more southerly, higher rainfall parts of the study region (Planfarm 2022).
By international comparison, farms in the study region are large in area. The Planfarm (2022) survey of 444 farm businesses across the study region revealed their average farm size to be 4628 ha. Farms in the region typically are highly labour-efficient, being run with fewer than four full-time labour equivalents, and most are owned and operated by farm families rather than large corporate entities. Over 90% of the region’s production of major grains, sheepmeat (including live sheep exports) and wool is exported; hence, international commodity prices importantly influence farmers’ crop and enterprise selections. The region’s current sheep population is ~14 million head.
The large size of farms and their continuing upward trend in size (Umbers 2021) often means farmers are time-pressed (Kingwell 2011), forcing them often to rely on simple decision rules for N rate applications. Yet small per-hectare gains from improved N rate application decisions can generate large financial impacts for the farm business, owing to the number of hectares of crop underpinning most farm businesses in the study region (Planfarm 2022).
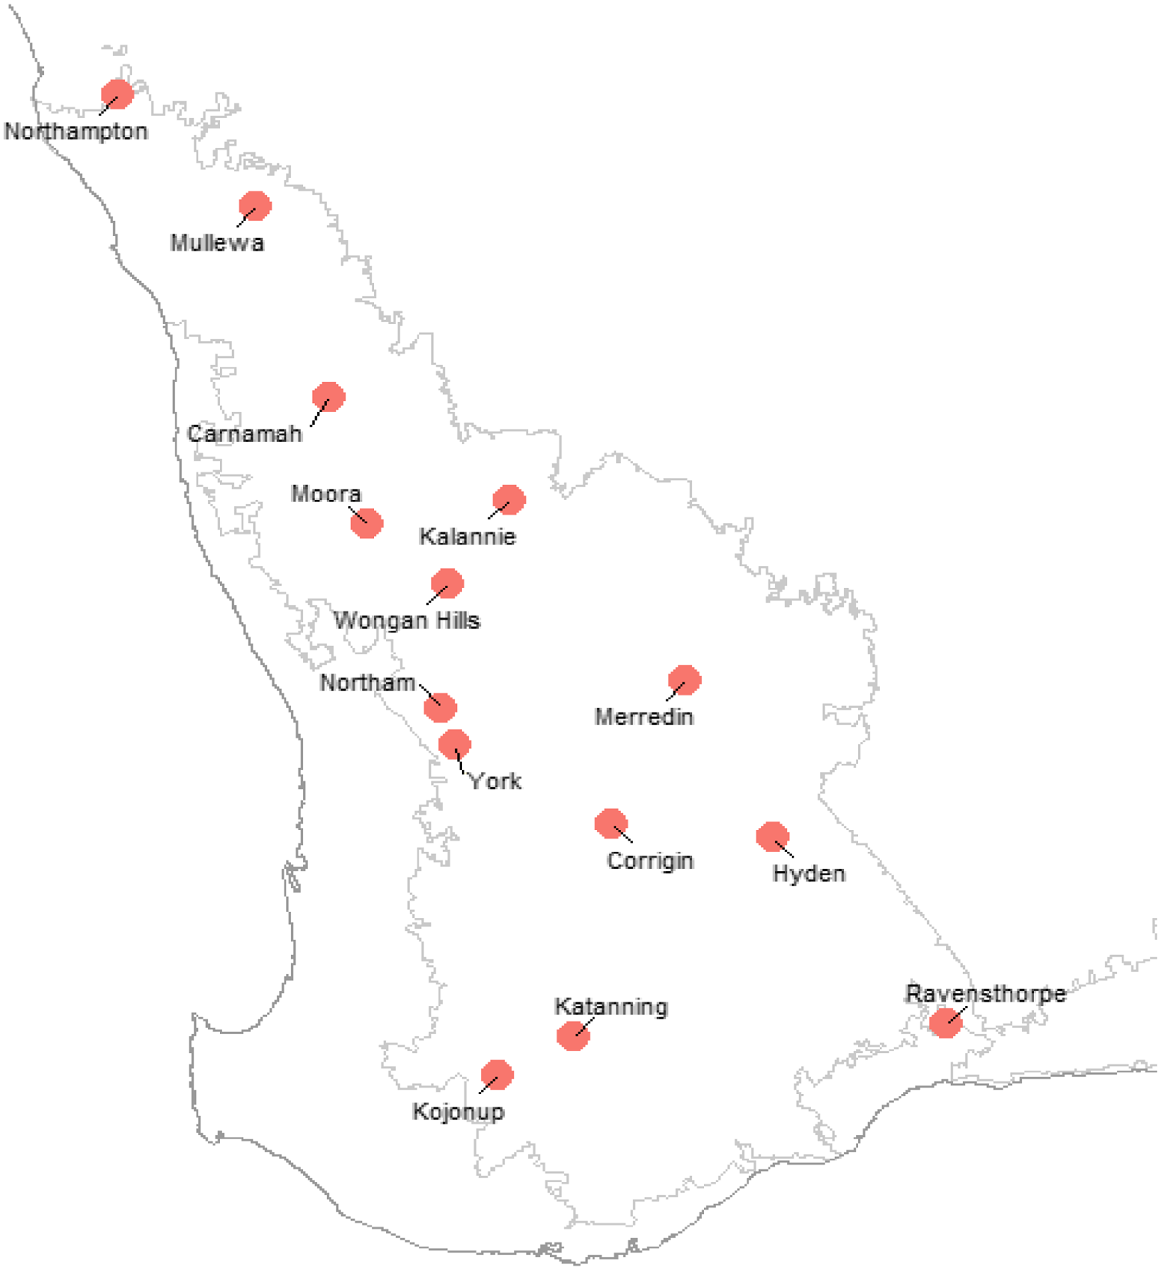
Within the study region (Fig. 1), 14 locations were selected to represent the geographic, edaphic and climatic diversity of the region (Fig. 2). These locations and their rotational options in farming systems with different magnitudes of cropping frequency (100%, 75% and 50%) were described using the farm model EVALUS (Economic Valuation of Alternative Land Use Sequences) (Kharel et al. 2022), which was specifically developed to describe farmers’ land uses in the study region. Appendix 1 (see Supplementary material) lists the range of rotations examined at each location for three levels of cropping frequency. Cropping frequencies of 50% and 75% enable N-fixing pasture to be part of land-use sequences, which enables lower rates of N fertiliser to be applied to crops planted after the preceding pasture phase. The different cropping frequencies also can affect the gross margins of the respective land-use sequences owing to rotational effects on yields, fertiliser and herbicide requirements; and the emission profiles of respective land-use sequences can differ.
The nature and construction of EVALUS is described in Kharel et al. (2022) as well as, briefly, in Appendix 1. It is a time-series model that describes the biology and financial characteristics of commonly observed land-use sequences at each location, on a range of soil types, and their associated scope 1, 2 and 3 emissions (as described in a subsequent subsection). The weather data at each site, used in estimating crop and pasture yields and capturing weather-year variation, come from SILO (i.e. Queensland Government’s Australia-wide Long Paddock database; see Queensland Government 2022).
EVALUS draws on 26 years of weather data and 19 years of price data but only uses a randomised 15-year subset for each location, allowing 15-year random sequences of net revenues and emissions to be generated for a range of land-use patterns that typify farming systems based on 100%, 75% and 50% cropping of farmland. All costs and returns are presented in constant 2020 dollar terms. The main input levels (herbicides, fungicides, fuel and oil, labour, repairs and maintenance, etc.) associated with particular crops and sequences of crops and pastures are based on observed practices and expenditures as reported by farm management consultants and expert opinion.
However, in practice, a range of farmer behaviour is likely at any location, so the values used in this study are best viewed as typical values rather than reflecting the likely spread of values at each location. Additional detail regarding EVALUS is contained in Appendix 1 and in a user manual (Kharel 2022).
Greenhouse gas emissions
The greenhouse gas emissions Protocol Corporate Standard (GGP 2015) classifies emissions into three scopes. For a farm business, scope 1 emissions are direct emissions from farm activities. Scope 2 emissions are indirect emissions from the generation of purchased energy (e.g. electricity or natural gas). Scope 3 emissions are indirect emissions (not included in scope 2) from the value chains linked to the farm, including both upstream and downstream emissions. Scope 3 emissions associated with dryland agriculture mostly comprise emissions embedded in the production of fertilisers, other agricultural chemicals and supplementary purchased feed. In addition, the proximity of the farm to its sources of inputs, or its distance from the users of the farm’s commodities, and the extent of the processing and packaging of the farm inputs and outputs can also affect the magnitude of scope 3 emissions.
In EVALUS, greenhouse gas emissions associated with any selected land-use sequence and associated N application strategy are based on the PICCC’s (Primary Industries Climate Change Centre) Sheep and Beef Greenhouse Gas Accounting Framework (SB GAF) and the Cropping Greenhouse Gas Accounting Framework (C GAF) (see https://www.piccc.org.au/resources/Tools). Lopez et al. (2022, 2023) provide further detail. In this study, results are presented inclusive of all emissions (i.e. scopes 1, 2 and 3) because we are interested to see which N strategies are preferred to generate high gross margins for farmers while also contributing least to emissions associated with crop production but generated from on-farm and off-farm sources. The PICCC accounting framework is the one recommended for farm applications by the Department of Primary Industries and Regional Development and it is also used by Aglytica, a major commercial advisory business that operates throughout the study region.
The emissions accounting framework used is increasingly applied in Australian settings and provides a uniform basis for comparisons; nonetheless, the recent findings of Barton et al. (2022) are worth noting to form a caveat to the results we report here. They highlight the uncertainty about the magnitude of actual emissions associated with use of N in different agricultural settings and they conclude: ‘Long-term studies investigating all key soil N supply and loss pathways and using a combination of field-based measurements, laboratory-based process studies, and modelling are required to advance our understanding of soil N supply and losses from contemporary and future dryland cropping systems in Australia.’ (p. 1). Hence, the N emission factors applied in the present study are best viewed as the state of current knowledge, but the factors may change in light of subsequent studies such as recommended by Barton et al. (2022).
The purposeful inclusion of scope 3 emissions arises from the growing commercial focus for all businesses, including farm businesses, to reveal through product branding or formal reporting their commitment to ESG (environmental, social, governance) or sustainability principles (Allen et al. 2019; McRobert et al. 2022).
Nitrogen application strategies
Four broadly different N application strategies are contrasted against perfect foresight in three different levels of cropping frequency (i.e. land-use sequences involving 50%, 75% and 100% cropping) at a range of locations. Perfect foresight assumes the hypothetical situation where the farmer is omniscient, having foreknowledge of the weather-year, the yield response to N, and the cost and price environment that govern N applications. In perfect foresight, the N rate ex post that achieves the highest gross margin is selected when the pattern and amount of rainfall is known, as are the other sources of N, the price of N, and the final price of the harvested grain.
The four other N application strategies are:
A fixed ratio (FR): a tonne of expected cereal receives 45 units of N from various sources and a tonne of expected canola also receives 70 units of N from various sources. The expected yield of each crop at each location is derived from the assumed rainfall expectation at the location.
Agronomic target (AT): here the decision goal is to apply sufficient N to maximise crop yield given water availability and the soil characteristics.
Economic target (ET): the assumed decision goal for N application is to maximise the gross margin of crop production.
A constant rate (CR): the model applies various fixed amounts of N regardless of the crop’s potential yield, with N being applied solely at sowing. Six constant rates are considered, ranging from low to very high rates of N application.
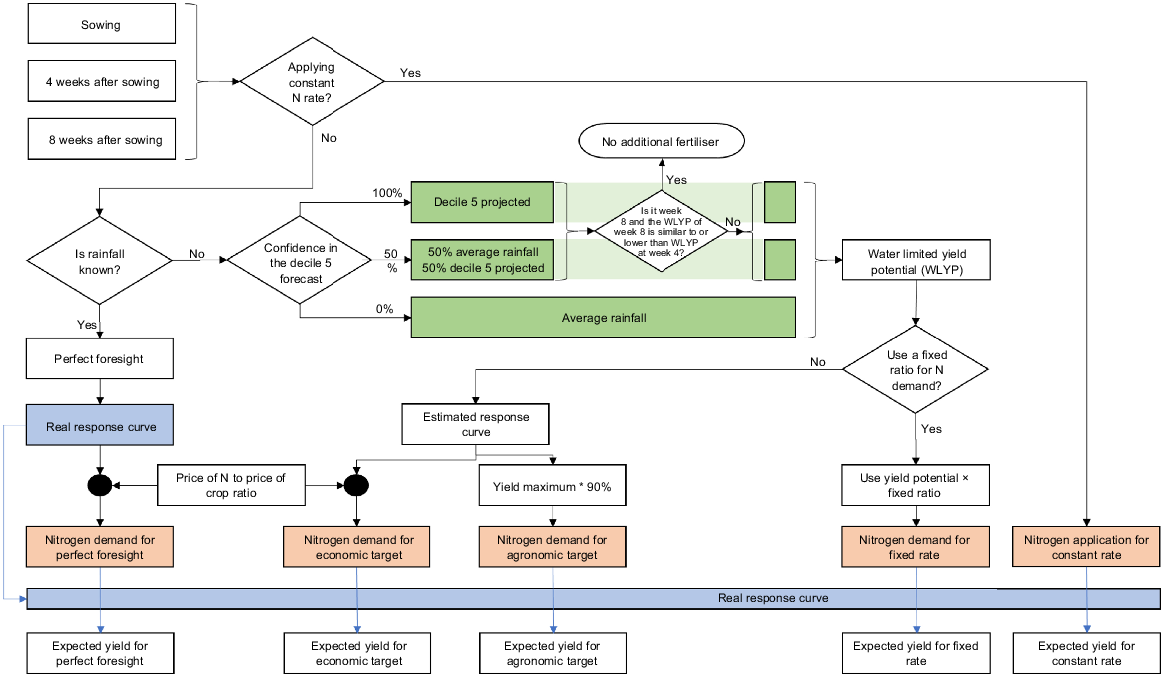
The first three of these strategies rely on the farmer’s perception of the unfolding weather-year conditions. As listed in Table 1, the N level selected within these three strategies depends on the farmer’s confidence in the decile 5 forecast, as illustrated by DPIRD (2023).
| Confidence in the decile 5 statistical forecast | N application strategy | ||||
|---|---|---|---|---|---|
| (1) Fixed ratio (FR) | (2) Agronomic target (AT) | (3) Economic target (ET) | (4) Constant rate (CR) A | ||
| 100% (i.e. complete confidence) | ✓ | ✓ | ✓ | 25, 50, 75, 100, 125, 150 (kg N/ha) | |
| 50% | ✓ | ✓ | ✓ | ||
| 0% (i.e. no confidence) | ✓ | ✓ | ✓ | ||
The decision pathways associated with each N application strategy are outlined in Fig. 3. The various N strategies are described in greater detail in Appendix 2 (see Supplementary material).
Umbers (2021) reported on farmers’ N strategies in the study region. He noted that farmers’ N application strategies depended on their farm location but that 47–77% of farmers surveyed used a yield target when determining their N application rate. Only 27% of farmers surveyed used a decision support tool to aid their N application decision. Within the study region, a further examination of farmers’ N application histories by Harries et al. (2021) found that N inputs via fertiliser or biological N fixation in 60% of farmers’ fields were inadequate to balance exports, despite increases in fertiliser usage and adjustments to fertiliser inputs based on rotations.
In this study, we estimated yield outcomes from the various N application strategies for cereal and canola crops by using the bioeconomic simulation model SYN (Select Your Nitrogen) (Bowden and Diggle 2003). SYN was originally developed as an Excel-based model. It accounted for soil type, paddock history, organic carbon, seasonal rainfall pattern, source of N fertiliser, time of N application, potential yield of each crop, and cost of fertilisers to generate expected N response curves for yield, protein (in the case of wheat) and returns net of fertiliser cost.
SYN generates response curves for a range of yield potentials and N application strategies for canola and cereal crops. Since its creation, SYN has been regularly updated and is more readily available as ‘N Broadacre’ – an iTunes app based on the original SYN model. Crops in the study region are rainfed; hence, crop potential yield mostly depends on growing-season rainfall, which in turn mostly affects plant-available water (PAW), a key variable in SYN. As the region’s predominantly sandy soils poorly store rain received prior to crop sowing, PAW often mostly depends on growing-season rainfall, although at some locations with clay soils, rainfall before crop sowing can increase PAW and therefore affects the N response. Additional detail about the SYN model used in this study is given in Appendix 1.
For the CR strategy (i.e. strategy 4), at the time of sowing, one of six fixed rates of N is applied to all cereal phases of rotations and canola crops, irrespective of all variables that otherwise might be expected to affect the N application decision. For farmers, the CR strategy is the most naïve and simple strategy to implement; it is often referred to as a ‘set and forget’ strategy.
All other N application strategies depend on the farmer’s underlying climate or seasonal expectations. Explaining further, in the N application strategies FR, AT and ET (i.e. strategies 1, 2 and 3), some farmers might apply N consistent with their expectation that each year will be an average weather-year where the amount of effective rainfall (i.e. pre-sowing and growing-season rainfall) is the average recorded over the prior 30 years, based on site-specific SILO data (Queensland Government 2022). Depending on their goal, these farmers would apply N rates to cereals and canola, at sowing and at subsequent tactical intervals, that first were consistent with rainfall in an average weather-year, and second would either generate maximum yield (strategy 2) or maximum profit (strategy 3), or be based on some proportional ratio of expected crop yield (strategy 1).
Other farmers may apply N consistent with the rainfall to date and a projected decile 5 rainfall pattern. The projected decile 5 methodology is described and illustrated by DPIRD (2023). In this case, the farmers would apply 30% of N at sowing, given the actual pre-sowing rainfall and a projected decile 5 rainfall for the rest of the growing season. But the farmer would subsequently tactically apply additional N at 4 and 8 weeks after sowing at levels consistent with their expectation that a projected decile 5 rainfall year would subsequently unfold. Applying SYN, the levels of N selected would be those consistent with projected decile 5 rainfall and consistent with the farmer’s desire either to maximise yield (strategy 2) or profit (strategy 3), or to follow the ratio application mandate of strategy 1.
In addition, for completeness, we assume that there is a final group of farmers whose rainfall expectation is that each year will be neither an average rainfall weather-year nor an unfolding projected decile 5 rainfall year. Rather, they have a balanced 50:50 expectation – a foot in each expectation camp upon which their N application decisions are based. In practice, farmers’ rainfall expectations are likely to be influenced by their confidence in seasonal forecasts and the perceived value of those forecasts (Hammer et al. 1996; Marshall et al. 1996; Petersen and Fraser 2001; Meza et al. 2008). Often these studies reveal only modest value from using seasonal forecasts.
EVALUS is used to simulate the crop yields, the associated gross margins and emissions for each of the N application strategies over a randomly generated 15-year series of weather-years and prices. In many of the subsequently presented charts of results, two sets of 15-year sequences are used so that 30 points describe the outcomes associated with each N strategy at each of the 14 locations in the study region (Fig. 2) and for three different frequencies of cropping land use (50%, 75% and 100% cropping). Often each chart displays the emission or gross margin findings associated with the range of N strategies applied at each of the 14 locations for a set of 30 randomised observations of weather-years and prices. More detail about the various N strategies and how they are modelled is given in Appendix 2.
Results and discussion
Key sites
Typical of results generated are those presented in Fig. 4 for Mullewa, Cunderdin and Kojonup. Mullewa is a low-rainfall site in the north of the study region. Cunderdin is a medium-rainfall site in the centre of the study region, and Kojonup is a high-rainfall southern location where crop yields are higher and canola is a more frequent component of cropping sequences.
Scope 1, 2 and 3 emissions and gross margins of five N strategies for 30 randomised selections of weather-year and price sequences for 75% cropping land-use sequences at (a) Mullewa (MUL), (b) Cunderdin (CUN) and (c) Kojonup (KOJ). The N strategies: PF, perfect foresight; FR, fixed ratio of N applied to in prospect yield; AT, agronomic target yield; ET, economic target; CR, constant or uniform rate of applied N. The oval shapes are constructed as follows for each N strategy: step 1, calculate the difference between the 75th and 25th percentile for emissions; step 2, calculate the same for gross margins; step 3, calculate the median values for emissions and gross margins; step 4, construct an oval shape using the median values as its centre, and with the emissions interquartile range as the vertical diameter, and the gross margin interquartile range as the horizontal diameter (if needed, slightly rotate the oval to capture more fully the interquartile range of the sample). C, confidence in decile 5 forecast.
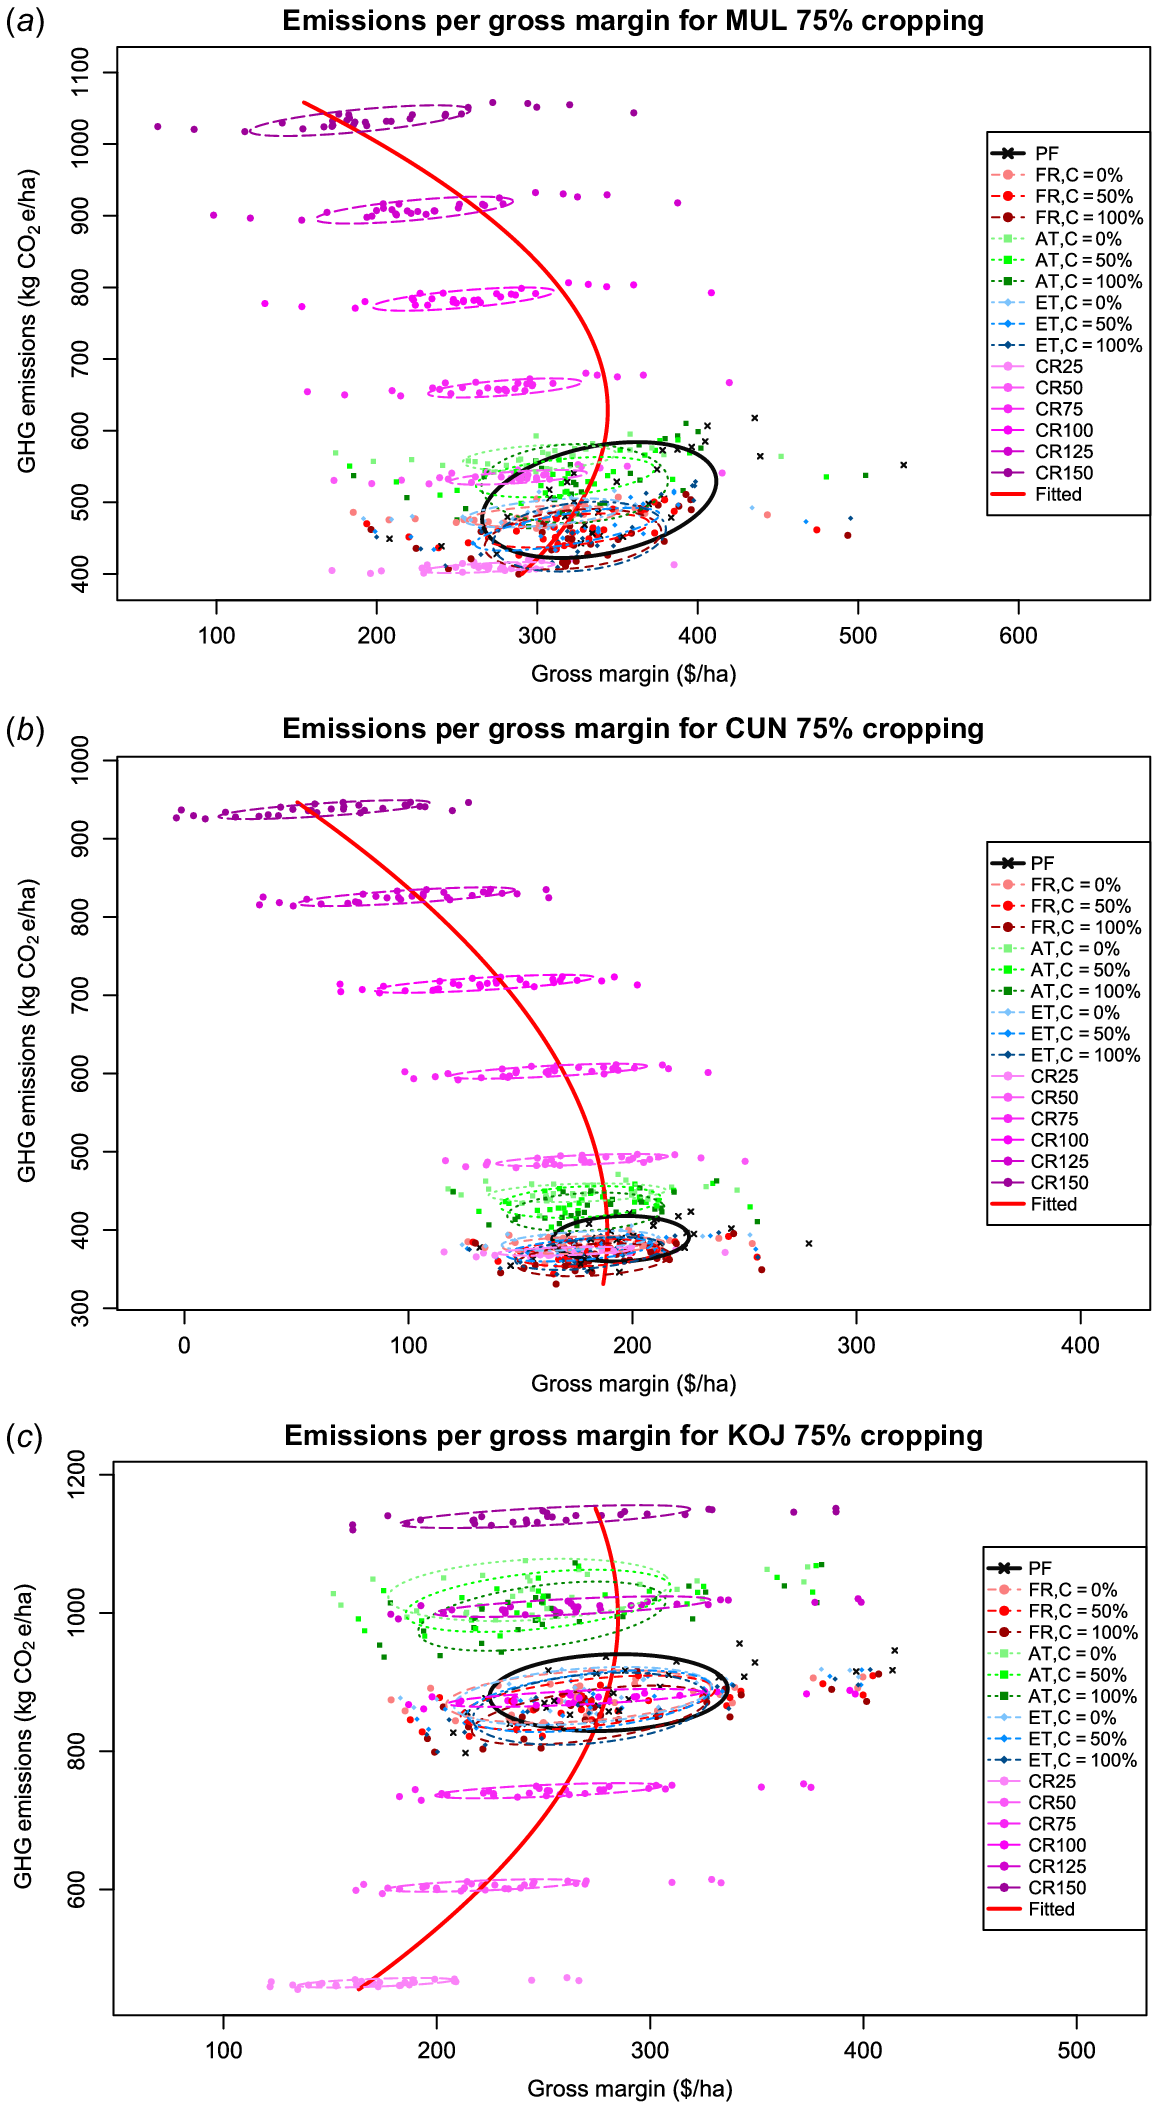
For each location, the emission or gross margin outcomes associated with all of the various N strategies considered in this study are shown and are based on a set of 30 randomised observations of weather-years and prices. Each oval shape of data points contains those that reside between the first quartile and the third quartile of emissions and gross margins.
Understandably, gross margins and emissions per hectare of crop are greater at the high-rainfall location of Kojonup. Its higher rainfall supports higher crop yields and encourages higher rates of applied N, which generate greater emissions per hectare of crop but also higher gross margins per hectare of crop. However, owing to weather-year and price variation, there is also a large spread in gross margins. Interestingly, emissions and gross margins at Cunderdin are slightly less than at Mullewa, despite Mullewa receiving less rainfall on average. The locational differences are due to frost being more problematic on the shallow duplex soils that are more prevalent in Cunderdin. Frost reduces crop yields and makes N applications less effective. By contrast, Mullewa mostly has deep sands that facilitate crop production even in low-rainfall years.
Comparison of N strategies
Results for other locations not shown in Fig. 4 are listed in Appendix 3 (see Supplementary material). Drawing on the results in Fig. 4 and Appendix 3, findings about N strategies are as follows. Most CR strategies that involve very high or very low rates of applied N are inferior because they generate far lower gross margins. In addition, at very high rates of routinely applied N, wasteful high emissions are generated. These CR strategies apply fixed amounts of N regardless of the crop’s potential yield or the cost of N or price of the crop. As naïve, simplistic strategies, they can lead a farmer off the payoff plateau (Pannell 2016), therefore serving neither the farmer’s commercial interests nor the wider environment through excessive emissions. In practice, some farmers may conservatively employ a strategy of applying very low rates of applied N, but this would generate little profit. Farmers in very weak financial situations who may be constrained to apply very low rates of applied N currently form a very small proportion of the farmer population (Planfarm 2022).
By contrast, as shown by the congested ovals of results at each location, there is often a portfolio of strategy options that generate similar favourable outcomes for gross margins and emissions. The wide variation in weather-years and prices leads to a wide variation in the distribution of gross margins, as shown by the elongated shapes of the ovals. However, the thinness of the ovals also reveals that the strategies most preferred based on their gross margins generate a narrow range of low or modest emissions. These preferred N strategies indicate that it is feasible to select a strategy that in prospect delivers preferred levels of gross margins but also low or modest emissions. However, it is not possible to select in advance each year the N strategy that achieves the greatest gross margin and lowest emissions in that year.
As discussed by Anderson (1975), Monjardino et al. (2015), Farquharson et al. (2016) and Pannell (2016, 2017), many factors limit or affect a farmer’s ability to determine the N rate that ensures either maximum gross margins, or maximum gross margins subject to a limitation on emissions. Nonetheless the results in Fig. 4 and Appendix 3 do indicate that several strategies exist that are likely to achieve attractive or preferred levels of gross margin without creating excessive emissions. Moreover, these strategies are preferred irrespective of the crop dominance of the land-use sequences (i.e. 50%, 75% and 100% cropping). The insensitivity to the farming system’s crop dominance is a useful practical finding because it indicates that the preferred N strategies can be uniformly applied across cropping sequences.
The congestion of ovals in Fig. 4 and Appendix 3 arises from the flatness of the yield response function to applied N (Pannell 2006). Flat payoff functions indicate a range of similar commercial rewards arising within a broad range of applied N. In short, farmers face a weak economic incentive to alter N levels to drive them towards the economic optimum, which importantly in practice is not known at the time of applying N. That said, in years when weather conditions support very high yields, the payoff from higher rates of applied N can be substantial. Conversely, in years when weather conditions support only low yields, the payoff from higher rates of applied N can be minimal. The set of strategies likely to be preferred at many locations, assuming a farmer is interested in achieving high gross margins while avoiding high emissions, includes strategies 1, 2 and 3 (i.e. FR, AT and ET strategies). Even the CR strategy of applying 50 or 75 kg N/crop ha offers reasonably attractive outcomes at a majority of locations.
Exactly how closely the strategies rank against one another with respect to gross margins and emissions is shown in Figs 5 and 6 and Appendices 3 and 4 (see Supplementary material). As with Fig. 4, Mullewa, Cunderdin and Kojonup are used as illustrations of locations.
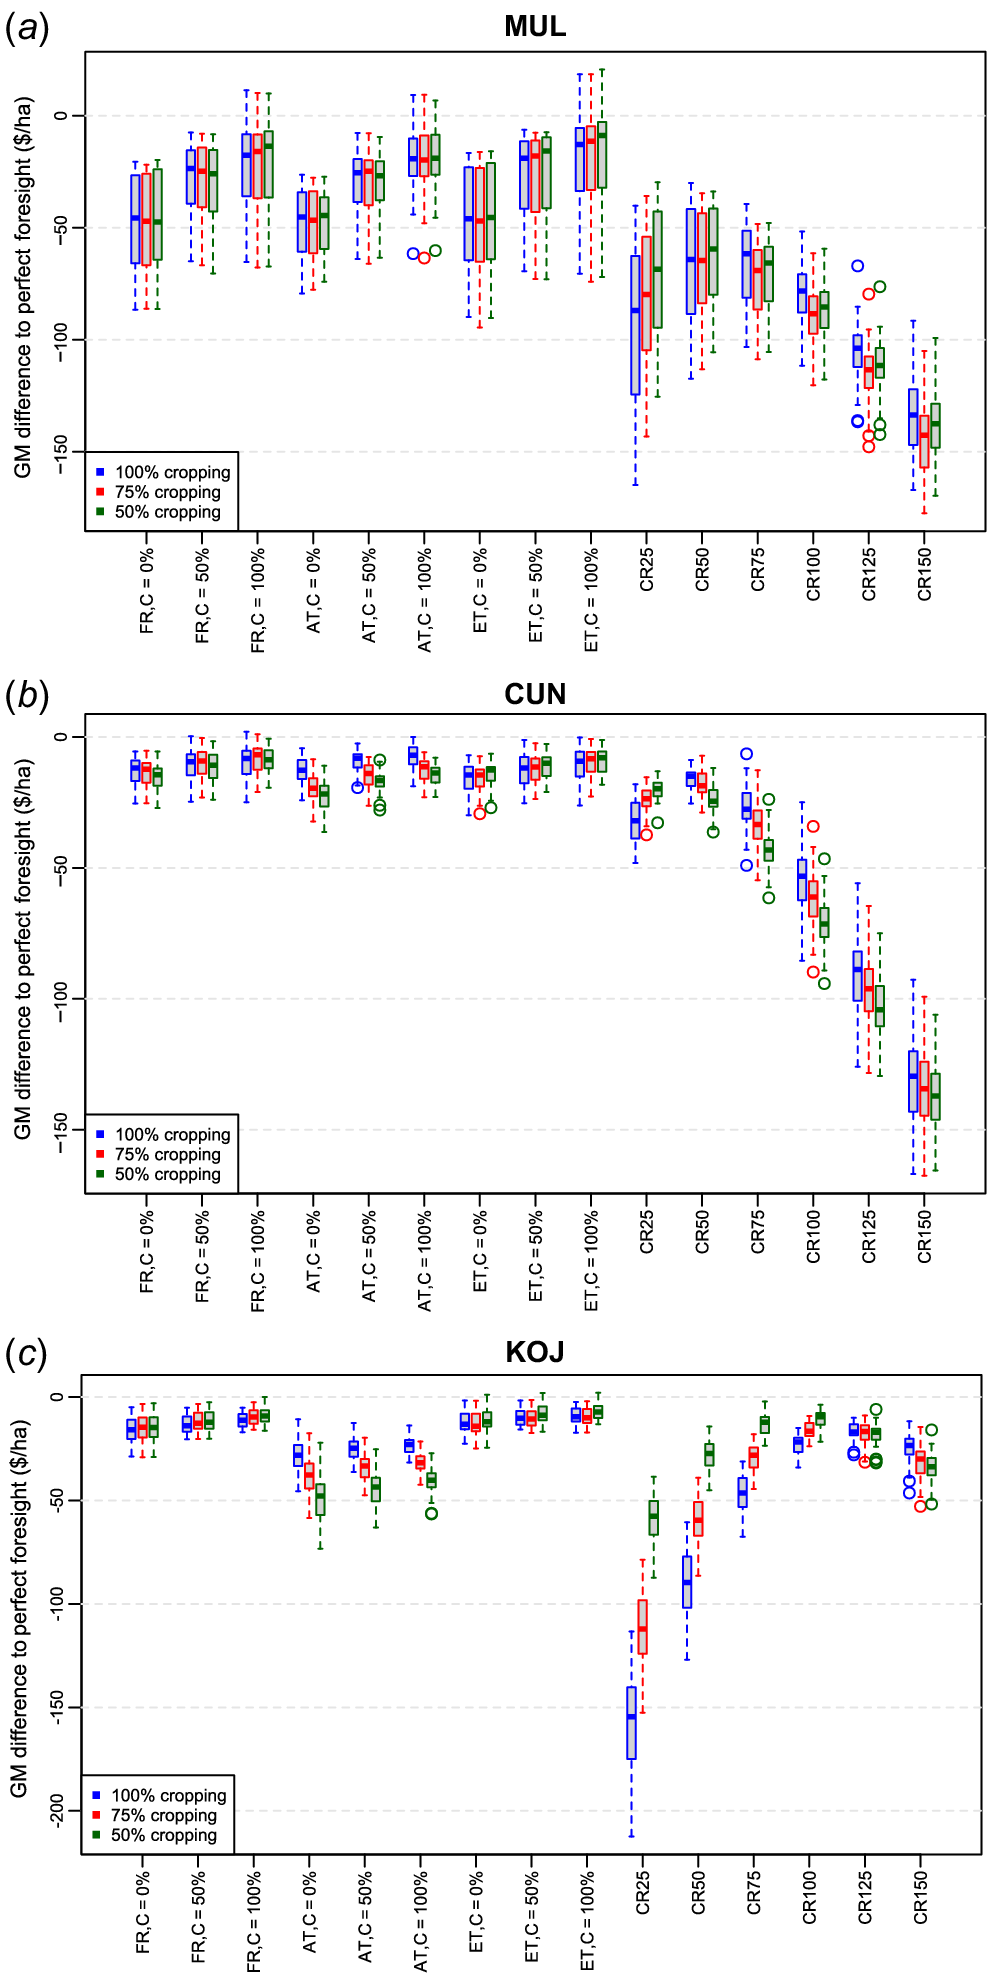
Nitrogen strategy gross margins for 30 randomised selections of weather-year and price sequences compared against perfect foresight at (a) Mullewa (MUL), (b) Cunderdin (CUN) and (c) Kojonup (KOJ). Data are presented as box and whisker charts, in which the centre value is the median. The start and finish of each whisker are the 25th and 75th percentiles. The N strategies are applied to cropping sequences that typify farming systems having 50%, 75% or 100% of land use devoted to crops. FR, fixed ration; AT, agronomic target; ET, economic target; CR, constant rate; C, confidence in decile 5 forecast.
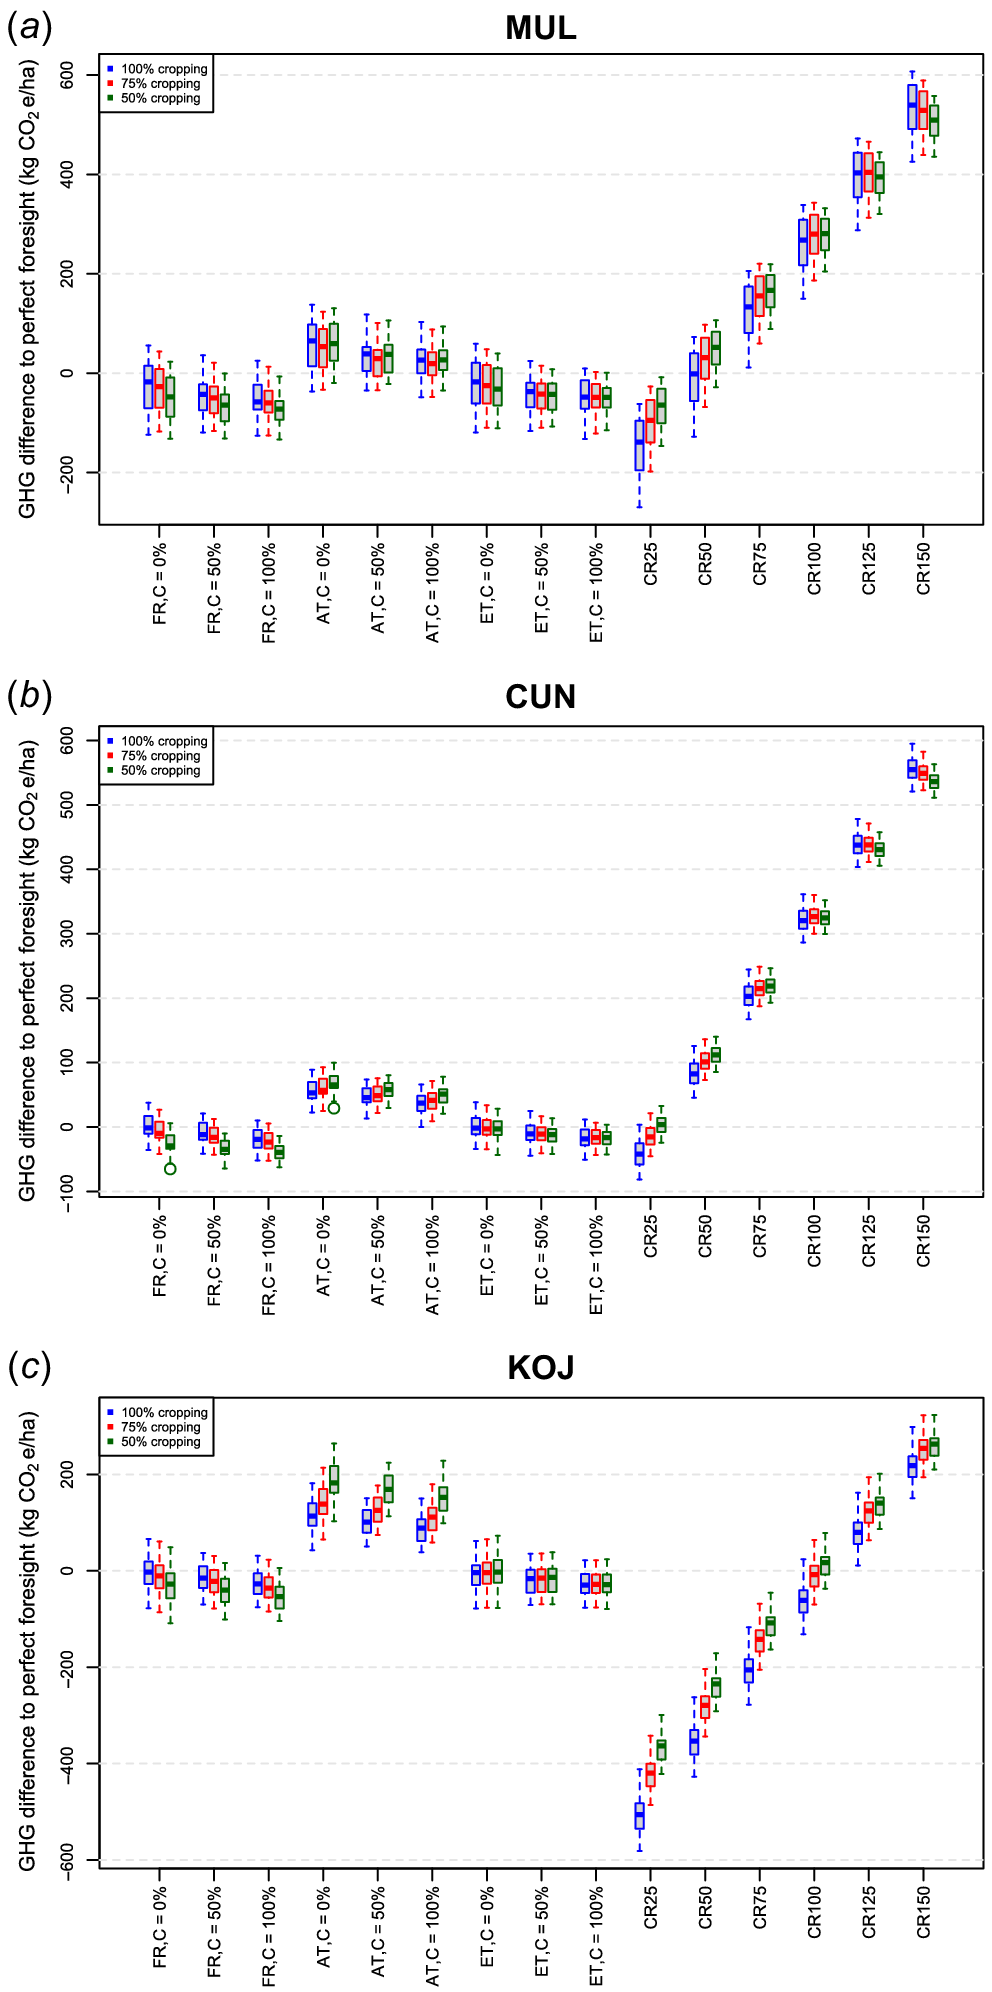
Nitrogen strategy emissions for 30 randomised selections of weather-year and price sequences compared against perfect foresight at (a) Mullewa (MUL), (b) Cunderdin (CUN) and (c) Kojonup (KOJ). Data are presented as box and whisker charts, in which the centre value is the median. The start and finish of each whisker are the 25th and 75th percentiles. The N strategies are applied to cropping sequences that typify farming systems having 50%, 75% or 100% of land use devoted to crops. FR, fixed ration; AT, agronomic target; ET, economic target; CR, constant rate; C, confidence in decile 5 forecast.
The N strategies that apply constant, very high rates or very low rates of N are consistently revealed as commercially inferior strategies. However, at some locations such as Cunderdin or Katanning and York (see Appendix 3), the ‘set and forget’ rates of either 50 or 75 kg N/crop ha generate gross margins that are close to the highest gross margins associated with some other more complex N application strategies. Hence, for some time-pressed crop managers at some locations, reliance on these naïve strategies may be economically rational and appropriate to the needs of the farm business.
However, the N strategies that consistently produce gross margins most close to perfect foresight often involve strategy 3 (ET), which focuses on the economic target of maximising the gross margin of crop production. Basing that strategy on a decile 5 view of unfolding seasonal conditions, rather than assuming the unfolding of an average year, can slightly or greatly lift gross margins. The same finding applies to strategy 1 (FR) of a fixed ratio where 45 units of N are applied from various sources per expected tonne of cereal and 70 units of N per expected tonne of canola, with the expected yield based on the farmer’s assumed seasonal rainfall expectation.
Importance of GM differences
Although the magnitude of gross margin differences between some N strategies may not appear large (e.g. <$10/ha) it needs to be remembered that farm size in the study region is large (Planfarm 2022) and most farms run crop-dominant farming systems. For example, it is not unusual for a farm’s annual cropping program to involve sowing 3000 ha. Hence, over 5 years, a slightly superior N strategy could generate $150 000 in additional profit (i.e. 3000 ha × $10/ha × 5 years = $150 000). Farmers in the region already acknowledge that one key to commercial success is attention to detail – making small beneficial changes that in aggregate eventually deliver sizeable gains (Kirk 2013; Kingwell 2023). Hence, adoption of an N strategy or tactic that generates seemingly small gains in gross margin, when aggregated across an entire cropping program and summed over several production years, can greatly add to farm wealth. That said, as previously mentioned, farmers are often-time pressed, and so incremental decisions such as adjusting the N rate strategy or tactic might be overlooked in favour of more substantial strategic and tactical decisions that may deliver higher or more certain returns.
As shown in Fig. 6, the added advantage of N strategies 1 and 3 (i.e. FR and ET), which produce gross margins most close to perfect foresight, is that these strategies also produce fewer emissions relative to perfect foresight. Hence, when these strategies are adopted, even if the user’s focus is solely on gross margin, the beneficial environmental outcome is often slightly fewer emissions than perfect foresight. Moreover, even if the emissions reductions are slight, when aggregated across all crop areas and across a sequence of weather years, the aggregate environmental benefits may be significant.
In contrast to strategies 1 and 3, constant high rates of applied N (strategy 2, AT), often seeking to maximise crop yield, result in enhanced emissions.
Implications and caveats
There are useful policy implications of the results presented in Figs 5 and 6 and Appendices 3 and 4. First, the N strategies that achieve slightly lower gross margins than occur with perfect foresight also often generate fewer emissions. Hence, there is no need to subsidise these strategies to achieve environmental benefits because these benefits arise as useful by-products of a focus on gross margins. In short, there is already sufficient economic incentive to embrace these environmentally advantageous N strategies. Moreover, if ever consumer markets offer price premiums for low-emissions grain-based foods, then these additional financial incentives will encourage even more widespread adoption of these N application strategies that generate fewer emissions. Second, for farmers reliant on ‘set and forget’, high constant rates of applied N, there is a potential role to educate them about the opportunity to increase their gross margins while simultaneously reducing emissions arising from N use (Hochman et al. 2009; Monjardino et al. 2013). The outcomes are more profitable crop production and reduced pressures on farmers’ social licence to operate that arise from negative views about farmers polluting the environment through excessive applications of N fertilisers. Third, as previously mentioned, the insensitivity of the preferred N strategies to the degree of crop dominance in land-use sequences is a useful practical finding because it indicates that the preferred N strategies can be uniformly applied across a range of crop sequence frequencies.
A caveat on all these the findings is that the analysis assumes that the N fertilisers used by farmers are those in most current use. However, an opportunity in coming years is for greater use of polymer-coated fertilisers (Blaylock et al. 2005; Hyatt et al. 2010; Adams et al. 2013; Buss 2016; Hopkins 2016). Depending on their costliness and effectiveness, these low-emission fertilisers could enable the joint achievement of high yields of crops and lower emissions.
Another caveat is that there are other N strategies not examined in this study. For example, it could be argued that farmers should use seasonal forecasts in determining their N applications rather than decile 5 or average-year perceptions. However, Guthrie and Evans (2018) examined 37 weather-years (1981–2017) in the study region and found little economic benefit from using forecast July–September rainfall rather than the historic median rainfall to estimate potential yield when determining N rates. Other studies (Asseng et al. 2012; McIntosh et al. 2015) indicate that the seasonal outlooks may provide more value in determining initial N applications at seeding times in April and May, when the seasonal outlooks have relatively more skill in indicating May rainfall, but not rainfall in subsequent months. The greater adoption of dry sowing in the study region (Fletcher et al. 2016) suggests that greater use of seasonal forecasts is warranted.
A further caveat is that the modelling approach used in this study does not capture infrequent, episodic events at most locations that generate spikes in N2O emissions and that affect subsequent N cycling. Barton et al. (2015) point out how N2O fluxes vary spatially and differ daily in response to multiple factors that regulate N2O production, consumption and emission. One ramification is that the range in emissions reported in this study may in practice be greater than indicated by this study’s findings.
A final caveat is the one mentioned near the start of this paper. Emission factors used in this study may be subject to change in coming years as more information is gathered on N processes and in situ emissions at more locations and from various weather-years. For example, Barton et al. (2015) conclude that inadequate field sampling frequency likely causes current global estimates of N2O fluxes to be inaccurate.
Conclusion
This study examines a range of N application strategies applied to various cropping sequences at 14 locations across the agricultural region of the south-west of Australia. The predicted gross margins and greenhouse gas emissions (scopes 1, 2 and 3) of those N applications are presented against the backdrop of weather-year and price variation.
The principal conclusion drawn from the analyses of the various N application strategies is that there is a preferred subset of N strategies that consistently deliver high gross margins, yet also produce relatively low or moderate emissions. These preferred N strategies achieve slightly lower gross margins than perfect foresight but also often generate fewer emissions. The preferred strategies often focus on maximising the gross margin of crop production, with that strategy being underpinned by a decile 5 view of unfolding seasonal conditions. A similarly useful strategy applies N in a fixed ratio where 45 units of N are applied per expected tonne of cereal and 70 units of N per expected tonne of canola. Where a farmer may prefer to apply a constant rate of N, then exceedingly high or low rates of application should mostly be avoided, with the better option being to apply 50 or 75 kg N/crop ha, depending on the farm location.
Even though altering an N application strategy may generate relatively small gains in gross margin or seemingly small reductions in emissions, it needs to be noted that, annually, an area of almost 9 Mha is sown to crops in the study region. Hence, small gains in gross margins, or small reductions in emissions, when multiplied by the many hectares of crops and the many years of crop production, can deliver a large flow of additional profits and emission savings to the agricultural region.
Data availability
The data that support this study will be shared upon reasonable request to the corresponding author.
Declaration of funding
This research was supported with funding from the Grains Research and Development Corporation, the Western Australian Farming Systems project, and the Western Australian Government Climate Action policy program.
References
Adams C, Frantz J, Bugbee B (2013) Macro- and micronutrient-release characteristics of three polymer-coated fertilizers: theory and measurements. Journal of Plant Nutrition and Soil Science 176(1), 76-88.
| Crossref | Google Scholar |
Allen C, Metternicht G, Wiedmann T, Pedercini M (2019) Greater gains for Australia by tackling all SDGs but the last steps will be the most challenging. Nature Sustainability 2, 1041-1050.
| Crossref | Google Scholar |
Anderson JR (1975) One more or less cheer for optimality. The Journal of the Australian Institute of Agricultural Science 41(3), 195-197.
| Google Scholar |
Asseng S, McIntosh PC, Wang G, Khimashia N (2012) Optimal N fertiliser management based on a seasonal forecast. European Journal of Agronomy 38, 66-73.
| Crossref | Google Scholar |
Barton L, Kiese R, Gatter D, Butterbach-Bahl K, Buck R, Hinz C, Murphy DV (2008) Nitrous oxide emissions from a cropped soil in a semi-arid climate. Global Change Biology 14, 177-192.
| Crossref | Google Scholar |
Barton L, Wolf B, Rowlings D, Scheer C, Kiese R, Grace P, Stefanova K, Butterbach-Bahl K (2015) Sampling frequency affects estimates of annual nitrous oxide fluxes. Scientific Reports 5, 15912.
| Crossref | Google Scholar | PubMed |
Cameron KC, Di HJ, Moir JL (2013) Nitrogen losses from the soil/plant system: a review. Annals of Applied Biology 162, 145-173.
| Crossref | Google Scholar |
Colaço AF, Bramley RGV (2018) Do crop sensors promote improved nitrogen management in grain crops? Field Crops Research 218, 126-140.
| Crossref | Google Scholar |
Colaço AF, Richetti J, Bramley RGV, Lawes RA (2021) How will the next-generation of sensor-based decision systems look in the context of intelligent agriculture? A case-study. Field Crops Research 270, 108205.
| Crossref | Google Scholar |
Crean J, Parton K, Mullen J, Jones R (2013) Representing climatic uncertainty in agricultural models – an application of state-contingent theory. Australian Journal of Agricultural and Resource Economics 57(3), 359-378.
| Crossref | Google Scholar |
Crean J, Parton K, Mullen J, Hayman P (2015) Valuing seasonal climate forecasts in a state-contingent manner. Australian Journal of Agricultural and Resource Economics 59(1), 61-77.
| Crossref | Google Scholar |
Dalal RC, Wang W, Robertson GP, Parton WJ (2003) Nitrous oxide emission from Australian agricultural lands and mitigation options: a review. Australian Journal of Soil Research 41, 165-195.
| Crossref | Google Scholar |
DPIRD (2023) Rainfall to date tool for Western Australia. Department of Primary Industries and Regional Development, Perth, WA, Australia. Available at https://www.agric.wa.gov.au/climate-weather/rainfall-date-tool-western-australia/
Easton ZM, Petrovic AM (2004) Fertilizer source effect on ground and surface water quality in drainage from turfgrass. Journal of Environmental Quality 33(2), 645-655.
| Crossref | Google Scholar |
Farquharson R, Chen D, Li Y, Liu DL, Ramilan T (2016) Nitrogen decisions for cereal crops: a risky and personal business. In ‘Solutions to improve nitrogen use efficiency for the world. Proceedings of the 2016 International Nitrogen Initiative Conference’. 4–8 December 2016, Melbourne, Vic., Australia.
Fletcher A, Lawes R, Weeks C (2016) Crop area increases drive earlier and dry sowing in Western Australia: implications for farming systems. Crop & Pasture Science 67, 1268-1280.
| Crossref | Google Scholar |
Gandorfer M, Pannell D, Meyer-Aurich A (2011) Analyzing the effects of risk and uncertainty on optimal tillage and nitrogen fertilizer intensity for field crops in Germany. Agricultural Systems 104(8), 615-622.
| Crossref | Google Scholar |
GGP (2015) GHG Protocol Agricultural Guidance. p. 103. Greenhouse Gas Protocol. Available at https://ghgprotocol.org/sites/default/files/standards/GHG%20Protocol%20Agricultural%20Guidance%20%28April%2026%29_0.pdf [Accessed 21 June 2022]
GIWA (2023) Crop report, February 2023. Grains Industry Association of Western Australia, Perth, WA, Australia. Available at https://www.giwa.org.au/wa-crop-reports/2022-season/giwa-crop-report-february-2023/
Guillard K, Kopp KL (2004) Nitrogen fertilizer form and associated nitrate leaching from cool-season lawn turf. Journal of Environmental Quality 33(5), 1822-1827.
| Crossref | Google Scholar |
Hammer GL, Holzworth DP, Stone R (1996) The value of skill in seasonal climate forecasting to wheat crop management in a region with high climatic variability. Australian Journal of Agricultural Research 47, 717-737.
| Crossref | Google Scholar |
Harries M, Flower KC, Scanlan CA (2021) Sustainability of nutrient management in grain production systems of south-west Australia. Crop & Pasture Science 72(3), 197-212.
| Crossref | Google Scholar |
Hochman Z, van Rees H, Carberry PS, Hunt JR, McCown RL, Gartmann A, Holzworth D, van Rees S, Dalgliesh NP, Long W, Peake AS, Poulton PL, McClelland T (2009) Re-inventing model-based decision support with Australian dryland farmers. 4. Yield Prophet® helps farmers monitor and manage crops in a variable climate. Crop & Pasture Science 60, 1057-1070.
| Crossref | Google Scholar |
Hyatt CR, Venterea RT, Rosen CJ, Mcnearney M, Wilson ML, Dolan MS (2010) Polymer-coated urea maintains potato yields and reduces nitrous oxide emissions in a Minnesota loamy sand. Soil Science Society of America Journal 74, 419-428.
| Crossref | Google Scholar |
Kharel S (2022) ‘EVALUS user manual.’ 1st edn. (Western Australian Department of Primary Industries and Regional Development: Perth, WA, Australia) Available at https://www.researchgate.net/publication/375120988_Version_1_EVALUS_User_Manual
Kharel S, d’Abbadie C, Abadi A, Kingwell R (2022) Reducing farming system emissions via spatial application of payoff functions. Agricultural Systems 203, 103534.
| Crossref | Google Scholar |
Kingwell R (2011) Managing complexity in modern farming. Australian Journal of Agricultural and Resource Economics 55, 12-34.
| Crossref | Google Scholar |
Kingwell R (2023) The path to savouring farming success: some reflections. Farm Policy Journal 20, 24-28.
| Google Scholar |
Lemon J (2007) Nitrogen decision tools – choose your weapon. In ‘Cereals update. Agribusiness crop updates’. pp. 66–69. (Department of Agriculture and Food: Perth, WA, Australia) Available at https://library.dpird.wa.gov.au/cgi/viewcontent.cgi?article=1032&context=crop_up [Accessed 15 February 2023]
LeMonte JJ, Jolley VD, Summerhays JS, Terry RE, Hopkins BG (2016) Polymer coated urea in turfgrass maintains vigor and mitigates nitrogen’s environmental impacts. PLoS ONE 11, e0146761.
| Crossref | Google Scholar | PubMed |
Lopez MB, Ekonomou A, Eckard RJ (2022) A greenhouse accounting framework for crop production (G-GAF) based on the Australian National Greenhouse Gas Inventory methodology. Updated October 2022. Available at http://www.piccc.org.au/resources/Tools
Lopez MB, Dunn J, Wiedemann S, Eckard R (2023) A greenhouse accounting framework for beef and sheep properties based on the Australian National Greenhouse Gas Inventory methodology. Primary Industries Climate Challenges Centre, University of Melbourne, Melbourne, Vic., Australia. Updated January 2023. Available at http://piccc.org.au/Tools
Marshall GR, Parton KA, Hammer GL (1996) Risk attitude, planting conditions and the value of seasonal forecasts to a dryland wheat grower. Australian Journal of Agricultural Economics 40, 211-233.
| Crossref | Google Scholar |
Meza FJ, Hansen JW, Osgood D (2008) Economic value of seasonal climate forecasts for agriculture: review of ex-ante assessments and recommendations for future research. Journal of Applied Meteorology and Climatology 47, 1269-1286.
| Crossref | Google Scholar |
Monjardino M, McBeath TM, Brennan L, Llewellyn RS (2013) Are farmers in low-rainfall cropping regions under-fertilising with nitrogen? A risk analysis. Agricultural Systems 116, 37-51.
| Crossref | Google Scholar |
Monjardino M, McBeath T, Ouzman J, Llewellyn R, Jones B (2015) Farmer risk-aversion limits closure of yield and profit gaps: a study of nitrogen management in the southern Australian wheatbelt. Agricultural Systems 137, 108-118.
| Crossref | Google Scholar |
Pannell DJ (2006) Flat earth economics: the far-reaching consequences of flat payoff functions in economic decision making. Review of Agricultural Economics 28(4), 553-566.
| Crossref | Google Scholar |
Pannell DJ (2016) Economic perspectives on nitrogen in farming systems: managing trade-offs between production, risk and the environment. In ‘Solutions to improve nitrogen use efficiency for the world. Proceedings of the 2016 International Nitrogen Initiative Conference’. 4–8 December 2016, Melbourne, Vic., Australia.
Pannell DJ (2017) Economic perspectives on nitrogen in farming systems: managing trade-offs between production, risk and the environment. Soil Research 55, 473-478.
| Crossref | Google Scholar |
Pannell D, Gandorfer M, Weersink A (2019) How flat is flat? Measuring payoff functions and the implications for site-specific crop management. Computers and Electronics in Agriculture 162, 459-465.
| Crossref | Google Scholar |
Petersen EH, Fraser RW (2001) An assessment of the value of seasonal forecasting technology for Western Australian farmers. Agricultural Systems 70, 259-274.
| Crossref | Google Scholar |
Planfarm (2022) Planfarm benchmarks 2021 season. Planfarm, Perth, WA, Australia. Available at https://www.planfarm.com.au/resources/
Queensland Government (2022) SILO: Australian climate data from 1889 to yesterday. Queensland Government, Brisbane, Qld, Australia. Available at https://www.longpaddock.qld.gov.au/silo/
Umbers A (2021) GRDC farm practices survey report. Grains Research and Development Corporation, Canberra, ACT, Australia. Available at https://s3.ap-southeast-2.amazonaws.com/cdn.weedsmart.org.au/app/uploads/2022/08/2021-FPS-Report_EXT.pdf [Accessed 12 February 2023]