

Validation of critical soil-test phosphorus values from the Better Fertiliser Decisions for Pastures meta-analysis
David Weaver A * , David Rogers A , Eric Dobbe A , Robert Summers B , Ronald Master A , Robert McFerran C , Graham Mussell D , Justin Mercy E , Luke Dawson F and Kath Lynch C
A
B
C
D
E
F
Abstract
Historical application of phosphorus (P) fertilisers has enabled grazing agriculture in south-west Western Australia but has led to excessive soil P levels that pose a eutrophication risk. However, adoption of critical soil-test P values for pastures determined from the Better Fertiliser Decisions for Pastures (BFDP) meta-analysis of historical Australian trials has been poor because of perceived lack of relevance to the soils and contemporary pasture species in the region.
We aimed to validate critical Colwell P values from the BFDP project for soils and contemporary pasture species of south-west Western Australia.
Fifty P-rate response trials were performed with contemporary pasture species, and the results compared with BFDP.
Trial results were consistent with BFDP and fell within 95% prediction intervals of response calibrations of Colwell P and relative yield pairs for different P buffering index (PBI) ranges. Soils with PBI <15 required lower critical Colwell P values. Responsiveness to P application was 8% (±4%), consistent with a 5% response expected for Colwell P levels supporting 95% relative yield. Application of nitrogen, potassium and sulfur significantly increased yield while increasing basal cover of annual ryegrass (Lolium multiflorum) and reducing that of clover (Trifolium spp.) in the sward. Response calibration coefficients and critical Colwell P values before and after addition of the trial data to BFDP showed a strong correlation (r2 >0.99), although critical values were slightly lower for lower soil PBI.
Critical Colwell P values from BFDP are relevant and applicable to soils and contemporary pasture species of south-west Western Australia.
Agronomic advice and application of P should be based on interpretation of Colwell P values, with P applied only when levels are below the critical value. Pasture composition should also be considered when interpreting Colwell P values. This approach minimises risks of P loss and improves economic outcomes for growers.
Keywords: Colwell P, critical value, eutrophication, P buffering index, P fertility index, pasture, pasture composition, phosphorus, responsiveness.
Introduction
Management of nutrients and fertilisers in pasture soils is crucial for economic and environmental reasons. Fertilisers can be expensive, and the release of nutrients from agriculture can harm water quality, reducing the amenity and beneficial uses of public assets and deterring tourism through algal blooms, deoxygenation of waterways, and fish kills (Melland et al. 2008; Gourley and Weaver 2012). It is important that fertiliser decisions are based on evidence and soil testing. This approach improves nutrient efficiency, reduces offsite nutrient loss, and maximises fertiliser investment returns.
Two previous projects in Australia, Better Fertiliser Decisions for Pastures (BFDP; Gourley et al. 2019) and Better Fertiliser Decisions for Crops (BFDC; Speirs et al. 2013), organised and analysed historical trial data gathered from government agencies and fertiliser companies across Australia. The outcome of these projects was to establish critical soil-test values for phosphorus (P), potassium (K) and sulfur (S) for crops and grazed pastures. Fertiliser recommendations for crops and pastures are based on predictive functions and the critical soil-test values derived from nutrient-response trials. However, some landholders and industry stakeholders are hesitant to rely on the evidence of critical values and predictive functions provided in studies such as BFDP, despite years of trials, meta-analysis and peer-reviewed publications (Speirs et al. 2013; Gourley et al. 2019). Instead, traditional fertiliser practices remain the norm, such as applying one bag of superphosphate per acre per year (i.e. 200 kg superphosphate per ha/year). This practice may be preferred owing to past successes of applying P to infertile agricultural land in south-west Western Australia (WA) during the 1960s, or because additional fertiliser application is seen as a safety factor to compensate for errors in sampling, analysis and interpretation (Black 2019), and because the additional nutrients can have some residual value. In addition, other nutrients in superphosphate such as S and calcium (Ca) may contribute to a pasture growth response that growers perceive as a P response. Reluctance to adopt critical values also stems from concerns about historical trials using older pasture varieties, perceived higher P requirements of newer cultivars, and perceived lack of relevance of critical values to south-west WA soil and climatic conditions.
Soil-test records showing high soil P status consistently reveal that traditional fertiliser practices are used over evidence-based approaches. Weaver and Reed (1998) found that 49% of 7950 soil samples (0–10 cm) taken on the south coast of WA in 1988 and 1989 exhibited high P levels when assessed against critical values derived from pasture trials. Similarly, Weaver and Wong (2011) showed that 57–69% of 109 000 soil samples collected in WA from 2008 to 2010 exceeded the critical P values necessary for achieving 90% relative yield (RY) in pastures; their study further revealed that 80–95% of 2160 soil samples (0–10 cm) from Australian dairy farms during 2007 and 2008 exceeded the critical P values required for achieving 95% RY in pastures. In addition, Rogers et al. (2021) showed that 56% of 22 000 soil samples (0–10 cm) from pastures in south-west WA exceeded critical P values to achieve 95% RY, and Weaver and Summers (2021) identified from 18 500 long-term records that soil P fertility in the Peel Harvey catchment in south-west WA commenced above critical values in 1982 and continued to increase to 2018.
Assessment of soil-test records challenges the belief that an evidence-based approach to fertiliser decision making is universally adopted, and this belief is also challenged by assessments that show increases in soil P fertility above critical value over time (Weaver and Summers 2021). It is evident that simply providing data from nutrient-response trials is insufficient to convince landholders and industry stakeholders that exceeding critical values does not enhance productivity or cost-effectiveness of fertiliser use (Simpson et al. 2009; Gourley et al. 2019).
In light of this, pasture trials were undertaken to validate the P buffering index (PBI)-specific soil-test P response calibrations and critical values for pastures grown under rainfall exceeding 600 mm in southwest WA defined in Gourley et al. (2019). The results in this paper add 31 trials to those from the first year’s 19 trials (Rogers et al. 2021), and are presented and compared with data from BFDP (Gourley et al. 2019). The primary goal of the trials was to test the validity of the critical P values from BFDP. Secondary objectives included promoting behavioural change (such as landholders and industry stakeholders accepting and utilising critical soil-test P values for evidence-based fertiliser recommendations), improving profitability for landholders, and enhancing water quality by reducing excessive P levels in the soil. To achieve the primary objective and lend credibility to the secondary objectives, a scientific framework for comparison with BFDP was crucial and has been previously described in Rogers et al. (2021).
Materials and methods
Agricultural setting
Livestock producers in the high-rainfall zone of south-west WA (>600 mm annually) manage paddocks of shallow-rooted annual pastures that are used for grazing only, or for grazing early in the growing season and subsequently locked up for fodder conservation in the form of hay or silage. Farmers need to follow this production method because, even though it is a high-rainfall zone, most rain falls between late autumn and spring (May–October). Very high summer temperatures and the absence of summer rainfall mean that the high-rainfall zone where pastures are grown is effectively in drought every summer. Farmers need to conserve any surplus pasture growth achieved during the favourable spring growing conditions to feed their animals during the summer–autumn period when there is little or no available pasture. Furthermore, pasture plants and seeds (except for some clovers) can be completely removed during the process of making hay and silage. Farmers need to oversow these paddocks at the break of the following season to ensure a sufficient seed bank for the pasture to germinate (Puckridge and French 1983; Kemp and Michalk 1994; Revell et al. 2012; Roberts and Dolling 2020). Most trial sites from this study were managed in line with this practice (Table 1).
| Trial no. | Trial design | Year A | Texture | PBI | Colwell P | Colwell K | KCl-40 S | pH (CaCl2) | P95 fertility index B | Critical Colwell P (mg/kg) C | |
|---|---|---|---|---|---|---|---|---|---|---|---|
| (mg/kg) | |||||||||||
| 1 | 1a | 2019 | Sand | 1.0 | 9 | 79 | 28.4 | 4.2 | 1.00 | 9 | |
| 2 | 1b | 2019K | Sand | 5.5 | 16 | 47 | 115.2 | 5.0 | 1.23 | 13 | |
| 3 | 1a | 2019K | Sand | 6.2 | 10 | 48 | 6.3 | 4.7 | 0.77 | 13 | |
| 4 | 2 | 2019 | Sandy loam | 7.8 | 14 | 136 | 5.9 | 4.7 | 0.93 | 15 | |
| 5 | 2 | 2019K | Sandy loam | 11.7 | 12 | 220 | 9.3 | 5.4 | 0.63 | 19 | |
| 6 | 1b | 2019S | Sand | 17.1 | 18 | 31 | 91.0 | 4.7 | 0.78 | 23 | |
| 7 | 2 | 2019 | Sandy loam | 21.5 | 21 | 217 | 8.4 | 4.4 | 0.88 | 24 | |
| 8 | 2 | 2019 | Sandy loam | 26.1 | 21 | 203 | 8.9 | 4.5 | 0.81 | 26 | |
| 9 | 1a | 2019 | Sandy loam | 32.2 | 8 | 43 | 14.9 | 4.8 | 0.30 | 27 | |
| 10 | 1a | 2019S | Sandy loam | 37.7 | 12 | 88 | 5.2 | 4.1 | 0.44 | 27 | |
| 11 | 2 | 2019 | Sand | 37.9 | 26 | 86 | 6.4 | 5.5 | 0.93 | 28 | |
| 12 | 2 | 2019 | Sandy loam | 58.7 | 28 | 63 | 8.5 | 4.7 | 0.97 | 29 | |
| 13 | 1b | 2019S | Sandy clay loam | 62.1 | 39 | 56 | 7.8 | 6.2 | 1.30 | 30 | |
| 14 | 1b | 2019 | Sandy clay loam | 69.3 | 48 | 155 | 13.3 | 5.4 | 1.60 | 30 | |
| 15 | 1a | 2019 | Sandy clay loam | 153.2 | 74 | 42 | 12.4 | 4.7 | 2.06 | 36 | |
| 16 | 2 | 2019 | Sandy loam | 161.2 | 36 | 137 | 10.4 | 5.4 | 1.00 | 36 | |
| 17 | 1b | 2019S | Sandy clay loam | 188.0 | 55 | 99 | 14.6 | 5.1 | 1.45 | 38 | |
| 18 | 1a | 2019 | Sandy clay loam | 211.9 | 24 | 163 | 86.8 | 5.8 | 0.62 | 39 | |
| 19 | 1a | 2019 | Sandy clay loam | 220.6 | 17 | 137 | 18.0 | 4.4 | 0.44 | 39 | |
| 20 | 1a | 2020 | Sand | 1.5 | 8 | 70 | 67.3 | 4.2 | 0.89 | 9 | |
| 21 | 1a | 2020 | Sand | 4.6 | 3 | 37 | 13.8 | 4.5 | 0.25 | 12 | |
| 22 | 1a | 2020 | Sandy loam | 17.9 | 10 | 145 | 21.3 | 4.1 | 0.43 | 23 | |
| 23 | 1a | 2020KW | Sand | 29.3 | 25 | 95 | 6.9 | 5.8 | 0.96 | 26 | |
| 24 | 1a | 2020S | Sandy loam | 55.7 | 16 | 65 | 5.4 | 4.1 | 0.55 | 29 | |
| 25 | 1b | 2020 | Sandy loam | 64.9 | 21 | 254 | 10.1 | 4.8 | 0.70 | 30 | |
| 26 | 1b | 2020K | Sandy loam | 72.5 | 12 | 76 | 11.4 | 5.6 | 0.39 | 31 | |
| 27 | 1a | 2020SW | Sandy loam | 86.6 | 19 | 52 | 9.6 | 5.2 | 0.59 | 32 | |
| 28 | 1a | 2020S | Sandy loam | 140.1 | 60 | 64 | 27.4 | 4.5 | 1.71 | 35 | |
| 29 | 1a | 2020S | Clay loam | 195.7 | 22 | 173 | 40.5 | 6.4 | 0.58 | 38 | |
| 30 | 1a | 2020S | Sandy clay loam | 347.8 | 10 | 151 | 30.3 | 5.4 | 0.22 | 45 | |
| 31 | 1b | 2020KW | Sand | 379.8 | 42 | 287 | 14.9 | 5.1 | 0.89 | 47 | |
| 32 | 1a | 2020SW | Sand | 410.4 | 34 | 391 | 14.4 | 5.3 | 0.71 | 48 | |
| 33 | 1a | 2021 | Sand | 3.2 | 5 | 67 | 59.8 | 4.1 | 0.50 | 10 | |
| 34 | 1a | 2021S | Sandy loam | 3.3 | 16 | 126 | 6.1 | 4.4 | 1.45 | 11 | |
| 35 | 1a | 2021S | Sandy loam | 4.5 | 6 | 42 | 9.0 | 4.4 | 0.50 | 12 | |
| 36 | 1a | 2021K | Sandy loam | 5.8 | 12 | 43 | 5.1 | 4.1 | 0.92 | 13 | |
| 37 | 1a | 2021S | Sandy loam | 12.3 | 30 | 56 | 21.8 | 5.1 | 1.58 | 19 | |
| 38 | 1a | 2021W | Sandy clay loam | 176.5 | 55 | 61 | 20.2 | 4.6 | 1.49 | 37 | |
| 39 | 1a | 2021 | Sandy loam | 212.6 | 51 | 129 | 17.3 | 5.7 | 1.31 | 39 | |
| 40 | 1a | 2021 | Sandy clay loam | 253.8 | 5 | 140 | 67.9 | 5.6 | 0.12 | 42 | |
| 41 | 1a | 2022S | Sandy loam | 1.0 | 19 | 91 | 9.7 | 4.4 | 2.11 | 9 | |
| 42 | 1a | 2022S | Sand | 1.8 | 4 | 30 | 43.8 | 4.0 | 0.44 | 9 | |
| 43 | 1a | 2022S | Sandy loam | 8.1 | 26 | 205 | 10.9 | 4.3 | 1.73 | 15 | |
| 44 | 1a | 2022K | Sandy loam | 9.2 | 7 | 25 | 4.5 | 4.5 | 0.41 | 17 | |
| 45 | 1a | 2022 | Sand | 13.0 | 10 | 24 | 20.4 | 5.8 | 0.50 | 20 | |
| 46 | 1a | 2022S | Sandy loam | 19.1 | 43 | 430 | 41.5 | 4.9 | 1.79 | 24 | |
| 47 | 1a | 2022 | Sandy clay loam | 160.6 | 58 | 41 | 21.7 | 4.4 | 1.61 | 36 | |
| 48 | 1a | 2022 | Sandy clay loam | 219.9 | 8 | 144 | 74.5 | 5.6 | 0.21 | 38 | |
| 49 | 1a | 2022 | Sandy clay loam | 259.2 | 50 | 61 | 14.7 | 5.3 | 1.22 | 41 | |
| 50 | 1a | 2022S | Sandy clay loam | 302.8 | 90 | 144 | 16.5 | 5.1 | 2.09 | 43 | |
Trial numbers with the same colour are the same trial run over multiple years with nutrient treatment re-application each year (see Table 2). Soil-test data for multi-year trials are for the whole site for the first year, and mean values of treatments with 0 kg P/ha and basal nutrients applied in subsequent trial years. Data sorted by P buffering index (PBI) within each trial year.
Nutrient status: red, deficient with soil-test value predicted to achieve ≥0–<90% relative yield (RY); orange, optimal status ≥90–<95% RY; green, excess ≥95% RY. Soil pH status: red, very low; brown, low; light green, marginal; dark green, satisfactory. P95 fertility index: red, very deficient (<0.75); brown, deficient (≥0.75–<0.95); green, optimal (≥0.95–<1.00); grey, non-responsive (≥1.00).
Trial site selection
In order to enable a validation of critical values from BFDP, trial locations with established pastures were selected to represent gradients of PBI and soil P fertility level (Gourley et al. 2019), and trials followed the framework and experimental design outlined in Rogers et al. (2021). Site selection involved determining a location within the selected paddock with a uniform residual pasture base. Trials were conducted in such a way that they would be considered for inclusion in national datasets such as BFDP and BFDC (Speirs et al. 2013). This includes provision of essential trial records such as site location, crop type, experimental design, soil sampling depth, soil-test method and units, mean yield for each treatment (Y0, Ymax), and the yields determined from fitted equations, where Y0 is the mean yield from the control and Ymax is the maximum yield either from a fitted response equation or from the maximum nutrient rate.
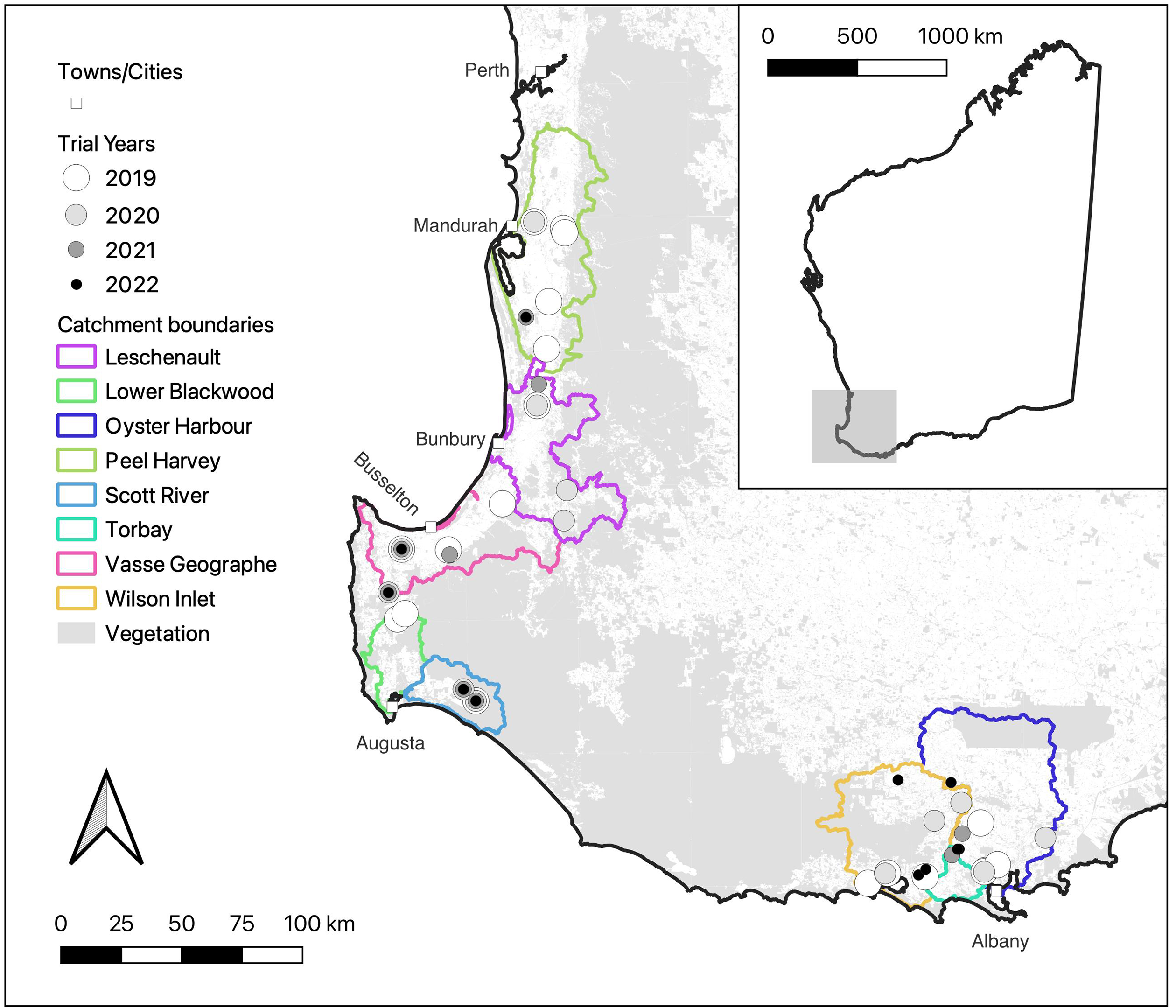
Data from government-sponsored soil-testing programs provided ~2400 soil-test records each year from which soil characteristics such as PBI and soil P fertility were used to identify potential trial site locations (Fig. 1). Trial site locations within identified paddocks were uniform and selected to facilitate field days and to avoid hazards such as gateways, troughs, fertiliser and lime dumps, and headlands. This is consistent with guidelines for soil sampling (Gourley and Weaver 2019) and ensured that atypical locations within paddocks were avoided. The 39 established pasture sites were distributed across south-west WA and located in different catchments. Trials at 33 field sites were conducted for a single year, at three sites for two consecutive years, at one site for three consecutive years, and at two sites for four consecutive years, resulting in 50 trial-years of data.
Soil sampling and analysis
Soil samples (0–10 cm) were collected from the selected trial sites prior to establishing trials, and from control treatment plots at the start of a subsequent trial year for multi-year trials, to assess site conditions. Samples were collected using a 19-mm pogo stick or 20-mm auger powered by a battery drill (Weaver et al. 2021), and consisted of a composite of 30 cores. In addition, for the purpose of characterising each site, incremental samples (0–10 cm, 10–20 cm, 20–30 cm) were collected in the establishment year with a 50-mm corer, and consisted of a composite of seven cores. Samples were collected according to Australian standards (Gourley and Weaver 2019; Hayes et al. 2022). Notwithstanding differences in site and analyte variability, it would be expected that measured soil analytes would have a precision better than 15% with 95% confidence, particularly given trials and trial plots are smaller areas likely to exhibit less variation (Hayes et al. 2022). Analysis included adjusted PBI (Burkitt et al. 2002), Colwell P and K (Colwell 1965), pH (in CaCl2), and KCl-40 S (Blair et al. 1991).
Derived soil measures
A soil P fertility index (Cope and Rouse 1973; Simpson et al. 2011; Plunkett et al. 2019; Rogers et al. 2021), calculated using Eqn 1, simplified the interpretation of soil P fertility. This index eliminates the need for growers and practitioners to have intimate knowledge of PBI-specific critical Colwell P values. For example, based on Eqn 2 (Gourley et al. 2019; Rogers et al. 2021), a soil with a PBI of 1 has a critical Colwell P of 7 mg/kg for 90% RY and 9 mg/kg for 95% RY; a soil with a PBI of 10 has a critical Colwell P of 13 mg/kg for 90% RY and 17 mg/kg for 95% RY; and a soil with a PBI of 250 has a critical Colwell P of 31 mg/kg for 90% RY and 41 mg/kg for 95% RY. The infinite array of combinations of PBI and Colwell P requires computing power to resolve; hence, a P fertility index that centres around a critical value of 1 as described below greatly simplifies interpretation. In addition, use of a P fertility index has potential to facilitate a more direct comparison between measures such as Olsen P (Olsen et al. 1954) and Colwell P through rescaling to a common measurement scale rather than through the use of pedo-transfer functions that may introduce errors (Moody et al. 2013; Sandral et al. 2019).
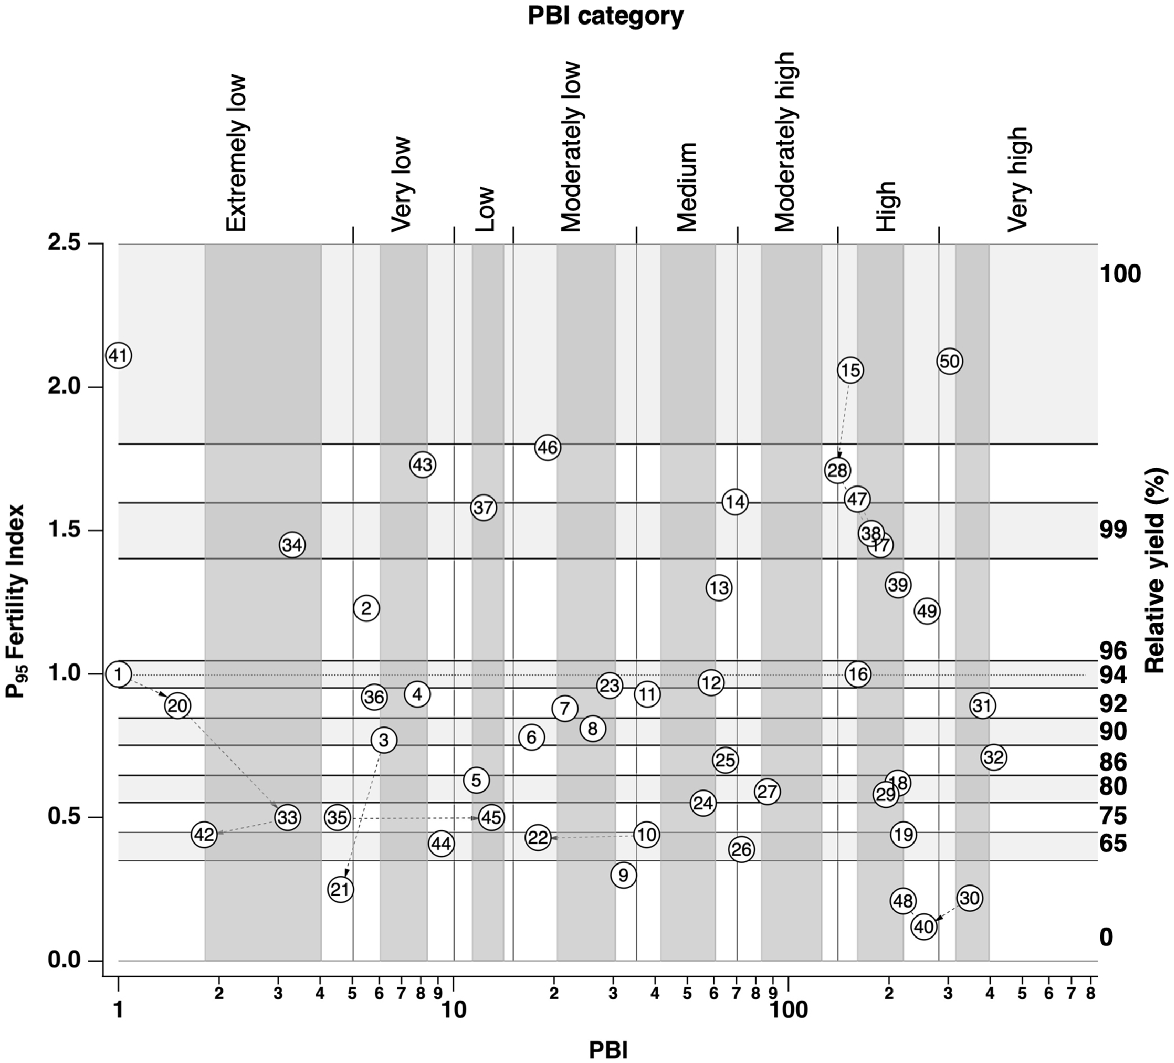
The P95 fertility index, calculated as the ratio of pre-trial Colwell P to the critical Colwell P for achieving 95% RY, categorises soils as being at the critical value (P95 fertility index = 1), responsive (P95 fertility index <1), or non-responsive (P95 fertility index ≥1) to P applications, and can be used for different target RYs, commonly 90% or 95% RY. Initial soil conditions for each trial at the start of each trial year are shown in Table 1, and Fig. 2 shows the gradients of PBI, P95 fertility index and RY for each trial year. The P fertility index is calculated thus:
where critical Colwell P is determined using the modified equation from Gourley et al. (2019), which results in lower critical Colwell P values at soil PBI <15 (Eqn 2). For example, to achieve RY of 95%, a soil with PBI of 1 would have a critical Colwell P value of 20 if the equation were not modified, or a critical Colwell P value of 9 using the modified equation:
Site selection framework of soil P buffering index (PBI) and soil P95 fertility index with an overlay of trial sites indicated by trial number (Table 1). Horizontal dashed line shows P95 fertility index of 1 where relative yield (RY) = 95%, above which P application should result in no yield response and below which P application should result in a response commensurate with the degree of P deficiency. Framework shows PBI categories on upper X-axis (Gourley et al. 2019), and PBI ranges (dark grey vertical bands) and P95 fertility index (horizontal light grey bands) or RY ranges targeted for site selection. Dashed lines with arrows connect multi-year trials temporally.
Trial treatments and management
Herbicides were used to control or supress undesirable species before and during the growing season as needed. Where necessary, existing contemporary pasture stands were over-sown with contemporary pasture varieties suitable for their soil type and climatic zone. Pastures included mixes of annual ryegrass (Lolium multiflorum Lam.), legumes (clovers, Trifolium spp.), and occasionally additional species such as oats (Avena sativa L.). Annual ryegrass varieties sown included Winterhawk, Vortex, Ascend and Arnie. Clover varieties sown included subterranean clover (T. subterraneum L.) cvv. Gosse, Narrikup, Dalkeitha and Denmark; Persian clover (T. resupinatum L.) cv. Lightning; arrowleaf clover (T. vesiculosum Savi) cv. Zulu II; and balansa clover (T. michelianum Savi) cv. Vista. The contemporary nature of the pasture varieties used is shown in the timeline of release dates of annual ryegrass and clover varieties (Supplementary material Fig. S1) in Australia (https://ipsearch.ipaustralia.gov.au/pbr). Sowing occurred between mid-April and mid-June, according to the break of the season, using a cone seeder (row spacing 110 mm) at commercial rates (annual ryegrass 20–50 kg/ha, clover 5–10 kg/ha) commonly recommended for each species (www.barenbrug.com.au). Stock exclusion was implemented using fencing, with timing varying based on trial type (Table 2).
Design | P applied (kg/ha) | Basal nutrients at establishment (kg/ha) | Basal nutrients in-season (kg/ha) | Management | No. of trials | Plot dimensions (m) | No. of plots | |
|---|---|---|---|---|---|---|---|---|
1a | 0, 5, 10, 20, 40A | N (59.8) K (49.9) S (22.1) Cu (3.5) Zn (2.4) Mo (0.2) | After each cut (~6-weekly): N (60) K (32.4) S (22.9) | Stock excluded | 35 | 2.2 by 10–20B | 21 | |
0, 40A | No basal | No basal | ||||||
1b | 0, 5, 10, 20, 40 | N, K (49.9) S (22.1) Cu (3.5) Zn (2.4) Mo (0.2) | At lockup and late Sept.: N (60) K (32.4) S (22.9) | Stock access until spring lockup | 8 | 2.2 by 10–20B | 21 | |
0, 40 | No basal | No basal | ||||||
2 | 0, 5, 40 | N, K (49.9) S (22.1) Cu (3.5) Zn (2.4) Mo (0.2) | At lockup and late Sept.: N (60) K (32.4) S (22.9) | Stock access until spring lockup | 7 | 2 by 20 | 18 | |
0, 5, 40 | No basal | No basal |
Trial designs 1a and 1b were randomised block designs with three replicates, whereas trial design 2 used randomised split-plots (Table 2). Designs 1a and 1b had five P rates (0–40 kg/ha) with basal nutrients and two P rates (0 and 40 kg/ha) without basal nutrients. Rates of P were doubled for trials 30, 40 and 48 because the site was recently developed for agriculture, and had high PBI and low P fertility. Plot size was 2.2 m by 10–20 m with a 0.55-m buffer. There were 43 trials with design 1a and 1b (Table 2), 35 fenced and mown regularly for biomass measurement (design 1a), and eight grazed until spring and then locked up for biomass measurement (design 1b). Design 2 had seven trials with three P rates (0, 5 and 40 kg/ha) and split-plots with basal nutrient application to one half. All Phos fertiliser (CSBP, Perth, WA, Australia) with low S content (20.3% P, 1.0% S) was used for all P treatments. Basal fertilisers (nitrogen (N), K, S, copper (Cu), zinc (Zn), molybdenum (Mo)) were applied at establishment and additional applications were made during the season Table 2.
Pasture measurements
For assessing pasture growth, wet weight of strips of mown pasture to a height of 50 mm with known dimensions were recorded, and a subsample of known wet weight was retained and dried to calculate dry matter (DM). The composition of clover, grass and weeds was visually assessed using the basal cover or cover abundance method (Cayley and Bird 1996). Trials of type 1a were assessed twice during the season, whereas trial designs 1b and 2 were assessed once in October using the same methodology. Four or five replicates of pasture composition were collected within each plot to achieve a similar density of observations as suggested for this method in Cayley and Bird (1996).
Tissue testing was undertaken at all sites at or just prior to 10% flowering (mid–late September depending on site growth), following Australian guidelines (Dowling and Blaesing 2022). When the pasture sward was >30% legume, the legume component was sampled, otherwise annual ryegrass was sampled. Plant tissue samples were analysed for P, K, S, Cu, Zn, Ca, magnesium (Mg), sodium (Na), iron (Fe), Mo and boron (B) using the methods described by McQuaker et al. (1979). Pasture biomass and tissue-sample P concentrations were combined to estimate the amount of P removed from different treatments each year.
Data curation and analyses
Frequency distributions of trial PBI and P95 fertility index values were compared with frequency distributions of these metrics from 30 981 soil samples collected in government-sponsored soil-testing programs from 2009 to 2022. This was undertaken to determine how representative the selected trial PBI and P fertility data were of the diversity of soils in south-west WA.
Parametric analysis of variance (ANOVA), including interactions to determine whether spatial effects were evident in trial blocks, was conducted using Genstat 20th edn (VSN International, Hemel Hempstead, UK) and Data Desk (datadescription.com) to determine significant differences (P < 0.05) in DM from treatments in each trial. Blocking was considered as a factor for randomised block designs 1a and 1b to address spatial variation, but not for trials with design 2 owing to layout constraints. Post hoc analysis was performed to determine least significant differences (l.s.d.s), and the significance of differences was assessed using compact letter displays (Gramm et al. 2007). Trial measurements were used to classify trials broadly as responsive when there was a statistically significant increase in DM due to the application of P at any rate, and as not responsive otherwise. Trials were further classified as underperforming (responded to P when they were not expected to with P95 fertility index ≥1), overperforming (did not respond to P when they were expected to with P95 fertility index <1), true positive (responded to P when they were expected to with P95 fertility index <1), and true negative (did not respond to P when they were expected not to with P95 fertility index ≥1). This approach is similar to a confusion matrix (Brereton 2021) and allows a comparison of predicted trial response using P95 fertility index with measured trial response as determined from statistical tests of DM response.
The Mitscherlich equation (Eqn 3) was applied to the data from each trial, and curve-fit coefficients were estimated:
where Y is plant yield (absolute (t/ha) or relative (%)); A is Ymax (nutrient non-limiting); B is site responsiveness, , where Y0 is yield when X = 0, and ranges from 0 to 1; C is curvature coefficient; and X is amount of nutrient measured in the soil test (mg/kg) or applied (kg/ha).
Relative yield (Eqn 4) was estimated using mean values of Y0 (yield from the control) and Ymax (yield from maximum P rate).
where Y0 is pasture yield with no nutrient applied, and Ymax is maximum pasture yield when non-limiting nutrient is applied.
Validation of the BFDP critical Colwell P soil-test values was explored in several ways. First, site responsiveness as estimated by the B coefficient (Eqn 3) was correlated with P95 fertility index of the control treatment with basal nutrients applied. Second, the pairs of RY (Eqn 4) of the control treatments with basal nutrients applied and P95 fertility index of these treatments were compared with the modelled relationship between RY and P95 fertility index for BFDP based on Eqn 5 (eqn 7 in Gourley et al. 2019):
Third, the trial results consisting of pairs of Colwell P and RY were compared with the BFDP data by fitting a modified Mitscherlich equation (Eqn 6) and 95% prediction intervals (Helsel and Hirsch 1992) associated with Colwell P and RY pairs from the BFDP data for the corresponding PBI ranges of the trials. The c value is a regression coefficient describing the curvature of this relationship. This comparison allowed an assessment of whether the new observations (i.e. these trials) were likely to belong to the same distribution as the previous data (i.e. BFDP), or whether they came from a different distribution:
Non-parametric ANOVA (Kruskal-Wallis) was used to determine the significance of differences in pasture composition due to trial treatments such as P rates and the application of basal nutrients (Table 2).
Results
General
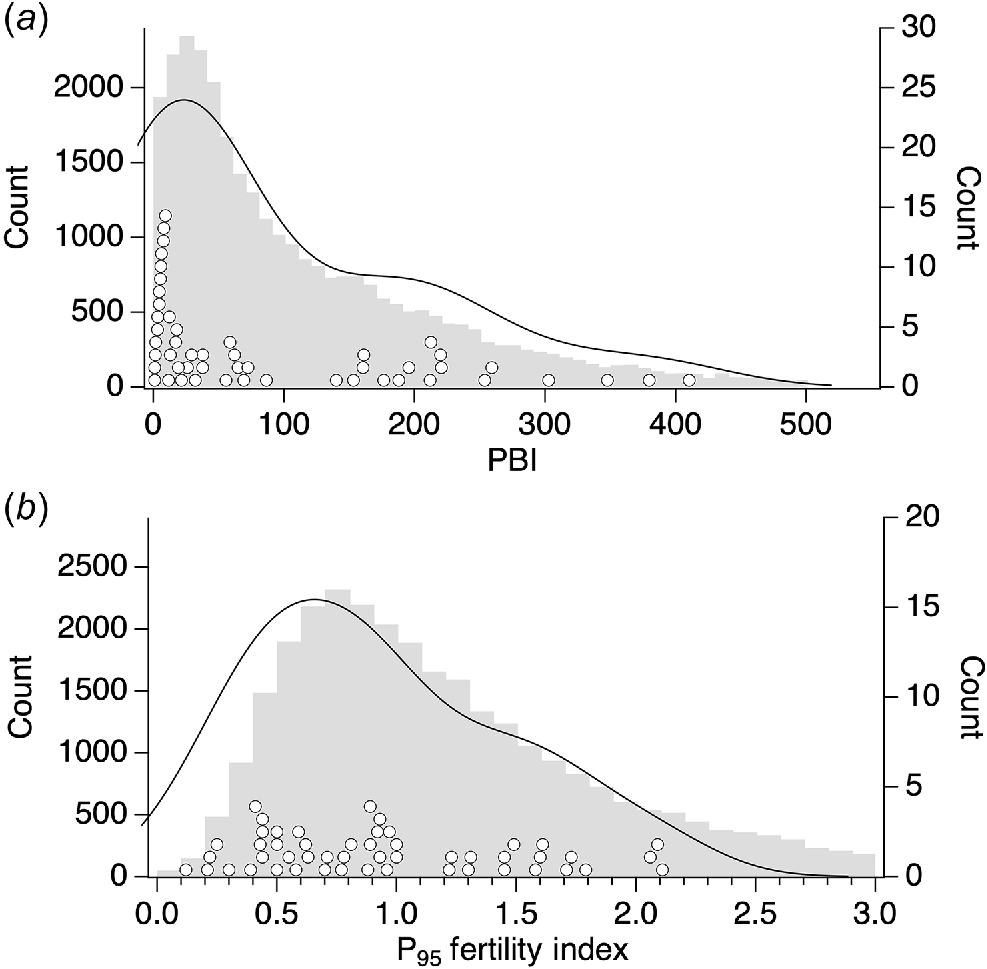
The PBIs of the trial-year soil-test data spanned PBI categories from extremely low to very high (Table 1, Fig. 2), and had a very similar distribution to soil PBIs of 30 981 commercially sampled sites in south-west WA (Fig. 3a). The frequency distributions of soil P fertility of the 30 981 commercially sampled sites and those of the present trials (Fig. 3b) were not as similar. Specifically, the P95 fertility index of commercially sampled sites had a mean value of 1.37, while the trial sites had a mean value of 0.94. The selection of trial sites with a P fertility range different from that of the commercially sampled sites was necessary to meet experimental requirements. This ensured that a comparison with BFDP across all P fertility levels ranging from very infertile to very fertile was possible. In contrast, a random selection of trial sites from the commercially sampled sites would limit the selection of sites with very low P fertility across all PBI categories.
Frequency distribution of (a) P buffering index (PBI) and (b) P95 fertility index of 30 981 soil sample sites in south-west WA (grey bars, counts on left y-axis) compared with those of trial sites (○) displayed as half violin plots (Hintze and Nelson 1998) using Gaussian distributions (counts on right y-axis).
Responsiveness
Based on a nominal statistical threshold of P < 0.05 (Wasserstein et al. 2019), 29 trials (58% of 50 trials) were classified as P-responsive and 21 (42% of 50 trials) not responsive to P (Fig. 4a). Of the trials, 33 (66%) responded to P as expected and 17 (33%) did not respond to P as expected. Of the 29 responsive trials, 22 (44% of 50 trials) were predicted to be responsive to P (true positive; responded to P when they were expected to with P95 fertility index <1), and 7 (14% of 50 trials) were predicted to be non-responsive to P (underperforming; responded to P when they were not expected to with P95 fertility index ≥1). Of the 21 non-responsive trials, 10 (20% of 50 trials) were predicted to be responsive to P (overperforming; did not respond to P when they were expected to with P95 fertility index <1) and 11 (22% of 50 trials) were predicted to be non-responsive to P (true negative; did not respond to P when they were expected not to with P95 fertility index ≥1) (Fig. 4a).
(a) Violin plots of the P fertility index of trials categorised by whether or not a significant response to P was identified in the trial. Trials indicated by trial number from Table 1. Symbol colour represents P95 fertility index in the subsoil (10–30 cm). Data are split into four quadrants; quadrants with white background show trials that performed as expected, and quadrants with grey background show trials that did not perform as expected. Quadrants: A, underperforming (responded to P when they were not expected to with P95 fertility index ≥1); B, true positive (responded to P when they were expected to with P95 fertility index <1); C, true negative (did not respond to P when they were expected not to with P95 fertility index ≥1); D, overperforming (did not respond to P when they were expected to with P95 fertility index <1). Mean subsoil (10–30 cm) P95 fertility index shown in parentheses for each quadrant. (b) Relationship between B coefficient (responsiveness) from Mitscherlich curve fit (see Eqn 2) and P95 fertility index of trial site or control treatment. Trials indicated as per (a). Grey shading represents 95% confidence interval of fitted curve: . Dashed grey arrows represent time course of P fertility and B coefficient for low PBI and high PBI sites where trials were conducted for 4 years.
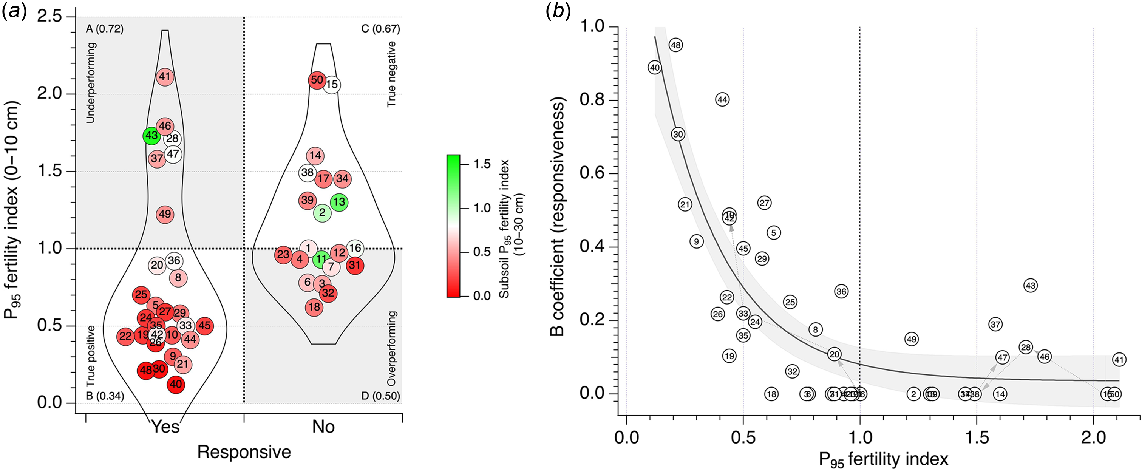
Mean subsoil (10–30 cm) P95 fertility index decreased for responsive and non-responsive trials as the P95 fertility index of 0–10 cm soil decreased. Mean subsoil P95 fertility index was 0.72 for underperforming trials (quadrant A in Fig. 4a), 0.34 for true positive trials (quadrant B), 0.67 for true negative trials (quadrant C), and 0.50 for overperforming trials (quadrant D). For detailed depth-wise changes in P95 fertility index across all trial sites, see Fig. S2.
Forty-seven trials were responsive to the addition of basal nutrients with or without the addition of P, and 41 trials were responsive to basal nutrients when P was not applied. On average, DM of treatments receiving basal nutrients was twice that of treatments without basal nutrients. Responsive sites had a mean P95 fertility index of 0.78 (range 0.12–2.11), whereas non-responsive sites had a mean P95 fertility index of 1.16 (range 0.62–2.09). About half of the non-responsive trials were predicted to respond to P application (overperforming), whereas one-quarter of the responsive trials were not predicted to respond to P application (underperforming), based on P95 fertility index. The median RY of underperforming trials was 89%, or within ~5% of the target RY of 95%. Conversely, the median RY of overperforming trials was 99%, ~5% above the target RY.
The B coefficient, a measure of responsiveness from Mitscherlich curve fits, decreased exponentially as P95 fertility index increased (Fig. 4b). At a P95 fertility index of 1, the B coefficient of the fitted curve was 0.08 ± 0.04, close to the predicted value of 0.05, or 5% response to P. The P95 fertility index decreased and B coefficient increased for the low PBI site systematically along the fitted curve, consistent with the increased responsiveness at this site over time (Figs 4b and 5). The P95 fertility index remained >1 and the B coefficient was either 0 or remained <0.1 for the high PBI site, consistent with no change in P responsiveness at the high PBI site over 4 years (Figs 4b and 5).
(a, b) Dry matter and (c, d) relative yield as a function of P applied with Mitscherlich curve fits for two multi-year trials: (a, c) low PBI site (trial nos 1, 20, 33, 42) and (b, d) high PBI site (trial nos 15, 28, 38, 47), in 2019, 2020, 2021 and 2022, respectively. Circles, basal nutrients applied (see Table 2); squares, basal nutrients not applied. For dry matter, within a trial site and year, treatments with the same letter are not significantly different (P > 0.05); for relative yield, significant differences are not displayed but were the same for the matching graphs.
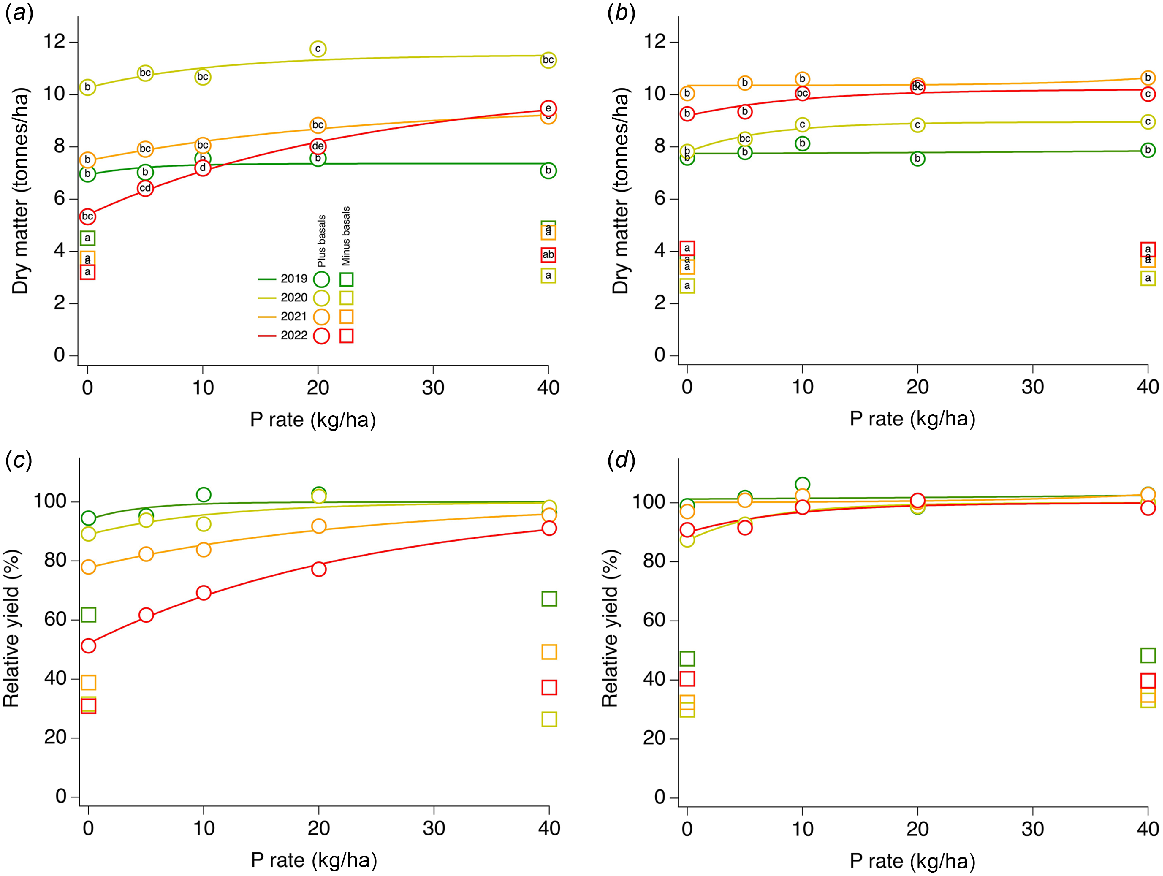
Contrasting low and high PBI trials
Dry matter and RY of two sites with contrasting PBI and initial P95 fertility index values where trials were conducted for 4 years are shown in Fig. 5.
The site for trials 1, 20, 33 and 42 had PBI values of 1, 1.5, 3.2 and 1.8 in the respective, successive trial years. The P95 fertility index of control treatments for each of these successive trials was 1.00, 0.89, 0.50 and 0.44 (Table 1). DM yield for the low PBI site (Fig. 5a) across all P treatments with basal nutrients applied was greatest in 2020, with lower maximum yields in each of the other trial years, and lowest maximum DM in 2019. The greatest DM for the low PBI site in 2020 occurred despite a P95 fertility index <1. DM yields for treatments without basal nutrients applied were up to 50% less than for the same treatments with basal nutrients applied. When presented as RY (Fig. 5c), responsiveness to P increased over time, and RY decreased over time at each P rate except 40 kg P/ha.
Mean tissue-test P concentrations (data not presented in tables or graphs) from control treatments with basal nutrients applied for the low PBI site were 0.26%, 0.17%, 0.15% and 0.12% for successive trial years. For control treatments without basal nutrients applied, mean tissue-test P concentrations were approximately twice those of control treatments with basal nutrients applied, at 0.44%, 0.40%, 0.33% and 0.22% for successive trial years.
When the DM and tissue-test P concentrations were combined, mean P removed in pasture biomass (data not presented in tables or graphs) from control treatments with basal nutrients applied for the low PBI site fell in successive trial years (from 18.1 to 17.8 to 11.0 to 6.4 kg/ha). Mean P removed was not significantly different in the first and second years, but all other pairwise comparisons between years revealed significant differences when assessed using Fisher’s l.s.d. at P = 0.05. Similar trends and amounts of P removed in pasture biomass were observed from control treatments without basal nutrients applied (19.3, 14.1, 12.1, 6.4 kg P/ha). Despite lower biomass, P removed in pasture biomass was similar owing to higher P content of plant tissue in the control treatments without basal nutrients applied. Over 4 years, 52 kg P/ha was removed in pasture biomass from the low PBI site control treatments with or without basal nutrients applied.
The site for trials 15, 28, 38, 47 had PBI values of 153.2, 140.1, 176.5 and 160.6 in the respective, successive trial years. The P95 fertility index of control treatments for each of these successive trials was 2.06, 1.71, 1.49 and 1.61 (Table 1).
The DM yield for the high PBI site (Fig. 5b) across all P treatments with basal nutrients applied was greatest in the third year (2021), with lower maximum yields in each of the other trial years. The greatest DM for the high PBI site in 2021 occurred despite the lowest P95 fertility index in the control treatments over the 4 years. DM yields for treatments without basal nutrients applied were ~50% less than for the same treatments with basal nutrients applied. When presented as RY (Fig. 5d), responsiveness to P for the high PBI site with P95 fertility index ≥1 varied little over time, and RY was maintained at all P application rates from 0 to 40 kg P/ha.
Mean tissue-test P concentrations from control treatments with basal nutrients applied for the high PBI site were 0.26%, 0.25%, 0.19% and 0.24% for successive trial years. For control treatments without basal nutrients applied, mean tissue-test P concentrations were 0.31%, 0.43%, 0.34% and 0.39% for successive trial years.
Mean P removed in pasture biomass from control treatments with basal nutrients applied for the high PBI site was not significantly different, at 19.7, 19.6, 18.9 and 21.9 kg/ha, in successive trial years. Mean P removed in pasture biomass from control treatments without basal nutrients applied was approximately two-thirds that of control treatments with basal nutrient applied. The amount removed was not different in the first 3 years (~11–12 kg P/ha) but did increase significantly in the fourth year (16.2 kg P/ha). Over 4 years at the high PBI site, 80 and 50 kg P/ha was removed in pasture from the respective control treatments with and without basal nutrients applied.
Pasture composition
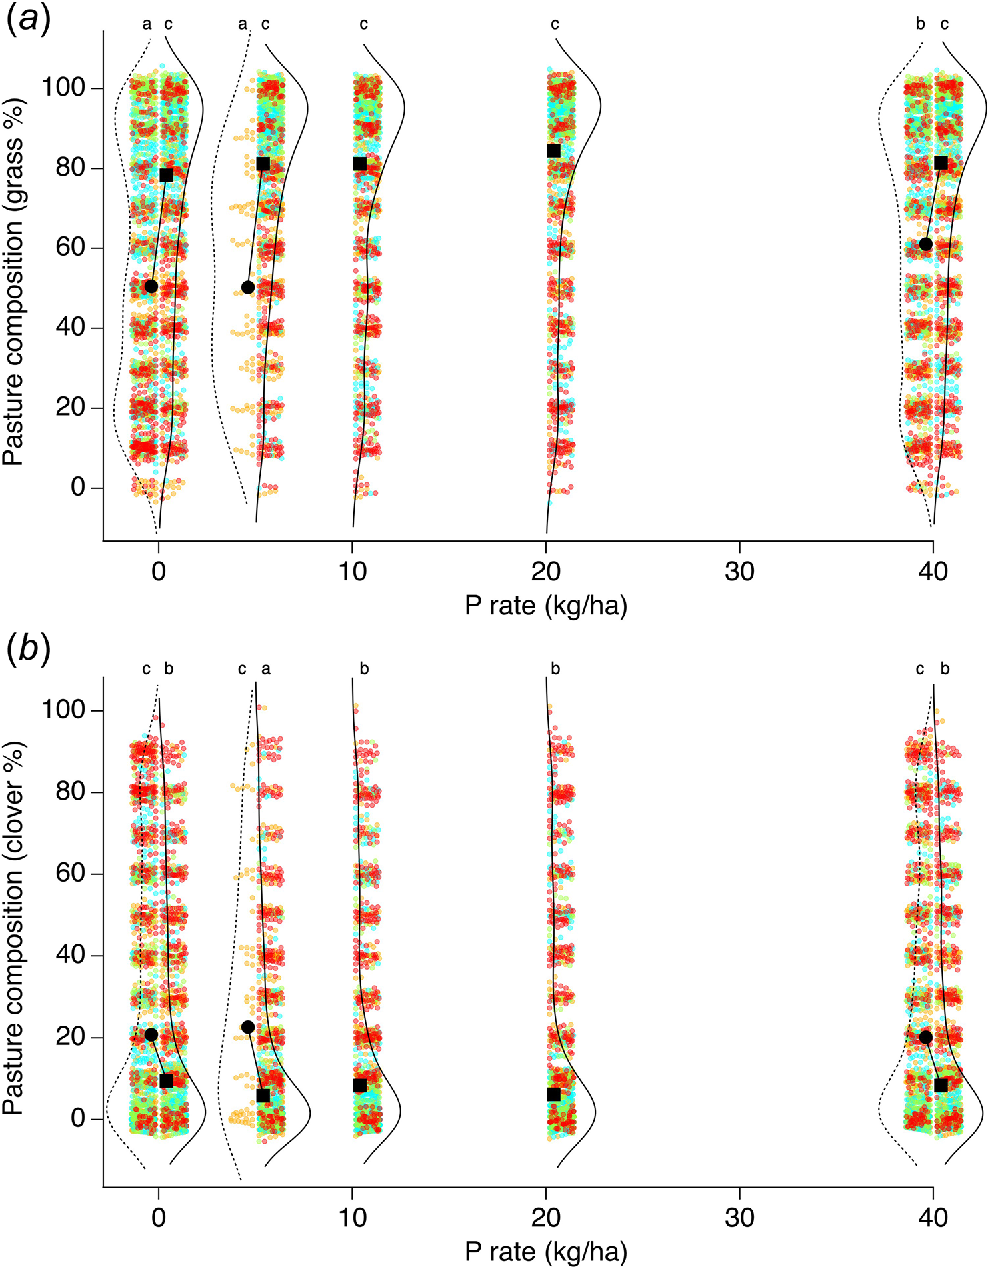
Median pasture composition, as assessed by basal cover, was 50–80% grasses (Fig. 6) across all sites and treatments, and 10–20% clover. Median grass composition was ~80% when basal nutrients were applied, and ~50% without basal nutrients (Fig. 6a). Median clover content decreased with the application of basal nutrients, from median values of 20% to 10% (Fig. 6b). Kruskal–Wallis tests indicated that the changes in composition due to the application of basal nutrients were significant.
Split violin plots of basal cover percentage across all trials for (a) grass and (b) clover for different rates of P applied with (solid curves) and without (dashed curves) basal nutrients applied. Data for the highest P rate (80 kg P/ha) from trials 30, 40 and 48 excluded. Measurements shown for 2019 (orange), 2020 (blue), 2021 (green) and 2022 (red). Gaussian noise added to points to improve visualisation of data density. Median value shown as filled circle (without basal nutrients) or filled square (with basal nutrients), and connecting line illustrates change in median value for a given P rate with and without basal nutrients applied. Treatments with the same letter are not significantly different (P > 0.05).
Comparison with BFDP
The pairs of RY of the control treatments with basal nutrients applied and P95 fertility index of these treatments, and the comparison with the modelled relationship between RY and P95 fertility index for BFDP based on Eqn 5, is shown in Fig. 7a. The data follow the modelled relationship reasonably well, and the fitted curve and 95% confidence interval of the curve fit run parallel to the modelled relationship with a small offset. The trial data represent a wide range of both RY and P95 fertility index values, although the data become less dense for P95 fertility index <0.3. This decreased density coincides with the greatly reduced probability of potential trial sites with P95 fertility index <0.3 from a large commercial dataset. Both the RY and P95 fertility index of the low PBI trial site represented by trials 1, 20, 30 and 42 decreased over 4 years, tracking the fitted relationship, and commenced at a P95 fertility index of 1 and RY of 98%, ending at a P95 fertility index of 0.44 and RY of 56% in year 4. The RY and P95 fertility index of the high PBI trial site represented by trials 15, 28, 38 and 47 tracked the fitted relationship, maintaining RY close to 95%, and commenced at a P95 fertility index of 2.06, ending at a P95 fertility index of 1.61 in year 4.
(a) Scatterplot of relative yield (RY) and P95 fertility index for each trial with curve fit (thin solid line ± s.d.): Transparent red shading indicates 95% confidence band. Thick dashed line overlay shows the BFDP model for 95% RY: . Grey bars show frequency distribution of P95 fertility index of >30 000 commercially sampled paddocks in south-west WA. Dashed grey arrows represent time course of P fertility and RY for the two 4-year trials. Each trial indicated by trial number from Table 1. Symbol colour represents surface soil (0–10 cm) pH(CaCl2). (b) Scatterplot and fitted line (thin solid line with 95% confidence band in transparent red shading) of measured to modelled RY: . Dashed line shows 1:1 relationship. Trials indicated as per (a). Symbol colour represents subsoil (10–30 cm) pH(CaCl2).
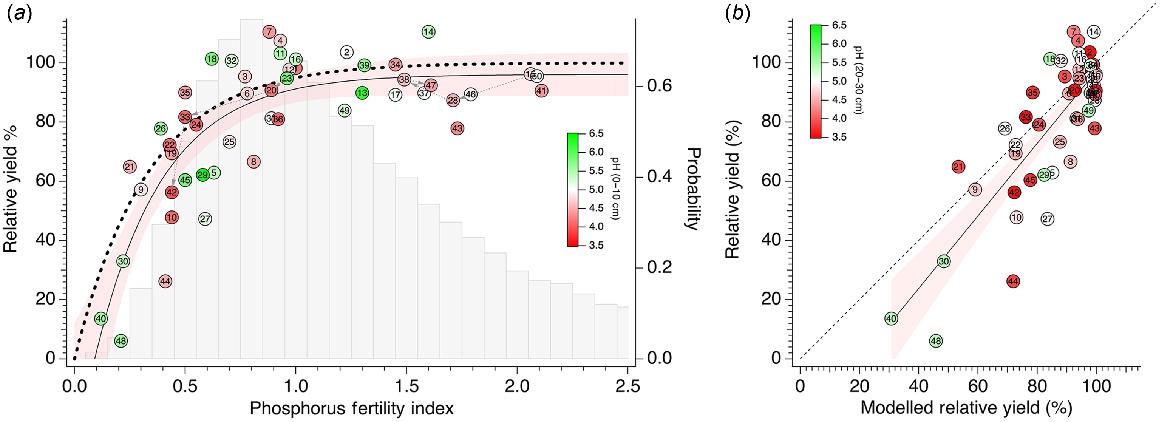
The linear relationship between measured and modelled RY is shown in Fig. 7b. Although not identical to the 1:1 relationship, the data are skewed towards higher RY values, with very few points with RY values <50% having an influence on the trend. Below about 50% RY, there is a tendency for measured RY to be marginally less than modelled RY. The mean pH in respective soil layers 0–10 cm, 10–20 cm and 20–30 cm across all trials was 4.9, 4.5 and 4.6. There was no systematic influence of surface soil (0–10 cm) or subsoil (10–30 cm) pH on the variation of measured RY and P95 fertility index compared with the modelled or expected relationships. For detailed depth-wise changes in pH(CaCl2) across all trial sites, see Fig. S3.
Response coefficients, relationships and critical values
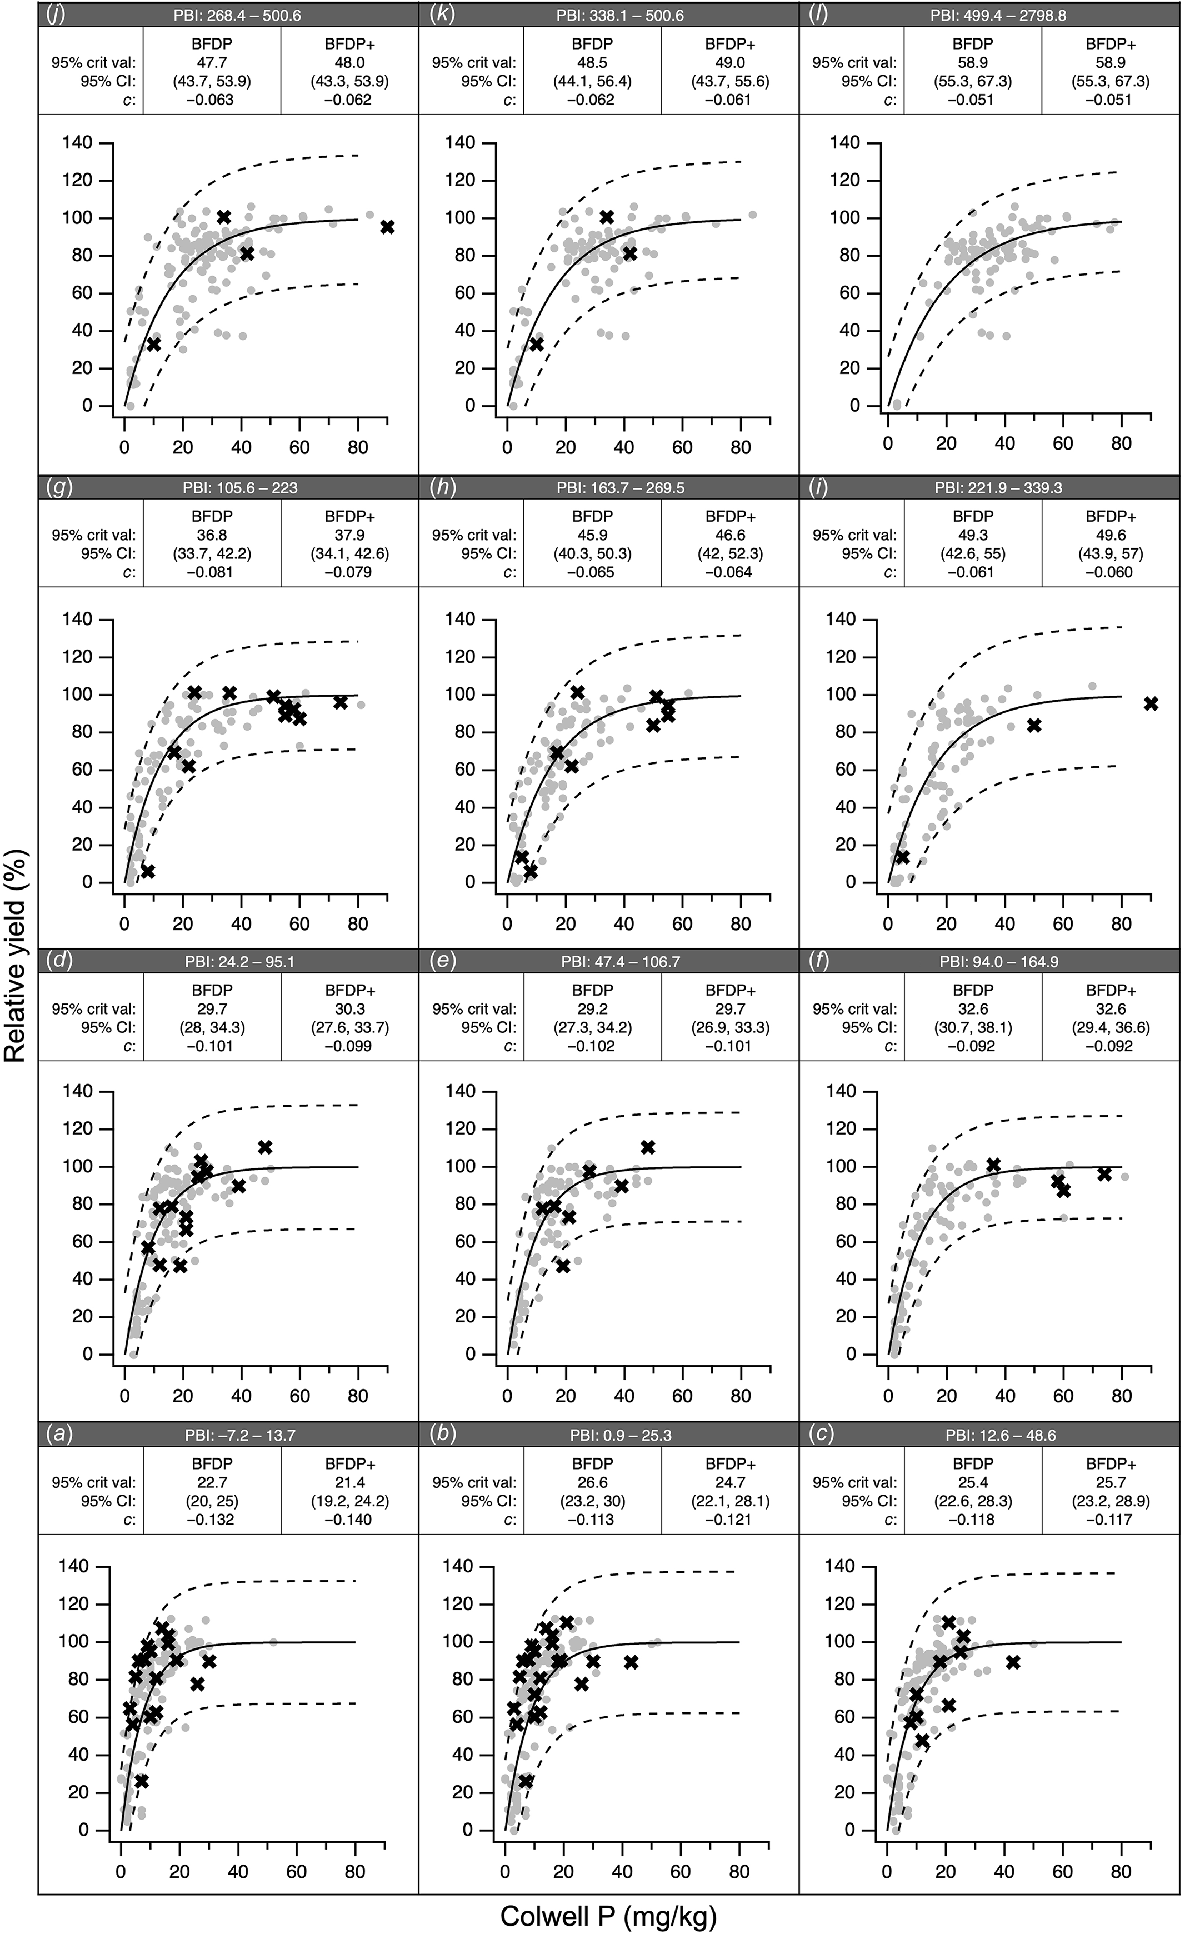
The BFDP data and 95% prediction intervals for the same overlapping PBI ranges as presented in Gourley et al. (2019) are shown in Fig. 8, along with the pairs of Colwell P and RY from this study. Trials from this study fall within the 95% prediction interval boundaries from BFDP for each of the overlapping PBI ranges. Consistent with the BFDP data, as PBI increased, the critical Colwell P value also increased. The critical Colwell P concentrations, 95% confidence intervals, and c coefficients within each PBI range are very similar when determined for the original BFDP dataset or when new data from the trials conducted here are included (BFDP+). Linear regression analysis of critical Colwell P concentrations and c coefficients between BFDP and BFDP+ was close to a 1:1 relationship, with r2 >0.99 (data not shown). The relationships and equations estimating critical Colwell P (Eqn 7) and c coefficient (Eqn 8) from PBI were similar to those reported in Gourley et al. (2019). Following substitution, Eqn 2 can be updated to Eqn 10 based on the full dataset (BFDP+) to estimate critical Colwell P values, and Eqn 5 can be updated to Eqn 9 to estimate RY. Linear regression of critical Colwell P values estimated from Eqn 10 and Eqn 2 (Gourley et al. 2019) had a 1:1 relationship with zero intercept and r2 >0.99.
Response calibrations from the BFDP project for the overlapping P buffering index (PBI) ranges specified in Gourley et al. (2019). BFDP data (grey dots) with fitted response calibration (solid line) and 95% prediction interval (dashed lines). Data from this study overlaid (×). PBI ranges shown: (a) –7.2–13.7, (b) 0.9–25.3, (c) 12.6–48.6, (d) 24.2–95.1, (e) 47.4–106.7, 94–164.9, (f) 105.6–223, (g) 163.7–269.5, (i) 221.9–339.3, (j) 268.4–500.6, (k) 338.1–500.6, (l) 499.4–2798.8. Critical Colwell P, 95% confidence intervals, and c coefficients for BFDP and for BFDP with additional data from the trials in this paper (BFDP+) shown for each pane.
Discussion
Results from the 50 trials are consistent with the national BFDP data, and this demonstrates that they are relevant to the soils of south-west WA and to contemporary pasture species (Fig. S1). The national critical soil-test values for P are validated by the relationship of responsiveness as defined by the B coefficient with P95 fertility index (Fig. 4), by the consistency of trial RY and P95 fertility index pairs with the modelled response relationship (Fig. 7), and by the consistency of trial data Colwell P–RY pairs to response calibration data for overlapping PBI ranges from the national dataset (Fig. 8). Furthermore, addition of 50 trials to the existing dataset did little to change the critical Colwell P values, ranges, or c coefficients within overlapping PBI groups. A strong linear 1:1 relationship between critical Colwell P values from the original dataset (BFDP) and the extended dataset (BFDP+), and similarly for c coefficients, adds further support to this. In addition, the lack of a response to P application for the low PBI trial site in the first year when the control treatment with basal nutrients applied had a P95 fertility index of 1 (Fig. 5) strongly supports the use of a modified equation (Eqn 2) to determine critical Colwell P values when PBI is <15. It is particularly important that extra care and attention is paid to soils with PBI <15 when making fertiliser decisions because of the high potential for P loss (Weaver et al. 2023). Soil P fertility should be monitored frequently to ensure that critical Colwell P values are not exceeded.
That there was a higher percentage of overperforming trials (50% of the non-responsive trials) than underperforming trials (25% of the responsive trials) is worthy of further discussion. For the underperforming trials, the potential RY response to P application was small (~5%), and mostly at the highest P rate (40 kg P/ha). This rate of P would be uneconomic, while also presenting significant potential for P loss to the environment. For overperforming trials, a possible explanation is species composition, and the different P requirements of annual ryegrass over clover. It is widely accepted that clover has a higher P requirement than annual ryegrass (Ozanne et al. 1969, 1976; Helyar and Anderson 1971; Jackman and Mouat 1972; Barrow 1975; Hill et al. 2010; Sandral et al. 2019), and hence pasture composition within trials can influence responsiveness. It is clear from Fig. 6 that even without the application of basal nutrients, annual ryegrass is, on average, more dominant than clover. In addition, where basal nutrients were included, there was a 20–30% increase in annual ryegrass and a 10% reduction in clover. Trial data amalgamated for BFDP (Gourley et al. 2019) were also from trials where N was not applied, and hence, clover was most likely represented at a higher percentage in those trials. It is therefore likely that the critical values from BFDP are conservative for the contemporary annual ryegrass species that were dominant in these validation trials. Although the relationships in Eqns 6 and 7 are very similar to those in Gourley et al. (2019), they do result in slightly lower critical Colwell P values and c coefficients, particularly for low PBI soils better represented in this study. This also suggests that the critical values from BFDP may be conservative, and supports the idea that models used to estimate critical Colwell P values could be modified (reduced) in a similar way to that provided in Gourley et al. (2019) for soils with PBI <15. This approach is consistent with previous studies that report lower critical Colwell P values for low PBI soils (Yeates 1993; Angell 1999; Moody 2007; Bolland and Russell 2010; Windsor et al. 2010), and with the lack of response of the low PBI multi-year trial site examined here (Fig. 5) when its P95 fertility index was optimal at a value of 1 in the first trial year. In summary, P95 fertility index alone did not predict responsiveness correctly for about one-third of trials. A response when not expected (underperforming trials) can be explained by very small (<10%) DM responses to high P applications that are uneconomic, and lack of response when expected (overperforming trials) due to dominance of annual ryegrass over clover.
Other factors need to be considered for underperforming and overperforming trials (Fig. 4a), and for the variability in Fig. 7. These factors include, but are not limited to, access to subsoil P, soil pH, and seasonal influences. An influence of subsoil P on pasture P response, although possible, is likely to be small (Siebers et al. 2021). Underperforming trials had the highest mean levels of subsoil P95 fertility index (0.72) compared with other trial classifications (overperforming, true positive, true negative) (Fig. 4a); hence, it is unlikely that this group of trials is accessing significant quantities of subsoil P to support pasture biomass. Overperforming trials had mean levels of P95 fertility index of 0.50, and this may be sufficient to contribute to pasture biomass. However, if underperforming trials are not accessing subsoil P when they have a higher mean subsoil P95 fertility index, there is no reason that overperforming trials will be accessing significant quantities of subsoil P either. This is consistent with assessments of soil P storage that show significant stratification of soil P under annual grazed pastures for soils with low PBI, whereby two-thirds of soil P stocks were found in the top 10 cm of profiles assessed to 1 m depth (Weaver and Summers 2021).
Soil pH has been identified previously as a potential constraint on pasture production in these trials (Rogers et al. 2021). However, when included as a covariate in Fig. 7, no systematic effect of either surface soil or subsoil pH on either increasing or decreasing RY is seen. For example, sites with both low and high pH show similar variation in measured RY compared with modelled RY values. If decreases in measured RY were to be observed, they would most likely occur where both low pH and low P fertility exist (Weaver et al. 2020), and where low soil pH would further reduce access to P already in short supply.
Seasonal factors can also influence measurements of DM, and the estimated P response of pastures. This is evident in the year-to-year measurements of DM (Fig. 5) that are not consistent with changes of soil P status; however, converting DM measurements to RY removes much of the seasonal effect. For example, DM measurements at the high PBI trial site (trials 15, 28, 38, 47) switched from being classified as non-responsive to responsive to non-responsive to responsive in successive years 2019, 2020, 2021 and 2022. Interannual seasonal factors such as rainfall amount, rainfall timing, temperature, solar radiation, evapotranspiration, soil moisture and degree-days all influence DM production (McKenzie et al. 1999; Blair 2008), and potentially the measured P response.
The two trials that ran for 4 years but with very different soil PBI levels provide additional useful insights. The control treatment (0 kg P/ha) with basal nutrients applied for the low PBI site (Table 1, Fig. 5) commenced at a P95 fertility index of 1 and showed a systematic reduction in P95 fertility index (Table 1) and RY (Fig. 5c) and an increase in the B coefficient (Fig. 4) over 4 years. These changes were due to removal of pasture and associated P from the control treatment, equivalent to 52 kg P/ha over 4 years. By contrast, the control treatment (0 kg P/ha) with basal nutrients applied for the high PBI site commenced at a P95 fertility index of 2.06, and showed some reduction in P95 fertility index (Table 1), but little or no systematic change in RY (Fig. 5d) or B coefficient (Fig. 4) over 4 years. This lack of change in RY or B was despite the removal of 80 kg P/ha in pasture biomass over 4 years. Each of these trial sites was fenced to exclude stock, with no opportunity to recycle ≥90% of ingested nutrients (Hutton et al. 1967), and had full removal of pasture biomass and associated nutrients. For the control plots with basal nutrients applied where there was a cessation of P inputs for 4 years, the amount of P removed in pasture biomass decreased in successive years for the low PBI site but not for the high PBI site. The significant reduction in P removed in pasture biomass for the low PBI site with a cessation of P inputs is consistent with reductions in the P95 fertility index below a value of 1 and increase in B coefficient at this site over time. By contrast, the high PBI site with a cessation of P inputs showed no reduction in the amount of P removed in pasture biomass while the P95 fertility index remained >1 and the B coefficient remained close to zero for the successive trial years.
However, full removal of pasture biomass is an unrealistic farming scenario. Even when pasture paddocks are locked up for hay, they will be grazed at some point in a seasonal cycle, and a large percentage of ingested nutrients will be returned to the soil as manure and urine when grazing occurs. So, although the direction of changes in P95 fertility index, B coefficient and P removal in pasture described here for the low and high PBI trial sites when there is a cessation of P inputs is sensible and consistent with agronomic theory (Black 2019), the magnitude of change over time (rate) will be significantly less in a typical farming system. This is because not all paddocks are used to cut hay and have such high amounts of P removal in pasture (~20 kg P/ha) if soil fertility is adequate, and because the amount of P exported from grazed paddocks as agricultural products is much lower than from the trials in this study. For example, exports of P in agricultural products from sheep, beef and dairy grazing are typically 1, 2 and 7 kg P/ha (Weaver and Wong 2011), 3–20 times lower than for full pasture removal when P95 fertility index is ≥1. A cessation of P inputs at the low PBI site could lead to a reduction in RY by 50% after 4 years, but this would only occur if all pasture was removed in successive years, and if basal nutrients are also applied. Under sheep, beef and dairy grazing scenarios, respectively, it would take up to 20, 10 and 3 times longer to realise a 50% reduction in RY depending on climatic conditions and P losses via leaching. Whereas the amount of P removed in animal products is small compared with that removed by pasture, the inclusion of animals significantly increases the likelihood that P can be lost via leaching and runoff by the conversion of environmentally benign P in plants to soluble forms in manure (Aarons et al. 2020). Hence, although the inclusion of grazing animals may increase the time taken to realise reductions in P95 fertility index because of lower P exports in products than with pasture removal alone, the environmental losses when grazing animals are included will be higher, shortening the time taken to reduce P fertility when there is a cessation of P inputs (Tyson et al. 2020).
The trial results confirm that adding more P does not increase productivity when the Colwell P soil test is above the critical value. Doing so may increase the risk of nutrient loss and fertiliser costs. Correcting nutrient deficiencies according to the Sprengel–Liebig law of the minimum (van der Ploeg et al. 1999) can greatly increase production. This is evident when applying basal nutrients, which significantly increased DM regardless of the P supply from the soil alone or soil with applied P. The law of diminishing returns was also observed, where increases in DM decrease as the P application rate increases. In cases where there was already sufficient P in the soil, further P application did not lead to additional DM increases. The results also show the importance of RY over DM measurements in the development and interpretation of critical soil-test values (Correndo et al. 2023).
Removal of constraints of other nutrients (e.g. N, K and S) can result in significant increases in DM when P is at optimum levels. However, fluctuations in rainfall can also impact DM yield. Therefore, it is important to consider RY when determining critical values for soil tests, because they are influenced by factors such as soil PBI.
These trials highlight the importance of soil testing for making informed decisions about fertiliser use. The findings are also consistent with other experiments (Cotching and Burkitt 2011; Sandral et al. 2019) that identified no pasture response above Olsen soil-test P of ~15 mg/kg (Gourley et al. 2019). It is recommended to transition from the traditional approach of annual P applications without considering the actual need, to a maintenance phase based on soil testing. This shift can help to prevent unnecessary accumulation of P and reduce offsite water quality issues (Weaver et al. 2023). By reallocating current P expenditure, landholders can focus on other constraints in order to increase production while minimising environmental impacts. In addition to the validation of critical soil P values, other aspects of this work offer opportunities to increase the ease, convenience and usefulness of soil P metrics. The use of a P fertility index presents opportunities to simplify the interpretation of soil-test P data for industry and growers around a simple-to-remember target value of 1. The use of a P fertility index also supports the rescaling of PBI-dependent Colwell P values to a common measurement scale, allowing aggregation, analysis and presentation of otherwise disparate soil-test and agronomic data. All of these aspects are important when considering the secondary objectives of this study, to motivate growers and industry to accept and utilise critical soil-test P metrics for evidence-based fertiliser recommendations, leading to improved profitability for landholders, and enhancing water quality by reducing excessive P levels in the soil (Bartel and Barclay 2011).
Data availability
The data that support this study cannot be publicly shared for ethical or privacy reasons and may be shared upon reasonable request to the corresponding author if appropriate.
Declaration of funding
This work is jointly funded through Royalties for Region’s Healthy Estuaries WA and the Australian Government’s National Landcare Program.
Acknowledgements
The project team thanks the farmers who contributed by offering access to paddocks for this work, as well as members of the Technical Reference Group who contributed to the trial design and site selection, including farmers and representatives from Soil Water and Nutrients Consulting, Fertiliser Australia, CSBP, Summit Fertilisers, Nutrien Ag Solutions, Western Beef Association Inc., Meat & Livestock Australia, Dairy Australia, Western Dairy, University of Western Australia, Murdoch University, and Western Australian Department of Primary Industry and Regional Development and Department of Water and Environmental Regulation.
References
Aarons SR, Gourley CJP, Powell JM (2020) Nutrient intake, excretion and use efficiency of grazing lactating herds on commercial dairy farms. Animals 10, 390.
| Crossref | Google Scholar | PubMed |
Barrow NJ (1975) The response to phosphate of two annual pasture species. I. Effect of the soil’s ability to adsorb phosphate on comparative phosphate requirement. Australian Journal of Agricultural Research 26, 137-143.
| Crossref | Google Scholar |
Bartel R, Barclay E (2011) Motivational postures and compliance with environmental law in Australian agriculture. Journal of Rural Studies 27, 153-170.
| Crossref | Google Scholar |
Blair IC (2008) Application of climate data to predict pasture production. Journal of New Zealand Grasslands 70, 153-158.
| Crossref | Google Scholar |
Blair GJ, Chinoim N, Lefroy RDB, Anderson GC, Crocker GJ (1991) A soil sulfur test for pastures and crops. Soil Research 29, 619-626.
| Crossref | Google Scholar |
Bolland MDA, Russell WK (2010) Changes in chemical properties of 48 intensively grazed, rain-fed dairy paddocks on sandy soils over 11 years of liming in south-western Australia. Australian Journal of Soil Research 48, 682-692.
| Crossref | Google Scholar |
Brereton RG (2021) Contingency tables, confusion matrices, classifiers and quality of prediction. Journal of Chemometrics 35, e3331.
| Crossref | Google Scholar |
Burkitt LL, Moody PW, Gourley CJP, Hannah MC (2002) A simple phosphorus buffering index for Australian soils. Australian Journal of Soil Research 40, 497-513.
| Crossref | Google Scholar |
Colwell J (1965) An automatic procedure for the determination of phosphorus in sodium hydrogen carbonate extracts of soils. Chemical Industry 22, 893-895.
| Google Scholar |
Correndo AA, Pearce A, Bolster CH, Spargo JT, Osmond D, Ciampitti IA (2023) The soiltestcorr R package: an accessible framework for reproducible correlation analysis of crop yield and soil test data. SoftwareX 21, 101275.
| Crossref | Google Scholar |
Cotching WE, Burkitt LL (2011) Soil phosphorus effects on ryegrass (Lolium perenne L.) production on a Hydrosol in Tasmania. New Zealand Journal of Agricultural Research 54, 193-202.
| Crossref | Google Scholar |
Dowling C, Blaesing D (2022) Plant sampling for agriculture – a guide. Fertilizer Australia, Canberra, ACT, Australia. Available at https://fertilizer.org.au/Portals/0/Documents/Fertcare/Fertcare%20Plant%20Sampling%20Guide.pdf?ver=2022-10-06-003031-340
Gourley CJP, Weaver DM (2012) Nutrient surpluses in Australian grazing systems: management practices, policy approaches, and difficult choices to improve water quality. Crop & Pasture Science 63, 805-818.
| Crossref | Google Scholar |
Gourley C, Weaver D (2019) A guide for ‘fit for purpose’ soil sampling. Fertilizer Australia, Canberra, ACT, Australia. Available at https://fertilizer.org.au/Portals/0/Documents/Fertcare/Fertcare%20Soil%20Sampling%20Guide.pdf?ver=2019-06-17-095413-863
Gourley CJP, Weaver DM, Simpson RJ, Aarons SR, Hannah MM, Peverill KI (2019) The development and application of functions describing pasture yield responses to phosphorus, potassium and sulfur in Australia using meta-data analysis and derived soil-test calibration relationships. Crop & Pasture Science 70, 1065-1079.
| Crossref | Google Scholar |
Gramm J, Guo J, Hüffner F, Niedermeier R, Piepho H-P, Schmid R (2007) Algorithms for compact letter displays: comparison and evaluation. Computational Statistics & Data Analysis 52, 725-736.
| Crossref | Google Scholar |
Hayes RC, Rohan M, Li GD, Orgill SE, Poile GJ, Oates AA, Conyers MK (2022) The nature of spatial variability of four soil chemical properties and the implications for soil sampling. Journal of Soils and Sediments 22, 3006-3017.
| Crossref | Google Scholar |
Helsel D, Hirsch R (1992) ‘Statistical methods in water resources.’ (US Geological Survey: Reston, VA, USA) Available at https//pubs.usgs.gov/twri/twri4a3/pdf/twri4a3-new.pdf
Helyar KR, Anderson AJ (1971) Effects of lime on the growth of five species, on aluminium toxicity, and on phosphorus availability. Australian Journal of Agricultural Research 22, 707-720.
| Crossref | Google Scholar |
Hill JO, Simpson RJ, Ryan MH, Chapman DF (2010) Root hair morphology and mycorrhizal colonisation of pasture species in response to phosphorus and nitrogen nutrition. Crop & Pasture Science 61, 122-131.
| Crossref | Google Scholar |
Hintze JL, Nelson RD (1998) Violin plots: a box plot-density trace synergism. The American Statistician 52, 181-184.
| Crossref | Google Scholar |
Hutton JB, Jury KE, Davies EB (1967) Studies of the nutritive value of New Zealand dairy pastures. New Zealand Journal of Agricultural Research 10, 367-388.
| Crossref | Google Scholar |
Jackman RH, Mouat MCH (1972) Competition between grass and clover for phosphate. New Zealand Journal of Agricultural Research 15, 653-666.
| Crossref | Google Scholar |
Melland AR, Mc Caskill MR, White RE, Chapman DF (2008) Loss of phosphorus and nitrogen in runoff and subsurface drainage from high and low input pastures grazed by sheep in southern Australia. Australian Journal of Soil Research 46, 161-172.
| Crossref | Google Scholar |
Moody PW (2007) Interpretation of a single-point P buffering index for adjusting critical levels of the Colwell soil P test. Soil Research 45, 55-62.
| Crossref | Google Scholar |
Moody PW, Speirs SD, Scott BJ, Mason SD (2013) Soil phosphorus tests I: what soil phosphorus pools and processes do they measure? Crop & Pasture Science 64, 461-468.
| Crossref | Google Scholar |
Ozanne PG, Keay J, Biddiscombe EF (1969) The comparative applied phosphate requirements of eight annual pasture species. Australian Journal of Agricultural Research 20, 809-818.
| Crossref | Google Scholar |
Ozanne PG, Howes KMW, Petch A (1976) The comparative phosphate requirements of four annual pastures and two crops. Australian Journal of Agricultural Research 27, 479-488.
| Crossref | Google Scholar |
Plunkett M, Wall D, Sheil T (2019) The efficient use of phosphorus in agricultural soils. Technical Bulletin Series - No. 4. The Fertilizer Association of Ireland in association with Teagasc. Ireland. Available at https://www.fertilizer-assoc.ie/wp-content/uploads/2023/01/The-Efficient-Use-of-Phosphorus-In-Agricultural-Soils-Tech-Bulletin-No.-4.pdf
Puckridge DW, French RJ (1983) The annual legume pasture in cereal – ley farming systems of southern Australia: a review. Agriculture, Ecosystems & Environment 9, 229-267.
| Crossref | Google Scholar |
Revell CK, Ewing MA, Nutt BJ (2012) Breeding and farming system opportunities for pasture legumes facing increasing climate variability in the south-west of Western Australia. Crop & Pasture Science 63, 840-847.
| Crossref | Google Scholar |
Roberts D, Dolling P (2020) Annual pasture quantity and quality in South West Western Australia. Available at https://www.agric.wa.gov.au/pastures/annual-pasture-quantity-and-quality-south-west-western-australia?fbclid=IwAR2c3-nkYEy6Ltc3D2-49jtYan1eybtl-y0U40lo-AN3CNzUCEC0J2tC4lc [accessed 15 December 2024]
Rogers D, Weaver D, Summers R, Dobbe E, Master R, McFerran R, Mussell G, Dawson L, Mercy J, Richards P, Holtham D (2021) Critical phosphorus values from the Better Fertiliser Decisions for Pastures project: early insights from validation trials. Crop & Pasture Science 731-741.
| Crossref | Google Scholar |
Sandral GA, Price A, Hildebrand SM, Fuller CG, Haling RE, Stefanski A, Yang Z, Culvenor RA, Ryan MH, Kidd DR, Diffey S, Lambers H, Simpson RJ (2019) Field benchmarking of the critical external phosphorus requirements of pasture legumes for southern Australia. Crop & Pasture Science 70, 1080-1096.
| Crossref | Google Scholar |
Siebers N, Wang L, Funk T, von Tucher S, Merbach I, Schweitzer K, Kruse J (2021) Subsoils – a sink for excess fertilizer P but a minor contribution to P plant nutrition: evidence from long-term fertilization trials. Environmental Sciences Europe 33, 60.
| Crossref | Google Scholar |
Simpson R, Graham P, Davies L, Zurcher E (2009) Five easy steps to ensure you are making money from superphosphate. Decision support tool. CSIRO & Industry and Investment NSW, Sydney. Available at https://www.mla.com.au/globalassets/mla-corporate/extensions-training-and-tools/5-easy-steps-guide.pdf
Simpson RJ, Oberson A, Culvenor RA, Ryan MH, Veneklaas EJ, Lambers H, Lynch JP, Ryan PR, Delhaize E, Smith FA, Smith SE, Harvey PR, Richardson AE (2011) Strategies and agronomic interventions to improve the phosphorus-use efficiency of farming systems. Plant and Soil 349, 89-120.
| Crossref | Google Scholar |
Speirs SD, Reuter DJ, Peverill KI, Brennan RF (2013) Making better fertiliser decisions for cropping systems in Australia: an overview. Crop & Pasture Science 64, 417-423.
| Crossref | Google Scholar |
Tyson J, Corkrey R, Burkitt L, Dougherty W (2020) Modelling changes in soil phosphorus when phosphorus fertiliser is reduced or ceases. Frontiers in Environmental Science 8, 93.
| Crossref | Google Scholar |
van der Ploeg RR, Böhm W, Kirkham MB (1999) On the origin of the theory of mineral nutrition of plants and the law of the minimum. Soil Science Society of America Journal 63, 1055-1062.
| Crossref | Google Scholar |
Wasserstein RL, Schirm AL, Lazar NA (2019) Moving to a world beyond “p < 0.05”. The American Statistician 73, 1-19.
| Crossref | Google Scholar |
Weaver DM, Reed AEG (1998) Patterns of nutrient status and fertiliser practice on soils of the south coast of Western Australia. Agriculture, Ecosystems & Environment 67, 37-53.
| Crossref | Google Scholar |
Weaver D, Summers R (2021) Phosphorus status and saturation in soils that drain into the Peel Inlet and Harvey Estuary of Western Australia. Soil Research 59, 699-714.
| Crossref | Google Scholar |
Weaver DM, Wong MTF (2011) Scope to improve phosphorus (P) management and balance efficiency of crop and pasture soils with contrasting P status and buffering indices. Plant and Soil 349, 37-54.
| Crossref | Google Scholar |
Weaver D, Summers R, Rogers D, Richards P (2020) The effect of soil pH on phosphorus content of clover pasture. Resource management technical report 417. Department of Primary Industries and Regional Development, Perth, WA, Australia. Available at https://library.dpird.wa.gov.au/rmtr/402/
Weaver D, Summers R, Rogers D, Richards P, Rowe D (2021) Assessment of soil sampling equipment for guiding fertiliser decisions. Resource Management Technical Report 423. Department of Primary Industries and Regional Development, Western Australian Government, Perth, WA, Australia. Available at https://library.dpird.wa.gov.au/rmtr/406/
Weaver D, Summers R, Neuhaus A (2023) Agronomic soil tests can be used to estimate dissolved reactive phosphorus loss. Soil Research 61, 627-646.
| Crossref | Google Scholar |
Windsor D, Bolland M, Weaver D, Russell B (2010) Implementing the Fertiliser Action Plan an industry led approach based on Fertcare. In ‘Australian fertilizer industry conference’. August 2010, Gold Coast, Qld, Australia. (Fertilizer Australia) Available at https://fertilizer.org.au/Portals/0/Documents/Conf2010/Fertilizer%20Action%20Plan%20Update%20-%20Windsor%20-%20Paper.pdf?ver=2016-01-29-120300-180
Yeates JS (1993) Changing fertiliser practices. Fertilizer Research 36, 135-140.
| Crossref | Google Scholar |