

One hundred years of comparative genetic and physical mapping in cultivated oat (Avena sativa)
Charlene P. Wight A * , Victoria C. Blake B C , Eric N. Jellen D , Eric Yao B E , Taner Z. Sen B E and Nicholas A. Tinker A
A
B
C
D
E
Abstract
Researchers have been accumulating information concerning the locations of genes and quantitative trait loci (QTLs) in cultivated oat (Avena sativa L.) for more than 100 years.
The aim of this work was to create an inventory of genes and QTLs found in cultivated hexaploid oat and produce tools to make this resource more useful.
By using the positions of perfectly matched, single nucleotide polymorphism markers, each centimorgan (cM) location along the consensus map was assigned to a location on the OT3098 v2 physical map found on the GrainGenes database website (https://wheat.pw.usda.gov/jb/?data=/ggds/oat-ot3098v2-pepsico). This information was then used to assign physical locations to the genes and QTLs in the inventory, where possible.
A table comparing the major genetic maps of hexaploid oats to each other, to the 2018 oat consensus map, and to physical chromosomes was produced. Genome browser tracks aligning the consensus map regions and the locations of the genes and QTLs to OT3098 v2 were added to GrainGenes.
Many oat genes and QTLs identified using genetic mapping could be assigned positions on physical oat chromosomes. However, many of these assigned regions are quite long, owing to the presence of large areas of reduced recombination. Specific examples of identified patterns of recombination between the genetic and physical maps and validated gene and QTL locations are discussed.
These resources will assist researchers performing comparative genetic and physical mapping in oat.
Keywords: Avena, comparative mapping, curation, genes, genetic maps, molecular markers, oat, quantitative trait loci.
Introduction
Over a century ago, people interested in improving cultivated oats (Avena sativa L.) were observing that certain characters were always present together. In the early 20th Century, well before the structure of DNA had been elucidated, researchers began performing experiments and making inter- and intra-specific crosses of Avena material to examine these relationships in more detail. The traits studied were most often related to diaspore characters and resistance to crown and stem rust disease. A summary of this early work can be found in Simons et al. (1978), and was expanded by Marshall and Shaner (1992). Some of the genes for these traits were found to occur in tightly linked clusters, described by Luke et al. (1960) as ‘nests’ of genes.
By 1992, various types of markers, including the newer isozyme and restriction fragment length polymorphism (RFLP) molecular markers, were being used to develop genetic maps of different oat species. The first full molecular marker reference map of the oat genome was of the diploid oat cross A. atlantica (M66/3)/A. hirtula (Cc7050-CAV4490) (A×H; O’Donoughue et al. 1992). At the same time, partial maps focusing on one or a few traits of interest were still being constructed; for example, Howes et al. (1992) demonstrated that avenin proteins are linked to the stem rust resistant gene pg-9 in A. sativa. The first full reference map of the hexaploid oat genome was of the red by white oat cross A. byzantina cv. Kanota/A. sativa cv. Ogle (K×O; O’Donoughue et al. 1995). In 2016, a consensus map comprising data from 12 biparental mapping populations (including K×O) was published (Chaffin et al. 2016). The 2018 consensus map built upon this to include >90 000 additional markers (Bekele et al. 2018).
With the advent of more complete molecular marker maps, quantitative traits controlled by more than one gene could be mapped. The first comprehensive QTL (quantitative trait locus) map was of the K×O cross, where traits such as heading date, height and yield were mapped by Siripoonwiwat et al. (1996). In the years since, more and more QTLs and single-gene loci have been mapped in various types of populations, including association mapping panels.
Some of the genetic resources used to produce these maps can still be accessed and used, but over time, most seed stocks, plant tissue and DNA samples have been lost. Even if the parental lines were still available, it would take an inordinate amount of time, effort and funding to reproduce a population, genotype it using the latest technology, and phenotype it in multiple environments. For this reason, it is important to ensure that the information from these studies is collected in one place and preserved for breeders and other researchers. The GrainGenes database (https://wheat.pw.usda.gov; Yao et al. 2022) was established in 1992 to do just that.
GrainGenes contains data related to molecular mapping from wheat, barley, rye and oat and provides analysis tools such as the CMap comparative mapping tool (Fang et al. 2003) and genome browsers. More complete reference maps had been the focus of the database; however, resources became available to allow for the addition of smaller oat maps in 2019 (Blake et al. 2019). As part of this exercise, the older ‘classical genetics’ maps were put into molecular map format and included as well. This has resulted in dozens more maps being curated and stored in one stable location, and work is ongoing to add all of the available information.
As sequencing technologies have become more reliable and much less expensive, it is now possible to produce physical maps of Avena spp. chromosomes. The first ones published were for the diploid oats A. atlantica (Cc 7277) and A. eriantha (CN 19328) (Maughan et al. 2019). In 2020, PepsiCo, in collaboration with Corteva Agrisciences, released the completed sequence of the A. sativa line OT3098 to the public via GrainGenes (Avena sativa – OT3098 v1, PepsiCo, https://wheat.pw.usda.gov/GG3/graingenes_downloads/oat-ot3098-pepsico). An updated version (v2) was released in 2021 (Avena sativa– OT3098 v2, PepsiCo, https://wheat.pw.usda.gov/jb?data=/ggds/oat-ot3098v2-pepsico). These sequences are also available in the GrainGenes database as JBrowse tracks. Recently published sequences from studies by Kamal et al. (2022) and Peng et al. (2022) are also available at GrainGenes, and it is expected that sequences from the first oat pangenome project (PanOat) will be made public very soon.
As the technologies used to discover new information concerning oat genes and QTLs have evolved, and as the amount of information generated has increased, it has become more and more difficult to keep track of the scientific studies that have been done, even when most of the research outcomes have been collected in one place. This difficulty was exacerbated by the plethora of physical maps that have been generated in recent years.
The objectives of this study were to develop curated genetic and physical resources and approaches to guide users in their work by:
creating a table of individual hexaploid oat maps linked to the consensus map and OT3098 v2 chromosomes
aligning the locations of cM (centimorgan) regions from the 2018 Mrg map to the OT3098 v2 sequence and providing tools to visualise them
producing an inventory of genes and QTLs found in hexaploid oat, locating them on the OT3098 v2 physical map where possible, and providing tools to visualise them
validating the approach used to align the genetic and physical maps.
The collected information will provide the oat research community with a guide to which traits are associated with which chromosome regions, and to which regions have issues that could make studying particular genes and QTLs more difficult (e.g. those with reduced recombination or where there is evidence of structural variation).
Materials and methods
Sources of information
Maps of the hexaploid cultivated oat, Avena sativa L., both genetic and physical, were located in the GrainGenes database (https://wheat.pw.usda.gov; Yao et al. 2022) or through literature searches. All marker, trait and associated information from these maps was downloaded and compiled in an MS Access database that was used as a means to produce the tools described in this work.
Linking individual hexaploid oat maps to the consensus map and OT3098 v2 chromosomes
Only the more complete maps were included in the comparison. Smaller maps that focused on one or two regions only, those maps that used other maps as a framework, and maps with too few markers in common with other maps were not included. This resulted in 28 of 215 maps being used.
The markers from each map identified as being present on the consensus map were assigned the corresponding 2018 Mrg map linkage group names and cM distances. Marker name synonyms were handled through the use of a ‘Preferred name’ table. A simple sorting of the markers by original linkage group and position allowed for the assignment of Mrg linkage group names to those linkage groups in many cases. Information from SNP (single nucleotide polymorphism) marker locations on the OT3098 v2 physical map was used when available. Linkage groups were also lined up by using the CMap tool in GrainGenes (https://wheat.pw.usda.gov/cgi-bin/cmap/viewer?submit=Data+Source%3A&data_source=GrainGenes). Linkage groups with few or no markers in common with the 2018 Mrg map were assigned a Mrg linkage group through the use of intermediate maps, where possible.
Linkage maps were initially assigned to physical chromosomes either by looking for disappearance of a marker in a genotyped nullisomic plant compared with its disomic genotype-of-origin; or by creating hybrids between a given disomic parent and a series of monosomic lines isolated in the genetic background of a contrasting parent and looking for disappearance of marker-bands from the monosomic-series parent in those monosomic F1 hybrids (Fox et al. 2001). Identities of monosomes and nullisomes in two aneuploid series, Kanota (Morikawa 1985) and Sun II (Hacker and Riley 1965), were first identified via C-banding and then used for this purpose (Jellen et al. 1993, 1997; Oliver et al. 2013).
Defining the location of cM regions from the 2018 Mrg map on the OT3098 v2 sequence
The ‘Avgbs’ SNP marker set (Bekele et al. 2018) was used to define the chromosomal regions covered by the markers at each cM distance along the 2018 Mrg map linkage groups, because large numbers of Avgbs markers are found on the 2018 Mrg map, and a genome browser track showing the locations of Avgbs markers with perfect 64 base matches to OT3098 v2 was already available (https://wheat.pw.usda.gov/jb/?data=%2Fggds%2Foat-ot3098v2-pepsico – track ‘GBS markers’; N. Tinker, unpublished data). There are 43 111 unique Avgbs sequences mapped on the 2018 Mrg map, and 112 796 unique Avgbs sequences mapped to the OT3098 v2 chromosomes (including chrUn, for chromosome unknown). Of these, 24 822 Avgbs sequences can be found on both. For these markers, the physical distances covered by the Avgbs markers at each cM location along the 2018 Mrg map linkage groups were determined. Some markers had more than one perfect match, and these were assigned to two or more locations. Results were recorded for each cM region as ‘chr##-Mrg##_###’, with the final digits being cM distances. It was noted where only one marker defined a cM region and whether the location assigned was primary or secondary (i.e. expected or unexpected, based on the linkage group as a whole).
Populating the inventory of genes and QTLs
Most of the early gene association studies involved interspecific crosses and assessed linkages between characters associated with domestication. Information from those studies was not included in the inventory. Otherwise, all articles published in 2022 or earlier are included. Also left out of the inventory were gene clone, isozyme, and RGA (resistance gene analogue) markers, unless they were associated with specific traits mapped by phenotype.
Single genes located in different populations were differentiated by adding the abbreviated name of the population to the gene name. The QTL names assigned in the literature were used as-is unless there were duplications. For these QTLs, and for those to which no name had been assigned, names were assigned following the rules recently published by the International Oat Nomenclature Committee (Jellen et al. 2024; https://wheat.pw.usda.gov/GG3/oatnomenclature).
For each QTL, the markers at each end of the defined region were recorded in the MS Access database. For single genes and those QTLs defined by single markers, the same marker was recorded twice. Markers also found on the 2018 Mrg map were assigned the corresponding Mrg linkage group name and cM distance. For those not found on the consensus map, the CMap tool in GrainGenes was used to identify the closest marker outside of the QTL region. Occasionally, this region had to be expanded to the end of the linkage group. In the case of some single genes, results from classical genetics studies were used to assign their locations.
Once these assignments were made, the table of cM regions and corresponding physical distances was used to assign a physical location to each gene or QTL. If a particular cM region had no location information (i.e. if the Avgbs markers (if any) at that location did not have perfect matches to OT3098 v2), then the next region further out was assigned instead (e.g. genes at 79 cM on Mrg19 ended up with ranges covering 78 to 85 cM).
Validating the results
Some of the results were validated using the standard BLAST (Basic Local Alignment Search Tool; Altschul et al. 1990) service provided by GrainGenes (https://wheat.pw.usda.gov/blast/), as well as the BLAST tools associated with the OT3098 v2 genome browser track (Yao et al. 2022). For example, BLAST searches of nine rust- and avenin-related RFLP clones and PCR-based markers contributed to the work described in Table 1.
| Feature | Start | Stop | Feature ID | Note | |
|---|---|---|---|---|---|
| Gene | 472976091 | 472982622 | AVESA.00001b.r3.3Dg0002729 | Rust resistance kinase Lr10 | |
| Gene | 473219562 | 473225618 | AVESA.00001b.r3.3Dg0002735 | Putative disease resistance protein RGA1 | |
| 473238266 | 477641586 | NA | Range for Pc/Pg gene cluster | ||
| Gene | 473393262 | 473397218 | AVESA.00001b.r3.3Dg0002742 | Rust resistance kinase Lr10 | |
| Gene | 473502193 | 473505920 | AVESA.00001b.r3.3Dg0002746 | Rust resistance kinase Lr10 | |
| RFLP | 473502613 | 473505629 | NA | Oat Ork10 sequence, best hit | |
| Gene | 473506501 | 473511096 | AVESA.00001b.r3.3Dg0002747 | Rust resistance kinase Lr10 | |
| RFLP | 473506560 | 473510799 | NA | Oat Alrk10 sequence, best hit | |
| Gene | 474501277 | 474504990 | AVESA.00001b.r3.3Dg0002750 | Receptor kinase-like protein Xa21 | |
| Gene | 476085954 | 476103958 | AVESA.00001b.r3.3Dg0002753 | Disease resistance protein RGA5 | |
| Gene | 476105843 | 476111177 | AVESA.00001b.r3.3Dg0002755 | Disease resistance protein RGA4 | |
| Gene | 476423969 | 476426000 | AVESA.00001b.r3.3Dg0002756 | 12S seed storage globulin 1 | |
| Gene | 476439479 | 476441654 | AVESA.00001b.r3.3Dg0002757 | 12S seed storage globulin 1 | |
| Gene | 477084202 | 477086230 | AVESA.00001b.r3.3Dg0002763 | 12S seed storage globulin 2 | |
| Gene | 477576863 | 477583065 | AVESA.00001b.r3.3Dg0002771 | Putative disease resistance protein RGA1 | |
| Gene | 477618553 | 477626374 | AVESA.00001b.r3.3Dg0002772 | Putative disease resistance protein RGA4 | |
| Gene | 477636514 | 477641912 | AVESA.00001b.r3.3Dg0002773 | Putative disease resistance protein RGA1 | |
| Gene | 477800977 | 477805093 | AVESA.00001b.r3.3Dg0002774 | Putative disease resistance protein RGA1 |
These loci include the oat RFLP clones Ork10 and Alrk10 (Cheng et al. 2002). More information concerning loci with feature IDs can be found at https://wheat.pw.usda.gov/jb/?data=%2Fggds%2Foat-ot3098v2-pepsico – track ‘Gene Set v3 with annotations’.
NA, not applicable.
Results
Linking individual hexaploid oat maps to the consensus map and OT3098 v2 chromosomes
To allow for a quick comparison between maps, and to aid in identifying problematic map regions, 28 of the more complete hexaploid oat maps available were matched to the 2018 consensus map of Bekele et al. (2018) and the OT3098 v2 physical map (Avena sativa – OT3098 v2, PepsiCo, https://wheat.pw.usda.gov/jb?data=/ggds/oat-ot3098v2-pepsico). Supplementary File S1 contains four tables: (1) a ‘Read me’ file, (2) the table of 2018 Mrg vs other maps, (3) a list of mapped markers and their 2018 Mrg consensus map linkage group and OT3098 v2 physical map locations, and (4) the map references.
Because aneuploids are missing all, or portions of, chromosomes, any markers physically located on those deficient chromosomes or segments will likewise be either undetectable if the deficiency is homozygous or heterozygous-polymorphic, or reduced in intensity if hemizygous (especially for a hybridisation-based marker). Nullisomic lines or monosomic-hybrid plants were available for 19 of the 21 physical chromosomes of A. sativa; therefore, essentially all linkage groups could be associated with chromosomes, with the exception of a few segments owing to heterozygosity of parents for chromosomal rearrangements and transmission of duplicate-deficient segments (Oliver et al. 2013).
The whole-genome assemblies of OT3098 v2 and Sang (Kamal et al. 2022) were used to confirm these linkage-group identities. They also allowed for precise sequence synteny comparisons with the Hordeum vulgare genome and, consequently, the confirmation of prior subgenome assignments as well as homoeologous groupings of oat chromosomes. For example, previously named oat chromosomes 7C, 17A and 14D, which early analysis with a very small number of markers suggested might constitute homoeologous group 1 (Jellen et al. 1995), were confirmed and are now numbered as chromosomes 1C, 1A and 1D, respectively (Kamal et al. 2022; Peng et al. 2022).
Locating the markers from the consensus map on the OT3098 v2 sequence
Avgbs SNP markers found on the 2018 consensus map that had perfect matches to the OT3098 v2 sequence were used to assign specific chromosomal regions to markers collocated at specific cM distances along each linkage group. Supplementary File S2 contains four items: (1) a ‘Read me’ file, (2) a table summarising the location of each Mrg linkage group region vs its location on the OT3098 v2 physical sequence, (3) the same information in GFF format, and (4) tables for each Mrg group listing all of the alignments of the Avgbs markers with the OT3098 v2 sequence.
The summary table lists each region along the Mrg groups and the ‘start’ and ‘end’ positions of the matching chromosomal region(s) in base pairs. The length of each OT3098 v2 chromosome sequence covered is also listed. Single markers will have a length of 64 bp (listed as 63 in the table); however, the length of the chromosome covered is not otherwise linked to the number of markers in the Mrg group region. Whether the assigned location is primary or alternate is also listed. The alternate locations are most often duplicates, because many Avgbs markers have perfect matches in more than one location on the OT3098 v2 sequence.
Supplementary File S3 is the genome browser track file in GFF format generated from the information in Supplementary File S2. It was used to create the genome browser track aligning the Avgbs marker regions of the 2018 consensus map to the OT3098 v2 sequence in GrainGenes (https://wheat.pw.usda.gov/jb/?data=%2Fggds%2Foat-ot3098v2-pepsico – track ‘Oat-2018-Consensus (2018 Mrg) map regions vs Oat-2018-Consensus (2018 Mrg) map regions vs. OT3098 v2’).
Visualising the 2018 consensus map regions aligned with OT3098 v2
The information in the genome browser track aligning the 2018 consensus map regions to the OT3098 v2 sequence can be visualised in other ways to look for patterns. Supplementary Files S4–S7 present the data as charts mimicking GFF-formatted tracks (rotated 90 degrees). The four views are: (1) charts for each Mrg group sorted by cM distance, (2) charts for each Mrg group sorted by chromosome location and cM distance, (3) charts for each chromosome sorted by Mrg group and cM distance, and (4) charts for each chromosome sorted by the midpoint of the range in base pairs covered by each cM region. Supplementary File S7 includes a chart for Mrg groups that represent regions on chromosome fragments with unknown locations.
The graphs in Supplementary File S7 are the smoothest, because the Mrg group regions in those graphs are organised solely by base pair location, and not their locations along the linkage groups themselves. Fig. 1 presents the example of chromosome 5C vs linkage group Mrg03. Other views are more chaotic, but can make it easier to view regions of the genetic maps that are problematic; for example, the region of Mrg03 spanning 102–105 cM does not follow the distribution pattern of the other regions, suggesting that perhaps the markers associated with it were mapped to this location in the 2018 consensus map in error (Supplementary File S4).
An example of one of the graphs found in Supplementary File S7. This one aligns 2018 consensus genetic map (Mrg) regions with chr5C of the OT3098 v2 physical map. The Mrg regions are ordered based on the location of the middle of the range for each region, meaning that many of the regions are not in the same order as they are found on the consensus map. Although chr5C is mostly represented by Mrg03, a number of regions from Mrg02 also match chr5C (stars), as do regions from various other linkage groups (dots).
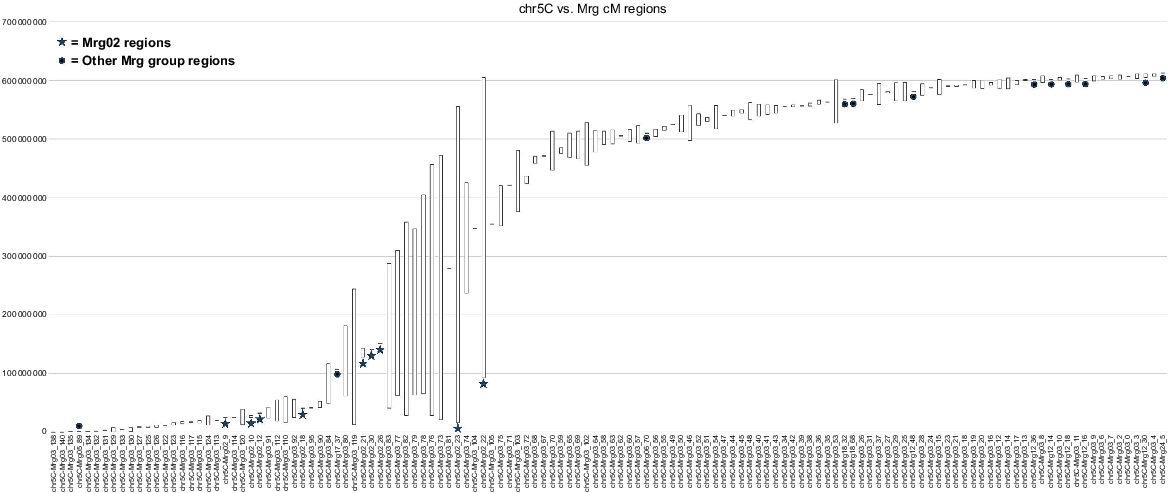
Regions that cover longer sections of the chromosomes show reduced recombination. The larger groupings of these are expected to correspond to the locations of the centromeres. 2018 Mrg group regions associated with single markers are less informative when looking to identify these areas. Note that the chromosomes represented here reflect only the sequence of OT3098 v2 and not other versions of the assembly or other genotypes, which might have different versions of any translocations/inversions/insertions or deletions, etc.
Two notable gaps can be seen on the graphs in Supplementary File S7. One is a short gap at the beginning of chr4D, the chromosome that represents Mrg21 for the most part. This gap extends from 0 to 31 691 287 bp. Looking at the OT3098 v2 genome browser, there is no lack of Avgbs markers with perfect matches to the chr4D sequence in this region, and some of them match locations on more than one linkage group. Many gene annotations have been made in this region as well, yet no Mrg21 regions are associated with this part of the chromosome. While there are various reasons why this gap could exist, a BLAST search of some of the Avgbs markers and random sections of OT3098 v2 chr4D sequence against version 1 of the OT3098 sequence shows that many of them match ‘chr00’ (or ‘chrUn’) – that is, sequences whose locations could not be determined in the OT3098 v1 assembly (data not shown).
Whereas the gap at the end of chr4D vs Mrg21 is quite small, the second gap, involving chr1A and Mrg18, is very large. Chromosomes 1A and 1C exist normally in most Mediterranean-origin red oat lines (the A. byzantina type) but in a translocated state in spring lines (A. sativa type; Jellen and Beard 2000). The consequences of this for genetic mapping were discussed by Wight et al. (2003) and Tinker et al. (2009). The implications of this translocation difference being a bottleneck to breeding were discussed by Tinker et al. (2022). Fully half of chr1A in OT3098 v2 is not represented by linkage group Mrg18 (Supplementary File S4). A few duplicated regions do have locations on the other half of chr1A, but most of the matching sequences are duplicates from chr1D, which is represented by Mrg01, and not Mrg28, which represents chr1C (Supplementary File S4).
The inventory of genes and QTLs
The main purpose of this work was to present an inventory of genes and QTLs in hexaploid oat along with their most likely locations on the 2018 consensus map and the OT3098 v2 sequence. Once the cM regions from the 2018 Mrg map linkage groups had been associated with regions on the OT3098 v2 physical chromosomes, the information could be used to associate QTLs and genes with those regions as well. Supplementary File S8 contains five tables: (1) a description of the column headings used in the QTL inventory tables, (2) information concerning the positions of all genes and QTLs sorted by chromosome number and physical distance, (3) information concerning the positions of all genes and QTLs sorted by trait name and chromosomal location, (4) a list of references cited in the other tables, and (5) the GFF-formatted track file information. Supplementary File S9 contains the GFF file itself, which was used to produce the genome browser track aligning the positions of the genes and QTLs to the OT3098 v2 sequence in GrainGenes (https://wheat.pw.usda.gov/jb/?data=%2Fggds%2Foat-ot3098v2-pepsico – track ‘QTL/gene inventory: comparative mapping vs QTL/gene inventory: comparative mapping vs. OT3098 v2’).
Information from 129 studies is included in the inventory, representing 161 populations, 214 maps, and 2367 single genes and QTLs. Of the 2367 genes and QTLs, 1688 could be associated with regions on the OT3098 v2 sequence. The chromosomes with the most genes and QTLs were chr7A and 7D, with 176 each. In large part, this is because of the heading date loci found in a number of studies, including two using the CORE (Collaborative Oat Research Enterprise) association mapping population sown in multiple locations over a number of years (Klos et al. 2016; Bekele et al. 2018).
‘Notes’ and ‘Warning’ fields were added to the QTL inventory tables to alert the user to any issues that might affect how the information should be interpreted (e.g. if information concerning the locations of markers on the 2018 Mrg map conflicted with data from other maps). Traits associated solely with the chr1A/1C translocation breakpoint are also flagged, as is the Pc38 gene, which is in a translocated position in cv. Dumont (Mrg33/chr2A) versus other lines carrying this gene (Mrg02/chr7D; Wilson and McMullen 1997a, 1997b; Wight et al. 2005).
Validating the locations of genes and QTLs
As one would expect, because of the presence of large areas of reduced recombination, the QTL and gene regions tend to cover shorter distances when they are located toward the ends of the chromosomes, and longer distances when they are located in the more central regions. However, the distances will also be longer in cases where there was more uncertainty regarding QTL and gene positions, such as when there are few markers in common between the original genetic map and any bridging maps.
Several areas of concern in the genome have been identified in other studies. As mentioned earlier, it has long been known that there is a chr1A/1C translocation difference between lines with spring versus winter habit (which includes facultative lines such as Kanota; Salmon and Parker 1921). However, other areas are also problematic. Tinker et al. (2022), who used the sequence from cv. Sang in their analyses (Kamal et al. 2022), also discuss a large inversion on chr7D differing between lines. Most of the QTLs on this chromosome relate to heading date and height. It is possible that the presence of this inversion also varies between winter and spring lines, because the corresponding linkage group in the K×O cross (K×O_17) as mapped by Wight et al. (2003) contained a large number of markers but was extremely short (98 RFLPs and other older style markers over 41 cM) – an indication of reduced recombination.
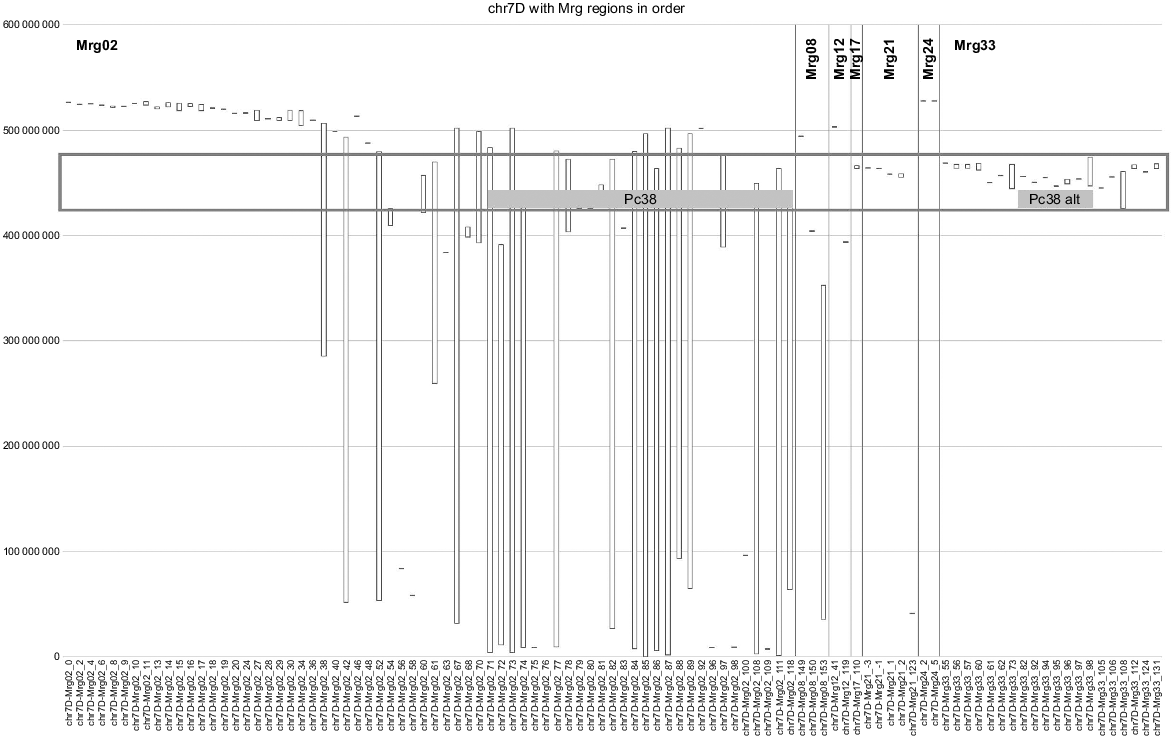
As mentioned previously, the Pc38 gene (along with the tightly linked genes Pc62 and Pc63) was found on chr7D in some crosses and chr2A in another. What is interesting is that the corresponding regions on Mrg02 (chr7D) and Mrg33 (most of which aligns with chr2A) look to be duplicated in OT3098 v2 (Fig. 2).
2018 consensus genetic map (Mrg) regions aligned with chr7D of the OT3098 v2 physical map. The Mrg regions are in the order found on the original linkage groups. Regions from seven Mrg groups match chr7D, including a large number of regions from Mrg33, which, for the most part, represents chr2A. The duplicated region defined by the red box contains the rust resistance gene Pc38 mapped to Mrg02 (K×O_17 in the original work) and the alternate location of Pc38 mapped to Mrg33 (K×O_7_10_28) in a different cross (Wight et al. 2005).
Although not necessarily having any relation to the Pc gene cluster in question, both chr7D and chr2A have genes annotated as being ‘RGA1’ in the duplicated regions (AVESA.00001b.r3.2Ag0002717 on chr2A:440876077.440882024 and AVESA.00001b.r3.7Dg0002323 on chr7D:433423695.433429668). When the sequence of the putative gene on chr2A is compared with the entire OT3098 v2 sequence using the BLAST tool available in the feature box on the genome browser track in GrainGenes, it shows 94.8% identity with the putative gene on chr7D. Similar results are found for random stretches of DNA chosen in this region as well. Therefore, regions of closely related or duplicated sequence may also complicate oat breeding efforts.
Also mentioned in the work by Tinker et al. (2022) were similar issues regarding the location of genes encoding ACCase, the key enzyme in oil biosynthesis. An ACCase gene clone mapped as an RFLP marker was associated with oil content in three populations: K×O, Kanota/Marion (K×M), and Aslak/Matilda (A×M) (Kianian et al. 1999; Tanhuanpää et al. 2010). The associated QTLs in K×O and K×M (Kianian et al. 1999) were mapped to K×O group 11 or its homologue. However, as pointed out by Tinker et al. (2022), most of the markers in the K×O_11 QTL regions belong to Mrg05/chr6A, whereas the ACCase marker belongs to Mrg11/chr4C. This suggests that there may be significant cytogenetic differences in this region of the hexaploid oat genome as well, perhaps related to winter versus spring habit. Wight et al. (2003) noted that there was an area of reduced recombination at the group 11 end of K×O_11_41 + 20 in the region of the ACCase marker. They also noted the presence of distorted segregation favouring alleles from Ogle.
In the A×M population (Tanhuanpää et al. 2010), there were two QTLs associated with the ACCase clone, one of which was located on chr4C, but with a high degree of uncertainty because of a lack of common markers with other maps. These may represent the presence of oil QTLs on both chr4C and chr6A. The sequence of the original clone used by Kianian et al. (1999) was deposited into the National Centre for Biotechnology Information (NCBI) nucleotide database (Sayers et al. 2022) as ‘Avena sativa acetyl-CoA carboxylase mRNA, partial cds AF072737.1’ (https://www.ncbi.nlm.nih.gov/nuccore/AF072737). When this sequence is compared with the OT3098 v2 sequence using the GrainGenes BLAST tool, it matches locations identified as Acetyl-CoA carboxylase 2 genes on chr4C (AVESA.00001b.r3.4Cg0000200; chr4C:15115008.15129125), chr6A (AVESA.00001b.r3.6Ag0003033; chr6A:420589269.420603312), and also chr5D (AVESA.00001b.r3.5Dg0003130; chr5D:468088859.468103812), where another oil QTL was found in the A×M population (Tanhuanpää et al. 2010). It also matches three putative ACCase genes annotated as being in those positions. Several of the oil QTLs also locate to these regions in the present work. Note that there is an ACCase gene on each of the three genomes, but the chromosomes do not represent a homoeologous set, as is the case with other genes that are contained within the numerous ancestral translocations found in oat (Kamal et al. 2022).
To confound this issue further, the Pc39/Pc55 rust resistance gene cluster is also in this region. K×O group 37 (corresponding Mrg group unknown) was the location determined for Pc39 by Wight et al. (2005), but Sowa and Paczos-Grzęda (2020) and Zhao et al. (2020) both determined it to be on Mrg11 (K×O_11_41 + 20). K×O_37 had been thought to be homoeologous to K×O_11_41 + 20 in earlier work, but this group fell apart when the 2018 Mrg map was produced. As with the ACCase clone, the clone and SCAR sequences described by Sowa and Paczos-Grzęda (2020) are found on both chr4C and chr6A, as well as chr5D (data not shown). The Pc71 rust resistance gene does not seem to be the same locus as Pc39 and Pc55, but maps further away on Mrg05/chr6A (Supplementary File S8).
Further validation of the comparative mapping approach used here
As noted above, the positions of the QTLs assigned using this particular comparative mapping approach can be validated if information is available concerning specific gene or marker sequences.
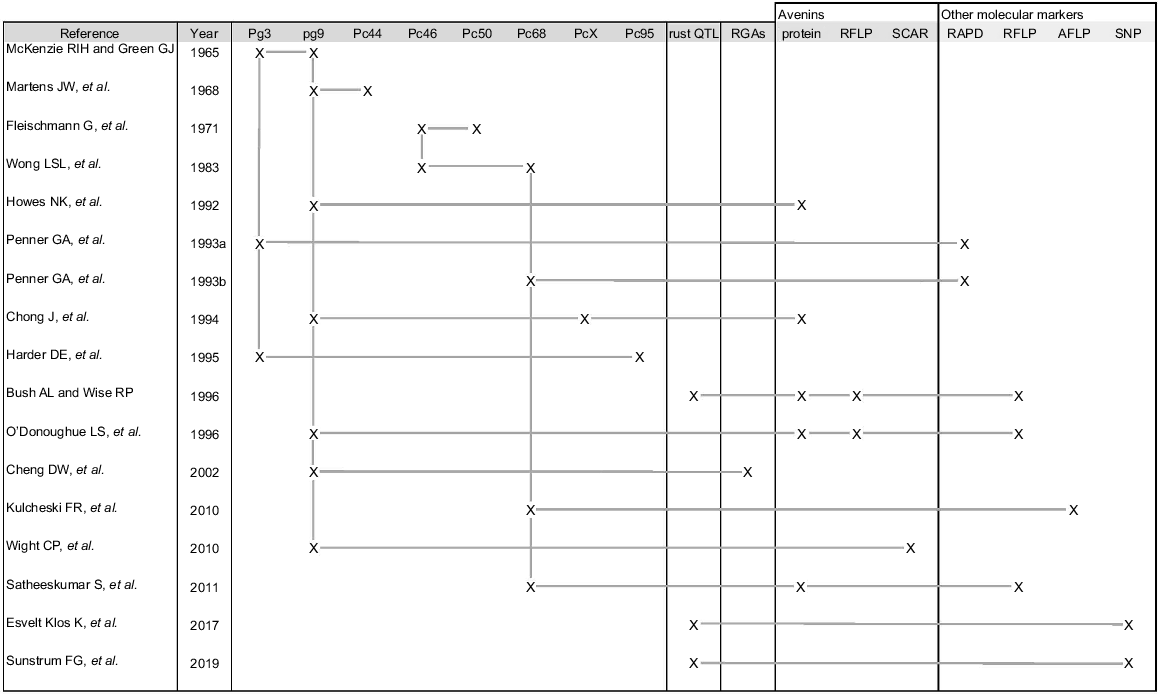
Avenins, the storage proteins in oats, are known to be linked to rust resistance genes (Howes et al. 1992; Chong et al. 1994; Bush and Wise 1996; O’Donoughue et al. 1996; Wight et al. 2010; and Satheeskumar et al. 2011), and numerous avenin gene sequences are available in the NCBI nucleotide database (Sayers et al. 2022; https://www.ncbi.nlm.nih.gov/nuccore). Therefore, this region can be used as an example of how the new inventory and associated genome browser tracks can be used to get a quick overview of which genes and QTLs are in any particular region – the one here being Mrg19/chr3D (Supplementary Files S7 and S8; https://wheat.pw.usda.gov/jb/?data=%2Fggds%2Foat-ot3098v2-pepsico&loc=chr3D%3A48258662.433018487&tracks=panoat&highlight=). The linkages identified in previous work between the rust genes, avenin proteins, and different marker types are summarised in Fig. 3.
Summary of work describing Pc and Pg genes that form a part of the rust cluster on chr3D, along with links to seed storage protein loci. RGAs, Resistance gene analogues. ‘X’ indicates that the gene or molecular marker in question was mapped in the associated study. Horizontal lines make connections between genes or markers identified as being closely or tightly linked in the associated study. Vertical lines make connections between studies performed to map the same genes or markers.
To validate the physical locations of the genes/QTLs/markers assigned in this work, a list of gene annotations from the region in question (chr3D:473238266.477641586, plus 5 Mbp either side of the middle of the region) was filtered to identify putative genes related to rust resistance and storage protein loci. Sequences from rust- and avenin-related RFLP clones mapped in the region, as well as primers defining PCR-based avenin markers, were also analysed (BLAST data not shown). Fifty-three putative disease and seed storage protein loci were found in this region, including a number of RFLP clones and SCAR sequences (data not shown). Table 1 lists loci found within 2.5 Mbp of the centre of the region. These include the oat RFLP clones Ork10 and Alrk10, which encode receptor kinase genes whose transcripts are suppressed in response to virulent rust pathogen attack (Cheng et al. 2002).
In newer studies, many single SNP markers have been associated with various traits. Blake et al. (2022) aligned the GMI SNP markers linked to B-glucan content in studies by Fogarty et al. (2020) and Zimmer et al. (2020) to OT3098 v2 chromosomes. The present work has associated the same traits to longer chromosome regions through assigning each cM location a position on the OT3098 v2 sequence, rather than through assigning the individual markers. The JBrowse tracks from the two studies can be compared directly (https://wheat.pw.usda.gov/jb/?data=%2Fggds%2Foat-ot3098v2-pepsico – tracks ‘β-glucan QTL (GrainGenes)’ and ‘QTL/gene inventory: comparative mapping vs QTL/gene inventory: comparative mapping vs. OT3098 v2’). The regions defined in this work, while much longer, always include the QTL locations determined by Blake et al. (2022). β-glucan QTLs from other studies often overlap the ones from the more recent studies but, as in the case of ACCase, not always. This is most likely because of the errors inherent In generating genetic maps, but could also mark the presence of other, valid QTLs.
Discussion
Comparative mapping in oat: where it all began
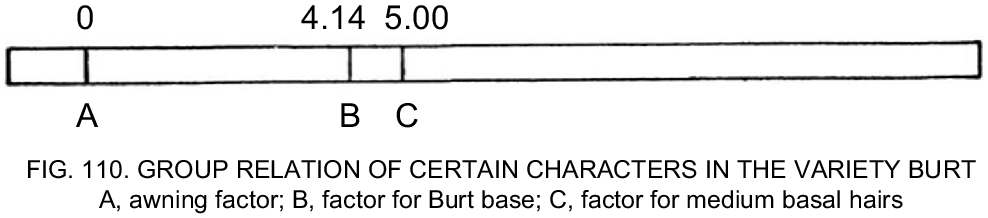
The very first drawing of a genetic linkage map in oat may be the one produced by AC Fraser, published in 1919. He mapped the relationships between awnedness, seed base type, and type of basal hairs on the seed in crosses using the cultivars Burt and Sixty Day (Fig. 4).
Copy of the original oat linkage group map from Fraser (1919). The numbers in the figure are per cent recombination.
This result was included in the QTL inventory, along with data from 128 studies undertaken between 1918 and 2022. These studies represent two different types of maps: some created through the use of classical genetics, which mapped phenotypes directly; and others created using molecular markers, including isozymes, storage proteins, and DNA-based markers such as RFLPs and SNPs.
Fraser may also have been the first to point out that, when it comes to genetic maps, ‘These percentages [recombination fractions], of course, can be accepted only as approximately correct, not as indicating the exact distances between genes on the chromosome.’ The presence of areas of reduced recombination, particularly around centromeres, as well as cytogenetic differences between lines, means that genetic maps will never completely reflect the reality of the physical chromosomes.
The tools presented here are meant to be used to simplify the identification of patterns such as those described above. However, researchers should always refer back to the original literature for more detailed information and context. Certain assumptions have been made in creating these tools, and artefacts in genetic mapping are common. They can result from cytogenetic differences between lines, the type of population being used (recombinant inbred lines (RILs) vs F2 populations vs association mapping populations), the types of markers being used, the mapping program chosen and its associated parameters, and, indeed, differing levels of skill amongst those doing the mapping. These errors may be compounded through comparative mapping. The physical map used here represents the second version of one sequenced hexaploid oat accession (OT3098 v2), and other work showing slightly different results has already been published using version 1 (e.g. Brzozowski et al. 2022). Oat being an allohexaploid introduces another layer of complexity, as does the fact that many interspecific crosses have been made over the years, including with oat lines of differing ploidy (e.g. Rines et al. 2018).
Linking individual hexaploid oat maps to the consensus map and OT3098 v2 sequence
As indicated above, caution must be used when comparing linkage groups from the different hexaploid oat maps with the 2018 Mrg map. Often, the confusion involves markers on homoeologous linkage groups, but sometimes markers on non-homoeologous groups were differently placed as well (Supplementary File S1). Note that some groups are split across two Mrg groups. Very few of the groups match all the way from one end to the other. It is very important to keep that in mind when using the table.
Locating the markers from the consensus map on the OT3098 v2 sequence and visualising the consensus map regions aligned with OT3098 v2
It was somewhat of a surprise to realise just how much of each physical chromosome showed reduced recombination in the genetic map (Supplementary Files S4–S7). It was also surprising to see just how many Mrg cM regions could be assigned to more than one location in the genome. This can be seen in Figs 1 and 2, for example. In Fig. 1, several regions whose primary locations are on chr7D (Mrg02) have secondary locations on chr5C (Mrg03). In Fig. 2, several regions whose primary locations are on chr2A (Mrg33) have secondary locations on chr7D (Mrg02). In the latter case, the regions in question are all at the end of chr7D (Supplementary File S5). In Fig. 1, the situation is similar, but less clear (Supplementary File S5).
What was less surprising, and more reassuring, was that the 2018 consensus map reflects the makeup of the physical chromosomes quite well, particularly given that the line OT3098 was not used in its construction. The oat genome is quite complex in its make-up and has numerous structural variations that affect breeding (Fig. 2; Tinker et al. 2022). The resources provided here will help to resolve those issues.
The inventory of genes and QTLs
The QTL and gene inventory tables will make information concerning the 129 included studies easier to access and compare (Supplementary Files S8 and S9; https://wheat.pw.usda.gov/jb/?data=%2Fggds%2Foat-ot3098v2-pepsico – track ‘QTL/gene inventory: comparative mapping vs QTL/gene inventory: comparative mapping vs. OT3098 v2’).
The ultimate goal would be to determine the sequences and specific locations of single genes contributing to the expression of a trait of interest. The tools presented here can help in determining the best approach to use. Some genes and QTLs have been located to smaller chromosome regions that may contain useful candidate genes. Even if the ranges along the chromosomes for many QTLs or genes can be long, the number of QTLs for any one trait in any one place will allow judgements to be made regarding the strength of the evidence to suggest that a particular trait is influenced by something in that region.
Knowing how different traits are associated (e.g. heading date is very often correlated with height) can also be useful. Many QTLs and genes are located in regions of reduced recombination, and knowing that is also helpful. In many cases, it may be that using linked markers from genetic maps to follow a trait through the breeding process will be more useful than using currently available technologies to find a candidate gene, particularly if the trait of interest is in a region of reduced recombination, or is associated with a known breeding barrier such as the chr1A/1C translocation or the chr7D inversion. Although cytogenetic differences between winter and spring lines are the most obvious and are known to be problematic, it is becoming clear that many other, smaller differences exist and may also have a large impact on breeding.
The tools described in this work are now available for public use. The curation of maps for deposition into the GrainGenes database is ongoing, and updates will be made to the QTL and gene inventory genome browser tracks as new work utilising genetic maps is published.
The ability to make use of oat genomic data for breeding purposes is finally a reality, now that high-throughput genotyping can be done routinely and many different oat lines are being sequenced and assembled. The tools presented in this work are designed to allow for more effective use of genetic maps and their associated phenotypic information, while assisting with the transition to using the new physical maps, thus linking the accumulated knowledge of the past to that of the future.
Data availability
All the process data mentioned in this article were curated into the GrainGenes database (https://wheat.pw.usda.gov) and can be specifically found as tracks at https://wheat.pw.usda.gov/jb/?data=%2Fggds%2Foat-ot3098v2-pepsico.
Acknowledgements
The assistance of Dr Catherine Howarth (Institute of Biological, Environmental and Rural Sciences, Aberystwyth University, Aberystwyth, UK) and Dr Kathy Esvelt Klos (USDA–ARS, Small Grains and Potato Germplasm Research Unit, Aberdeen, ID, USA) in setting up and supporting this project is gratefully acknowledged. USDA is an equal opportunity provider and employer.
References
Altschul SF, Gish W, Miller W, Myers EW, Lipman DJ (1990) Basic local alignment search tool. Journal of Molecular Biology 215, 403-410.
| Crossref | Google Scholar | PubMed |
Bekele WA, Wight CP, Chao S, Howarth CJ, Tinker NA (2018) Haplotype-based genotyping-by-sequencing in oat genome research. Plant Biotechnology Journal 16, 1452-1463.
| Crossref | Google Scholar | PubMed |
Blake VC, Woodhouse MR, Lazo GR, et al. (2019) GrainGenes: centralized small grain resources and digital platform for geneticists and breeders. Database 2019, baz065.
| Crossref | Google Scholar |
Blake VC, Wight CP, Yao E, Sen TZ (2022) GrainGenes: Tools and content to assist breeders improving oat quality. Foods 11, 914.
| Crossref | Google Scholar | PubMed |
Brzozowski LJ, Hu H, Campbell MT, Broeckling CD, Caffe M, Gutiérrez L, Smith KP, Sorrells ME, Gore MA, Jannink J-L (2022) Selection for seed size has uneven effects on specialized metabolite abundance in oat (Avena sativa L.). G3 Genes|Genomes|Genetics 12, jkab419.
| Crossref | Google Scholar |
Bush AL, Wise RP (1996) Crown rust resistance loci on linkage groups 4 and 13 in cultivated oat. Journal of Heredity 87, 427-432.
| Crossref | Google Scholar |
Chaffin AS, Huang YY, Smith S, Bekele WA, Babiker E, Gnanesh BN, Foresman BJ, Blanchard SG, Jay JJ, Reid RW, Wight CP, Chao S, Oliver R, Islamovic E, Kolb FL, McCartney C, Mitchell Fetch JW, Beattie AD, Bjørnstad Å, Bonman JM, Langdon T, Howarth CJ, Brouwer CR, Jellen EN, Klos KE, Poland JA, Hsieh T-F, Brown R, Jackson E, Schlueter JA, Tinker NA (2016) A consensus map in cultivated hexaploid oat reveals conserved grass synteny with substantial subgenome rearrangement. Plant Genome 9, 1-21.
| Crossref | Google Scholar |
Cheng DW, He S, Armstrong KC (2002) Modified expression of two receptor kinase genes in hexaploid oat (Avena sativa L.) on inoculation with crown rust. Physiological and Molecular Plant Pathology 61, 281-288.
| Crossref | Google Scholar |
Chong J, Howes NK, Brown PD, Harder DE (1994) Identification of the stem rust resistance gene Pg9 and its association with crown rust resistance and endosperm proteins in ‘Dumont’ oat. Genome 37, 440-447.
| Crossref | Google Scholar | PubMed |
Esvelt Klos K, Yimer BA, Babiker EM, Beattie AD, Bonman JM, Carson ML, Chong J, Harrison SA, Ibrahim AMH, Kolb FL, McCartney CA, McMullen M, Mitchell Fetch J, Mohammadi M, Murphy JP, Tinker NA (2017) Genome-wide association mapping of crown rust resistance in oat elite germplasm. Plant Genome 10, plantgenome2016.10.0107.
| Crossref | Google Scholar |
Fang Z, Polacco M, Chen S, Schroeder S, Hancock D, Sanchez H, Coe E (2003) cMap: the comparative genetic map viewer. Bioinformatics 19, 416-417.
| Crossref | Google Scholar | PubMed |
Fogarty MC, Smith SM, Sheridan JL, Hu G, Islamovic E, Reid R, Jackson EW, Maughan PJ, Ames NP, Jellen EN, Hsieh T-F (2020) Identification of mixed linkage β-glucan quantitative trait loci and evaluation of AsCslF6 homoeologs in hexaploid oat. Crop Science 60, 914-933.
| Crossref | Google Scholar |
Fox SL, Jellen EN, Kianian SF, Rines HW, Phillips RL (2001) Assignment of RFLP linkage groups to chromosomes using monosomic F1 analysis in hexaploid oat. Theoretical and Applied Genetics 102, 320-326.
| Crossref | Google Scholar |
Fraser AC (1919) The inheritance of the weak awn in certain Avena crosses and its relation to other characters of the oat grain. Cornell University Agricultural Experiment Station Memoirs 23, 635-676.
| Google Scholar |
Hacker JB, Riley R (1965) Morphological and cytological effects of chromosome deficiency in Avena sativa. Canadian Journal of Genetics and Cytology 7, 304-315.
| Crossref | Google Scholar |
Howes NK, Chong J, Brown PD (1992) Oat endosperm proteins associated with resistance to stem rust of oats. Genome 35, 120-125.
| Crossref | Google Scholar |
Jellen EN, Beard J (2000) Geographical distribution of a chromosome 7C and 17 intergenomic translocation in cultivated oat. Crop Science 40, 256-263.
| Crossref | Google Scholar |
Jellen EN, Rooney WL, Phillips RL, Rines HW (1993) Characterization of the hexaploid oat Avena byzantina cv. Kanota monosomic series using C-banding and RFLPs. Genome 36, 962-970.
| Crossref | Google Scholar | PubMed |
Jellen EN, Phillips RL, Rooney WL, Rines HW (1995) Molecular genetic identification of Avena chromosomes related to the group 1 chromosomes of the Triticeae. Genome 38, 185-189.
| Crossref | Google Scholar | PubMed |
Jellen EN, Rines HW, Fox SL, Davis DW, Phillips RL, Gill BS (1997) Characterization of ‘Sun II’ oat monosomics through C-banding and identification of eight new ‘Sun II’ monosomics. Theoretical and Applied Genetics 95, 1190-1195.
| Crossref | Google Scholar |
Jellen EN, Wight CP, Spannagl M, Blake VC, Chong J, Herrman MH, Howarth CJ, Huang Y-F, Juqing J, Katsiotis A, Langdon T, Li C, Park R, Tinker NA, Sen TZ (2024) A uniform gene and chromosome nomenclature system for oat (Avena L.). Crop & Pasture Science 75, CP23247.
| Crossref | Google Scholar |
Kamal N, Tsardakas Renhuldt N, Bentzer J, Gundlach H, Haberer G, Haberer G, Juhász A, Lux T, Bose U, Tye-Din JA, Lang D, van Gessel N, Reski R, Fu Y-B, Spégel P, Ceplitis A, Himmelbach A, Waters AJ, Bekele WA, Colgrave ML, Hansson M, Stein N, Mayer KFX, Jellen EN, Maughan PJ, Tinker NA, Mascher M, Olsson O, Spannagl M, Sirijovski N (2022) The mosaic oat genome gives insights into a uniquely healthy cereal crop. Nature 606, 113-119.
| Crossref | Google Scholar | PubMed |
Kianian SF, Egli MA, Phillips RL, Rines HW, Somers DA, Gengenbach BG, Webster FH, Livingston SM, Groh S, O’Donoughue LS, Sorrells ME, Wesenberg DM, Stuthman DD, Fulcher RG (1999) Association of a major groat oil content QTL and an acetyl-CoA carboxylase gene in oat. Theoretical and Applied Genetics 98, 884-894.
| Crossref | Google Scholar |
Klos KE, Huang Y-F, Bekele WA, Obert DE, Babiker E, Beattie AD, Bjørnstad Å, Bonman JM, Carson ML, Chao S, Gnanesh BN, Griffiths I, Harrison SA, Howarth CJ, Hu G, Ibrahim A, Islamovic E, Jackson EW, Jannink J-L, Kolb FL, McMullen MS, Mitchell Fetch J, Murphy JP, Ohm HW, Rines HW, Rossnagel BG, Schlueter JA, Sorrells ME, Wight CP, Yan W, Tinker NA (2016) Population genomics related to adaptation in elite oat germplasm. The Plant Genome 9(2), plantgenome2015.10.0103.
| Crossref | Google Scholar |
Kulcheski FR, Graichen FAS, Martinelli JA, Locatelli AB, Federizzi LC, Delatorre CA (2010) Molecular mapping of Pc68, a crown rust resistance gene in Avena sativa. Euphytica 175, 423-432.
| Crossref | Google Scholar |
Luke HH, Wheeler HE, Wallace AT (1960) Victoria-type resistance to crown rust separated from susceptibility to Helminthosporium blight in oats. Phytopathology 50, 205-209.
| Google Scholar |
Martens JW, McKenzie RIH, Fleischmann G (1968) The inheritance of resistance to stem and crown rust in Kyto oats. Canadian Journal of Genetics and Cytology 10, 808-812.
| Crossref | Google Scholar |
Maughan PJ, Lee R, Walstead R, Vickerstaff RJ, Fogarty MC, Brouwer CR, Reid RR, Jay JJ, Bekele WA, Jackson EW, Tinker NA, Langdon T, Schlueter JA, Jellen EN (2019) Genomic insights from the first chromosome-scale assemblies of oat (Avena spp.) diploid species. BMC Biology 17, 92.
| Crossref | Google Scholar | PubMed |
McKenzie RIH, Green GJ (1965) Stem rust resistance in oats. I. The inheritance of resistance to race 6AF in six varieties of oats. Canadian Journal of Genetics and Cytology 7, 268-274.
| Crossref | Google Scholar |
Morikawa T (1985) Identification of the 21 monosomic lines in Avena byzantina C. Koch cv. ‘Kanota’. Theoretical and Applied Genetics 70, 271-278.
| Crossref | Google Scholar | PubMed |
O’Donoughue LS, Wang Z, Roder M, Kneen B, Leggett AM, Sorrells ME, Tanksley SD (1992) An RFLP-based linkage map of oats based on a cross between two diploid taxa (Avena atlantica × A hirtula). Genome 35, 765-771.
| Crossref | Google Scholar |
O’Donoughue LS, Sorrells ME, Tanksley SD, Autrique E, Deynze AV, Kianian SF, Phillips RL, Wu B, Rines HW, Rayapati PJ, Lee M, Penner GA, Fedak G, Molnar SJ, Hoffman D, Salas CA (1995) A molecular linkage map of cultivated oat. Genome 38, 368-380.
| Crossref | Google Scholar | PubMed |
O’Donoughue LS, Chong J, Wight CP, Fedak G, Molnar SJ (1996) Localization of stem rust resistance genes and associated molecular markers in cultivated oat. Phytopathology 86, 719-727.
| Google Scholar |
Oliver RE, Tinker NA, Lazo GR, Chao S, Jellen EN, Carson ML, Rines HW, Obert DE, Lutz JD, Shackelford I, Korol AB, Wight CP, Gardner KM, Hattori J, Beattie AD, Bjørnstad Å, Bonman JM, Jannink J-L, Sorrells ME, Brown-Guedira GL, Mitchell Fetch JW, Harrison SA, Haworth CJ, Ibrahim A, Kolb FL, McMullen MS, Murphy JP, Ohm HW, Rossnagel BG, Yan W, Miclaus KJ, Hiller J, Maughan PJ, Redman Hulse RR, Anderson JM, Islamovic E, Jackson EW (2013) SNP discovery and chromosome anchoring provide the first physically-anchored hexaploid oat map and reveal synteny with model species. PLoS ONE 8, e58068.
| Crossref | Google Scholar | PubMed |
Peng Y, Yan H, Guo L, Deng C, Wang C, Wang Y, Kang L, Zhou P, Yu K, Dong X, Liu X, Sun Z, Peng Y, Zhao J, Deng D, Xu Y, Li Y, Jiang Q, Li Y, Wei L, Wang J, Ma J, Hao M, Li W, Kang H, Peng Z, Liu D, Jia J, Zheng Y, Ma T, Wei Y, Lu F, Ren C (2022) Reference genome assemblies reveal the origin and evolution of allohexaploid oat. Nature Genetics 54, 1248-1258.
| Crossref | Google Scholar | PubMed |
Penner GA, Chong J, Lévesque-Lemay M, Molnar SJ, Fedak G (1993a) Identification of a RAPD marker linked to the oat stem rust gene Pg3. Theoretical and Applied Genetics 85, 702-705.
| Crossref | Google Scholar | PubMed |
Penner GA, Chong J, Wight CP, Molnar SJ, Fedak G (1993b) Identification of an RAPD marker for the crown rust resistance gene Pc68 in oats. Genome 36, 818-820.
| Crossref | Google Scholar | PubMed |
Rines HW, Miller ME, Carson M, Chao S, Tiede T, Wiersma J, Kianian SF (2018) Identification, introgression, and molecular marker genetic analysis and selection of a highly effective novel oat crown rust resistance from diploid oat, Avena strigosa. Theoretical and Applied Genetics 131, 721-733.
| Crossref | Google Scholar | PubMed |
Salmon SC, Parker JH (1921) Kanota: An early oat for Kansas. Circular 91. Agricultural Experiment Station, Kansas State Agricultural College, Manhattan, KS, USA. Available at https://www.ksre.k-state.edu/historicpublications/pubs/SC091.PDF.
Satheeskumar S, Sharp PJ, Lagudah ES, McIntosh RA, Molnar SJ (2011) Genetic association of crown rust resistance gene Pc68, storage protein loci, and resistance gene analogues in oats. Genome 54, 484-497.
| Crossref | Google Scholar | PubMed |
Sayers EW, Bolton EE, Brister JR, Canese K, Chan J, Comeau DC, Connor R, Funk K, Kelly C, Kim S, Madej T, Marchler-Bauer A, Lanczycki C, Lathrop S, Lu Z, Thibaud-Nissen F, Murphy T, Phan L, Skripchenko Y, Tse T, Wang J, Williams R, Trawick BW, Pruitt KD, Sherry ST (2022) Database resources of the national center for biotechnology information. Nucleic Acids Research 50(D1), D20-D26.
| Crossref | Google Scholar | PubMed |
Siripoonwiwat W, O’Donoughue LS, Wesenberg D, Hoffman DL, Barbosa-Neto JF, Sorrells ME (1996) Chromosomal regions associated with quantitative traits in oat. Journal of Agricultural Genomics 2, Available at https://wheat.pw.usda.gov/jag/papers96/paper396/oatqtl3g.html [accessed 22 June 2023].
| Google Scholar |
Sowa S, Paczos-Grzęda E (2020) Identification of molecular markers for the Pc39 gene conferring resistance to crown rust in oat. Theoretical and Applied Genetics 133, 1081-1094.
| Crossref | Google Scholar | PubMed |
Sunstrum FG, Bekele WA, Wight CP, Yan W, Chen Y, Tinker NA (2019) A genetic linkage map in southern-by-spring oat identifies multiple quantitative trait loci for adaptation and rust resistance. Plant Breeding 138, 82-94.
| Crossref | Google Scholar |
Tanhuanpää P, Manninen O, Kiviharju E (2010) QTLs for important breeding characteristics in the doubled haploid oat progeny. Genome 53, 482-493.
| Crossref | Google Scholar | PubMed |
Tinker NA, Kilian A, Wight CP, Heller-Uszynska K, Wenzl P, Rines HW, Bjørnstad Å, Howarth CJ, Jannink JL, Anderson JM, Rossnagel BG, Stuthman DD, Sorrells ME, Jackson EW, Tuvesson S, Kolb FL, Olsson O, Federizzi LC, Carson ML, Ohm HW, Molnar SJ, Scoles GJ, Eckstein PE, Bonman JM, Ceplitis A, Langdon T (2009) New DArT markers for oat provide enhanced map coverage and global germplasm characterization. BMC Genomics 10, 39.
| Crossref | Google Scholar | PubMed |
Tinker NA, Wight CP, Bekele WA, Yan W, Jellen EN, Tsardakas Renhuldt N, Sirijovski N, Lux T, Spannagl M, Mascher M (2022) Genome analysis in Avena sativa reveals hidden breeding barriers and opportunities for oat improvement. Communications Biology 5, 474.
| Crossref | Google Scholar | PubMed |
Wight CP, Tinker NA, Kianian SF, Sorrells ME, O’Donoughue LS, Hoffman DL, Groh S, Scoles GJ, Li CD, Webster FH, Phillips RL, Rines HW, Livingston SM, Armstrong KC, Fedak G, Molnar SJ (2003) A molecular marker map in ‘Kanota’ × ‘Ogle’ hexaploid oat (Avena spp.) enhanced by additional markers and a robust framework. Genome 46, 28-47.
| Crossref | Google Scholar | PubMed |
Wight CP, O’Donoughue LS, Chong J, Tinker NA, Molnar SJ (2005) Discovery, localization, and sequence characterization of molecular markers for the crown rust resistance genes Pc38, Pc39, and Pc48 in cultivated oat (Avena sativa L.). Molecular Breeding 14, 349-361.
| Crossref | Google Scholar |
Wight CP, Yan W, Fetch JM, Deyl J, Tinker NA (2010) A set of new simple sequence repeat and Avenin DNA markers suitable for mapping and fingerprinting studies in oat (Avena spp.). Crop Science 50, 1207-1218.
| Crossref | Google Scholar |
Wilson WF, McMullen MS (1997a) Recombination between a crown rust resistance locus and an interchange breakpoint in hexaploid oat. Crop Science 37, 1694-1698.
| Crossref | Google Scholar |
Wilson WF, McMullen MS (1997b) Dosage dependent genetic suppression of oat crown rust resistance gene Pc-62. Crop Science 37, 1699-1705.
| Crossref | Google Scholar |
Wong LSL, McKenzie RIH, Harder DE, Martens JW (1983) The inheritance of resistance to Puccinia coronata and of floret characters in Avena sterilis. Canadian Journal of Genetics and Cytology 25, 329-335.
| Crossref | Google Scholar |
Yao E, Blake VC, Cooper L, Wight CP, Michel S, Cagirici HB, Lazo GR, Birkett CL, Waring DJ, Jannink J-L, Holmes I, Waters AJ, Eickholt DP, Sen TZ (2022) GrainGenes: a data-rich repository for small grains genetics and genomics. Database 2022, baac034.
| Crossref | Google Scholar |
Zhao J, Kebede AZ, Bekele WA, Menzies JG, Chong J, Mitchell Fetch JW, Tinker NA, Beattie AD, Peng YY, McCartney CA (2020) Mapping of the oat crown rust resistance gene Pc39 relative to single nucleotide polymorphism markers. Plant Disease 104, 1507-1513.
| Crossref | Google Scholar | PubMed |
Zimmer CM, McNish IG, Klos KE, Oro T, Arruda KMA, Gutkoski LC, Pacheco MT, Smith KP, Federizzi LC (2020) Genome-wide association for β-glucan content, population structure, and linkage disequilibrium in elite oat germplasm adapted to subtropical environments. Molecular Breeding 40, 103.
| Crossref | Google Scholar |