Demographic and design effects on beef sensory scores given by Korean and Australian consumers
I. H. Hwang A , R. Polkinghorne B , J. M. Lee A and J. M. Thompson C DA National Livestock Research Institute, Rural Development Administration, Suwon 441-350, Korea.
B Marrinya Agricultural Enterprises, 70 Vigilantis Road, Wuk Wuk, Vic. 3875, Australia.
C Cooperative Research Centre for Beef Genetic Technologies, School of Environmental and Rural Sciences, University of New England, NSW 2351, Australia.
D Corresponding author. Email: jthompso@une.edu.au
Australian Journal of Experimental Agriculture 48(11) 1387-1395 https://doi.org/10.1071/EA05113
Submitted: 4 April 2006 Accepted: 7 May 2007 Published: 16 October 2008
Abstract
Data from 648 beef samples, which had been sensory tested by 720 Korean and 540 Australian consumers were used to quantify design and demographic effects on beef sensory scores. The samples were from 36 carcasses, where sides had been either hung by the Achilles tendon or hip suspended. At boning, samples from three muscles (M. triceps brachii, M. longissimus dorsi and M. semimembranosus) were prepared and cooked by either grill (25-mm-thick steaks) or Korean barbeque (BBQ, 4-mm-thick samples) methods. A Latin square design was used to allocate samples to different presentation orders to be tasted in association with different samples. For both cooking techniques each consumer tested a starter sample followed by six experimental samples, with each sample being tasted by 10 different consumers.
Design (taste panel, session, order, carry-over, sample and consumer) and demographic (age class, gender, occupation, frequency of eating meat, number of adults and children living in the house, their appreciation of meat and degree of doneness and income) effects were examined separately for tenderness, juiciness, like flavour, overall liking and a composite palatability score, within the four consumer group/cooking method subclasses. For grill samples, order of presentation was significant for most sensory variables. For BBQ samples, order of presentation failed to achieve significance for Australian consumers, but was significant (P < 0.05) for Korean consumers. Carry-over effects tended to be more important for juiciness and like flavour scores than other sensory scores. Demographic effects were generally not significant (P > 0.05) for all consumer group/cooking methods. Correlations between raw scores and those adjusted for design and demographic effects ranged from 0.93 to 0.99, indicating that if the design was balanced, or nearly balanced for design effects, then further adjustment of sensory scores was not necessary. Clipping 40% of outlying consumer scores reduced the variance of the sample mean by ~30%.
Introduction
The development of the Meat Standards Australia (MSA) grading scheme has been underpinned by sensory evaluation of meat samples using untrained consumers (Polkinghorne et al. 1999; Thompson 2002; Polkinghorne et al. 2008). The decision to use untrained consumer panels was based on the premise that relative to trained panels, consumer panel responses are not biased by the training procedures and are, therefore, more likely to reflect community attitudes. However, using untrained consumers has several disadvantages as consumer assessments have a higher variance, and assembling a large number of small consumer groups has the potential to create demographically selective groups that may not be representative of the total population. If demographic effects were important, this could potentially bias the sensory results. Previous work by Neely et al. (1999) has shown between city differences in consumer overall liking scores for in-home evaluations of beef conducted in four cities in the United States.
Ball (1997) discussed the difficulties in obtaining unbiased and accurate scores from sensory studies. There are constraints in the number of samples that can be tested by each panellist and the scores given by individual panellists may also be influenced by the samples that have been tasted previously (carry-over effect) and/or by the number of samples previously tasted (order of presentation effect). To minimise the influence of these effects, several workers (MacFie et al. 1989; Schlich 1993; Ball 1997; Ferris et al. 2003) have suggested the use of Latin square designs, where the samples from any treatment are allocated to different positional orders in association with different samples. The authors are not aware of studies that have examined the importance of these factors in consumer groups from diverse cultural backgrounds. If the MSA testing protocol is to be extended internationally, there is a need to quantify the importance of any systematic biases in the design and testing protocol.
This paper examined the importance of design and demographic effects on sensory scores for samples prepared by both grill and Korean barbeque (BBQ) methods and tasted by Korean and Australian consumers. Whereas Thompson et al. (2005) concluded that demographics were not important for grilled sheep meat samples tasted by Australian consumers, the present study provided the opportunity to examine these effects for beef, using consumer groups from widely differing cultures. In the present study, the Korean consumers would have more familiarity with Korean BBQ cooking methods, whereas the reverse would be true for Australian consumers. In addition, the Korean culture is rapidly undergoing change, with the younger generation being exposed to many elements of western culture, compared with older age groups that hold more traditional values. There was interest to determine whether age effects were important within the Korean consumer group.
Materials and methods
Experimental design, preparation and cooking of sensory samples
The experimental design has been described in detail by Thompson et al. (2008). Briefly, the design comprised sensory testing of beef samples from carcasses of 18 cattle slaughtered in Korea and 18 cattle slaughtered in Australia. One side of each carcass was hung by the Achilles tendon and the other hip suspended. At boning, the blade, striploin and topside primals were removed and stored in vacuum packs. After 7 days the M. triceps brachii, M. longissimus dorsi and M. semimembranosus were dissected from both sides and these muscles were each used to prepare five 25-mm-thick steaks for grilling, and 10 × 10 × 75-mm strips for Korean BBQ.
The 18 Australian and 18 Korean carcasses × 2 carcass suspension treatments × 3 muscles × 2 cooking techniques provided 216 samples for sensory testing by Australian consumers (the Australian consumers tested only Australian samples) and 432 samples for sensory testing by Korean consumers (the Korean consumers tested both Australian and Korean samples).
Sensory design
The sensory design has been described in detail by Thompson et al. (2008). Briefly, samples from animal, muscle, carcass suspension combinations were used to prepare five steaks and 10 BBQ strips that were allocated to consumer and tasting position using a Latin square design. These samples were cooked by grill and Korean BBQ methods in accordance with MSA protocols to serve to untrained consumers [a brief summary is given in the Accessory Publication to Watson et al. 2008 (available online)].
The grill panels comprised 108 samples allocated across nine sessions, where a total of six experimental samples were fed to each of the 180 consumers. Each of the five steaks prepared from each sample was served in a different session (a session was a group of 20 consumers). The BBQ panels were a modification of the above design, where each taste panel comprised 36 samples allocated across five groups of 12 consumers. For each of the BBQ panels, a total of six experimental samples were fed to 60 consumers. BBQ strips from each sample were served in each of the five groups of 12 consumers. In both the grill and BBQ panels a common starter sample was served to each consumer before the six experimental samples.
For the two grill taste panels (each of 108 samples) conducted in Korea, each consumer received three Australian and three Korean samples. In Australia, the 108 grill samples were tested in two taste panels, where each consumer received three samples from the present experiment and three samples from other ongoing experiments. For the six BBQ taste panels conducted in Korea, each consumer received three Korean and three Australian samples. For the Australian BBQ taste panels, 108 samples were tested in three taste panels, each comprising 60 consumers and 36 samples from the present experiment.
Consumer recruitment
In Australia, community organisations and clubs were used to recruit panellists. An initial screening requested panellists who were aged between 20 and 50 years, ate meat at least once every 2 weeks and preferred their meat cooked to medium doneness. A donation was made to the organisations for delivery of the required number of consumers to the taste panel venue at the assigned times. In Korea, consumers were recruited from several government organisations and universities, which were in close proximity to Suwon. Korean consumers received a small gift for their participation.
Consumer demographics
At the start of each taste panel, all consumers filled in a questionnaire on their demographic details. The questions asked were:
-
age class, based on four categories: (a) 20–25, (b) 26–30, (c) 31–40, or (d) 41–50 years;
-
gender, based on two categories: male or female;
-
occupation, based on nine categories: (a) tradesperson, (b) professional, (c) administration, (d) technical, (e) sales, (f) labourer, (g) homemaker, (h) not currently in employment, or (i) student;
-
frequency of eating meat, based on seven categories: (a) daily, (b) 4–5 times per week, (c) 2–3 times per week, (d) weekly, (e) fortnightly, (f) monthly, or (g) never;
-
number of adults living in the house, based on eight categories: 1, 2, 3, 4, 5, 6, 7, or >7;
-
number of children living in the house, based on nine categories: 0, 1, 2, 3, 4, 5, 6, 7, or >7;
-
their appreciation of meat, based on the following statements as to how much they enjoy or do not enjoy eating meat:
-
– I enjoy red meat. It is an important part of my diet
-
– I like red meat well enough. It is a regular part of my diet
-
– I do eat some red meat, although truthfully it would not worry me if I did not eat red meat
-
– I rarely/never eat red meat
-
their preferred degree of doneness, based on six categories: (a) blue, (b) rare, (c) medium/rare, (d) medium, (e) medium/well done, or (f) well done; and
-
income, based on three categories: <A$20 000, A$20 000–50 000, >A$50 000 per annum. When converted to Korean Won, these categories were still appropriate to separate income levels into low, medium and high categories.
The scoring procedure was described by Watson et al. (2008). Briefly, each sample was tasted by 10 different consumers who scored it for tenderness, juiciness, like flavour and overall liking, by placing a mark on a 100-mm line.
Statistical analysis
A composite palatability score (MQ4) was created by summing the four sensory scores after weighting tenderness, juiciness, like flavour and overall liking scores by 0.4, 0.1, 0.2 and 0.3, respectively (Watson et al. 2008). The following analyses were undertaken on the sensory responses and the MQ4 score from the six experimental samples assessed by each consumer. Consumer responses for the starter samples were not used in the present analyses as they were intended to familiarise the consumers with the tasting protocol.
For grill samples, a mixed model (PROC MIXED, SAS 1997) was used to examine the effect of design (taste panel, session nested within taste panel, order, carry-over effects and sample nested within taste panel) and demographic effects (age, gender, occupation, frequency of eating meat, number of adults and number of children in the household, a statement as to their appreciation of red meat, their preferred degree of doneness and their income bracket) on each of the four sensory scores and the MQ4 score. The model included a random term for taster nested within taste panel and session. The order effect was sample presentation from position 2 to 7. The carry-over effect was the sensory score for the previous sample tested by the consumer. As the first sample was a starter sample, it was possible to calculate a carry-over effect for all six experimental samples. A similar analysis was used for BBQ samples, except the models did not contain session nested within taste panel and the random term tested only taster nested within taste panel. Data for each sensory trait and the MQ4 score were analysed as four separate analyses within the consumer group and the cooking method.
These datasets also provided an opportunity to examine the effectiveness of clipping on the variance of the mean sensory score. As described by Watson et al. (2008), MSA data is routinely clipped for outliers by ranking the 10 individual sensory scores for each sample and removing the two highest and lowest scores before calculating the sample mean. Variances of clipped and unclipped sample means were compared for the four consumer group/cooking method subclasses.
Results and discussion
Experimental design effects on sensory scores
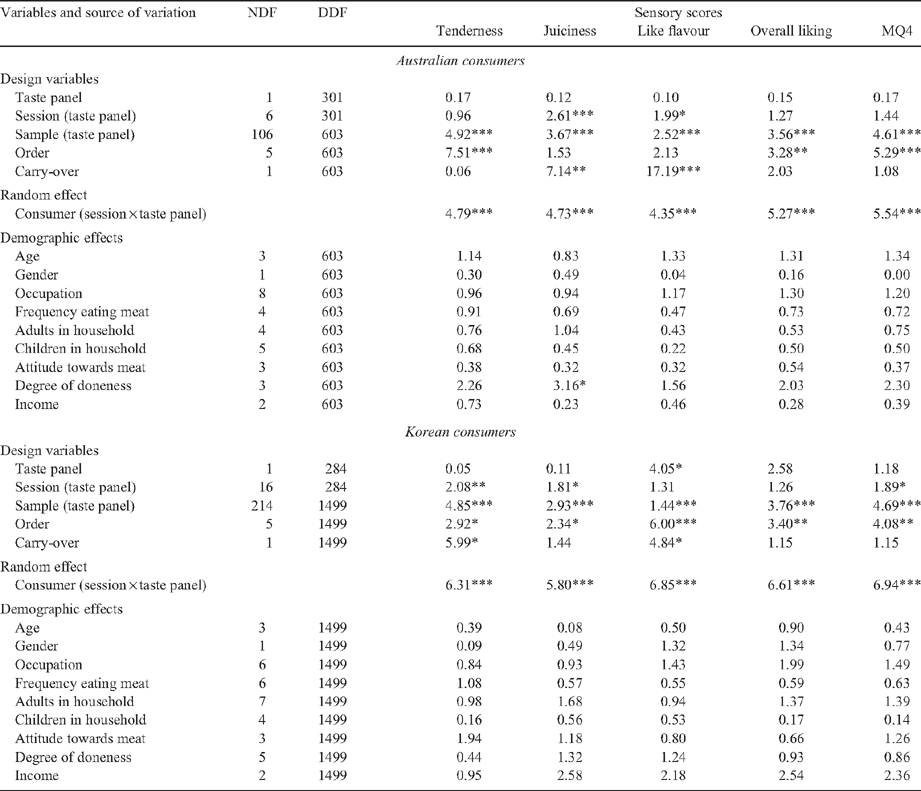
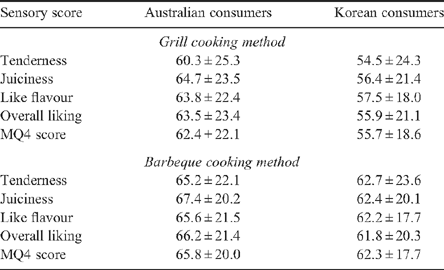
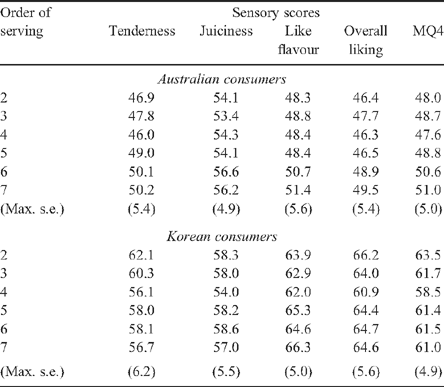
Mean sensory scores for Australian and Korean consumers are shown in Table 1. Tables 2 and 3 show the significance of design effects on sensory scores for Australian and Korean consumers for grill and BBQ samples, respectively. Without exception, the random term for consumer was highly significant (P < 0.001) for the four sensory and the MQ4 scores from the four consumer group/cooking method subclasses. This confirmed the highly variable nature of individual consumer scores. However, despite the large variation associated with the consumer term, sample effects were highly significant (P < 0.001) for all sensory scores from the four consumer group/cooking method subclasses (see Tables 2 and 3). This result concurred with those of Thompson et al. (2005), who concluded that the design used in the MSA consumer panels, whereby 10 consumers tasted every sample, was sufficient to produce highly significant sample differences, despite the highly variable nature of sensory scores from untrained consumers.
|
For Australian and Korean consumers testing grill steaks, the taste panel effect was generally not significant (P > 0.05; Table 2). Similarly, for BBQ samples tested by Korean consumers the taste panel effect was also not important, although it was significant (P < 0.05) when tested with Australian consumers (Table 3). This latter effect, whereby one taste panel had sensory scores that were ~8 taste panel units higher than the other two taste panels is difficult to explain, but could have been due to one or a combination of sample and/or consumer effects.
Session effects within the taste panel for the grill samples achieved significance for about half the sensory scores (Table 2). When averaged across all sensory scores, the predicted means for session effects for the grilled samples had a variance of 4.5 and 3.5 sensory units for Australian and Korean consumers, respectively. It was not obvious as to the cause of the slightly larger variance for the session with Australian consumers. Thompson et al. (2005) estimated a similar variance for session effects of sheep meat samples, which had been tested using a similar sensory protocol.
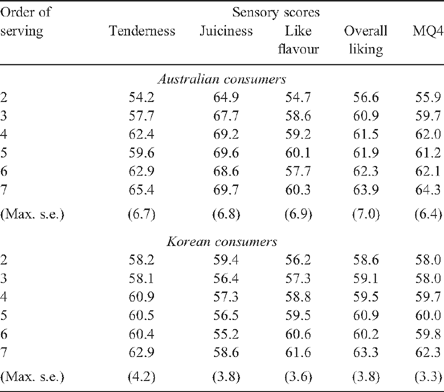
The significance of order of presentation effects for grill and BBQ cooking techniques are shown in Tables 3 and 4, respectively. The importance of order of presentation effects across the four consumer group/cooking method subclasses was variable. For grilled samples there was a trend for an increase in sensory scores as order of presentation increased (P < 0.05; Table 4). Exceptions were juiciness and like flavour scores for Australian consumers, where the trend was not significant (P > 0.05), and juiciness score for Korean consumers, where the effect of presentation order was negative (Table 4). The magnitude of the order effects were often as high as 5–10 sensory units over the tasting of six experimental samples (Table 4).
|
The significance and magnitude of the order effect for the BBQ cooking method contrasted with that found for grilled samples. For BBQ samples, order effects were either not significant (as for grilled samples for the Australian consumers), or did not show a linear change (as for grilled samples for Korean consumers, see Table 5). Few reports are available on order effects in meat tasting panels. In an analysis of cheese tasting data, Muir and Hunter (1991–1992) found that order of presentation effects were most evident between the first and subsequent samples. In the present study, the purpose of the starter sample was in part to take account of this effect in allowing the untrained consumers to become familiar with the tasting procedure. Rousset et al. (1993) reported that analysis of presentation order effects in meat tasting data showed that the last sample achieved the highest rating. For grill samples in the present study, there was a general trend for sensory score to increase linearly over the six experimental samples. This trend with grilled steaks contrasted to the order effect for BBQ samples, whereas with Australian consumers, the magnitude of the increase was about half that observed with grill samples and it failed to achieve significance. This suggested that for Australian consumers, part of the increased appreciation due to the order effect was associated with the cooking technique, or the presentation of larger samples with the grill protocol. For Korean consumers presented with BBQ samples, the order effect did not show a linear trend, but rather one where the 4th sample showed a large decline in sensory score. It is difficult to suggest a reason for this, albeit to say that the magnitude of the order effect for Korean consumers presented with BBQ samples was much less than the grill samples.
|
Carry-over effects were evident for some sensory scores for Australian and Korean consumers presented with grill or BBQ samples (Tables 2 and 3). Carry-over effects were associated with juiciness and like flavour scores, with the exception of the tenderness score for Korean consumers presented with grill samples. For the juiciness and like flavour scores, the coefficients of the carry-over effects were of the order of 0.02–0.12 sensory units (i.e. the higher the sensory score for the previous sample, the higher the score given to the current sample). As the carry-over effect was largely associated with the like flavour and juiciness attributes there was a suggestion that there was a ‘mouth feel’ or ‘taste’ component that was carried over to the next sample. Carry-over effects have often been shown to be important, particularly when only a few attributes were being assessed on each sample, and/or the time interval between tastings was small (Ferris et al. 2003). As in the present study, Ferris et al. (2003) also reported that carry-over effects were associated with flavour traits.
Demographic distribution
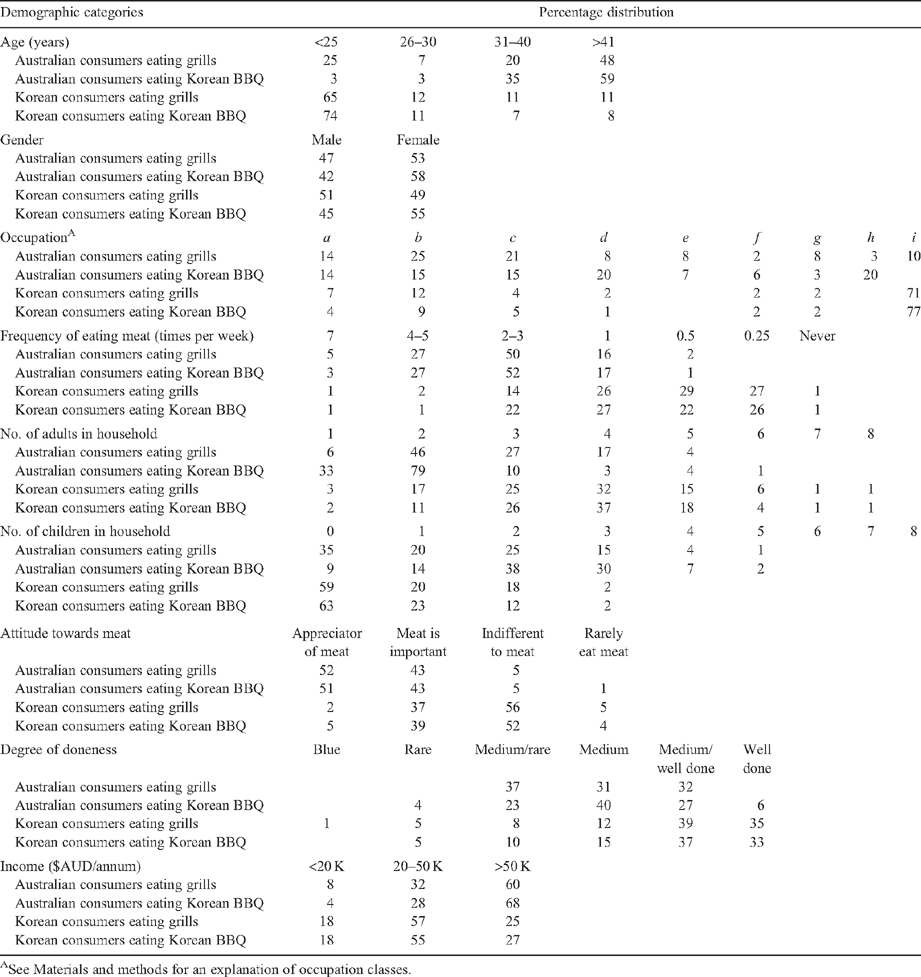
Table 6 shows the percentage distribution of demographic data for Australian and Korean consumers eating grilled or BBQ samples. Within each country, the consumer groups sampled for the grill and BBQ panels were similar. Most of the differences between consumer/cooking method groups were between the Australian and Korean consumer groups.
There was a different age distribution for Australian and Korean consumers. The distribution of Australian consumers, who were sampled from clubs and community groups, was skewed towards the older age categories. Because over 70% of Korean consumers were sampled from universities, this skewed the distribution towards the younger age categories. Australian consumers tended to be more evenly distributed between the various occupation categories. The sex effect was evenly distributed between male and female for the four consumer group/cooking method subclasses. The pattern of eating meat was very different between the two consumer groups. The mode for Australian consumers was for meat to be consumed 2–3 times a week, compared with the Korean consumers where the mode for frequency of eating meat was between once a week and once a month.
There was a large difference in the living arrangements of the two consumer groups, with the majority of Australian consumers living in households with one, two or three adults, whereas most Korean consumers tended to live in households with three or four adults. A large proportion of Australian consumers participating in the grill panels came from households with no children, yet the consumers for the BBQ samples were largely from households with three or four children. The Korean demographics for living arrangements reflect the high proportion of students in the sample.
Consistent with the low frequency of consuming meat, over 50% of Korean consumers scored themselves as rather indifferent to the importance of meat in their diet, compared with the Australian consumers who ate meat more frequently and considered meat was an important part of their diet.
The preferred degree of doneness also showed a large difference between consumer groups, with Australians quoting medium/rare or medium as their preferred score, whereas 70% of Korean consumers preferred medium/well done, or well done meat. The Australian consumers recruited for both grill and BBQ panels tended to be skewed to the higher income bracket, although the Korean consumers tended to be sampled from the middle income bracket.
Demographic effects on sensory scores
The demographic analyses were notable for the lack of any major significant effects on sensory scores. Exceptions were an effect of doneness on juiciness score (P < 0.05; Table 2) for grill samples tasted by Australian consumers, an age effect (P < 0.05; Table 2) on tenderness and MQ4 scores for BBQ samples tasted by Australian consumers and finally an age effect on like flavour score (P < 0.05; Table 3) for BBQ samples tasted by Korean consumers. Predicted means for the doneness effect on juiciness score showed those consumers who preferred rare meat gave lower juiciness scores. However, it is difficult to have confidence in this result as Table 6 showed that those consumers who scored themselves as preferring rare meat comprised less than 1% of the sampled consumers. Similarly, the consumer age effect on tenderness and MQ4 scores for BBQ samples tested by Australian consumers was largely due to lower sensory scores given by the 26–30-year category, which comprised less than 3% of the sampled consumers, whereas the age effect on like flavour scores for Korean consumers, was due to lower like flavour scores from a category with less than 7% of the population. Given these skewed population samples, it was difficult to have confidence in these means and they were not tabulated in this paper.
While the distribution of the demographic traits was skewed for several traits, the results suggest that overall demographic effects were not an important source of bias for sensory scores. A similar analysis was undertaken by Thompson et al. (2005) based on over 4000 Australian consumers who had participated in lamb sensory panels. Their results only showed a small number of significant demographic effects and they also concluded that demographic effects were a relatively unimportant source of bias for sensory scores and suggested that the need to balance the demographics of consumers to participate in a well designed taste panel was not particularly important.
Given the rapid changes occurring in Korean culture, it was reassuring that demographic effects had little effect on sensory scores. As discussed, there was only one significant result out of nine effects examined, and this was associated with a skewed distribution of consumers. Korean consumers are currently undergoing varying degrees of ‘westernisation’ and this obviously impacts on their choice of foods. However, our results indicated that the demographic effects investigated in the present study had little impact on their consumer sensory scores, and in this regard they were similar to Australian consumers.
Adjustment for design and demographic effects on sensory scores
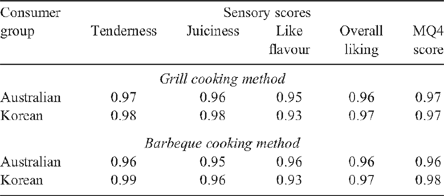
Table 7 shows the correlations between sensory scores that were adjusted using the models in Tables 2 and 4 and the raw mean of the 10 tastings. Correlations were all close to unity indicating that the adjusted and unadjusted scores were essentially the same trait. In practice, such adjustments are rarely made by researchers in analyses of consumer sensory data. These results confirm that while order and carry-over effects can be significant, if the design was constructed so that it was balanced, or nearly balanced, for order and there was a similar range in palatability of samples being tested, then statistical adjustment appeared unnecessary. This was similar to the conclusion of Ball (1997).
|
Effect of clipping on outliers within sensory scores
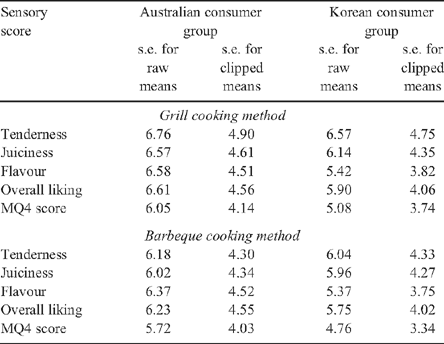
While consumer sensory scores have an advantage over trained taste panels or objective measurements of meat quality in that they are a direct measurement of the consumer preferences, they have the disadvantage of high variance. In practice, this is generally catered for by using a large number of consumers and averaging the individual scores. Watson et al. (2008) described a procedure of clipping the two highest and lowest consumer scores to reduce the variance of the sample scores. In the present study, clipping reduced the s.e.m. by ~30%, across all the different consumer group/cooking method subclasses (Table 8). There was also a trend for the s.e. of both the unclipped and clipped means to be slightly lower for the Korean compared with Australian consumers. This suggested that within a sample, the Australian consumers used more of the sensory scale than did Korean consumers. As this trend was evident in both the clipped and unclipped data, it was not simply due to a greater presence of outliers in the Australian consumers.
|
Conclusion
This study showed that the design of the sensory protocol used by MSA whereby 10 consumers taste every sample was sufficient to obtain highly significant sample differences, despite the large variance in consumer sensory scores. Order effects were larger for the grill than BBQ samples, which suggested that this effect was associated with either the cooking method, or the presentation of larger meat samples. Carry-over effects appear to be more important for like flavour and juiciness scores. Despite the significance of these effects, the high correlation between adjusted and unadjusted scores suggested that if the design was balanced then statistical adjustment for these effects was not necessary. Clipping the highest and lowest 20% consumer scores before calculating sample means provides an additional technique to reduce the variance of the sample mean.
Generally, within consumer group and cooking protocol demographic effects had little effect on sensory scores. This inferred that consumers from diverse demographic backgrounds had similar sensory responses towards beef quality and, therefore, the need to balance consumer demographics as part of the experimental design of consumer taste panels was not particularly important.
Acknowledgements
This study was funded as a joint project between Meat and Livestock Australia and the National Livestock Research Institute (NLRI), Rural Development Administration in Korea. Thanks are due to MSA staff who supervised the slaughter and grading of carcasses and to Cosign Pty Ltd, Sensory Solution Pty Ltd and the NLRI staff for organising consumers and conducting the sensory evaluations.
Ball RD
(1997) Incomplete block designs for the minimisation of order and carry-over effects in sensory analysis. Food Quality and Preference 8, 111–118.
| Crossref | GoogleScholarGoogle Scholar |

Ferris SJ,
Kempton RA, Muir DD
(2003) Carryover in sensory trials. Food Quality and Preference 14, 299–304.
| Crossref | GoogleScholarGoogle Scholar |

MacFie HJH,
Bratchell N,
Greenhoff K, Vallis LV
(1989) Designs to balance the effects of order of presentation and first order carry-over effects in hall tests. Journal of Sensory Studies 4, 129–148.
| Crossref | GoogleScholarGoogle Scholar |

Muir DD, Hunter EA
(1991–1992) Sensory evaluation of cheddar cheese: order of tasting and carryover effects. Food Quality and Preference 3, 141–145.
| Crossref | GoogleScholarGoogle Scholar |

Neely TR,
Lorensen CL,
Millar RK,
Tatum JD,
Wise JW,
Taylor JF,
Buyck MJ,
Reagan JO, Savell JW
(1999) Beef tenderness satisfaction, cooking method and degree of doneness effects on top round steaks. Journal of Animal Science 77, 653–660.
|
CAS |
PubMed |

Polkinghorne R,
Thompson JM,
Watson R,
Gee A, Rooke M
(2008) Evolution of the Meat Standards Australia (MSA) beef grading system. Australian Journal of Experimental Agriculture 48, 1351–1359.

Rousset S,
Schlich P,
Martin JF,
Cadic AL, Touraille C
(1993) Influence of product, consumer group and presentation order on the hedonic assessment of steaks. Food Quality and Preference 4, 96.
| Crossref | GoogleScholarGoogle Scholar |

Schlich P
(1993) Uses of change-over designs and repeated measurements in sensory and consumer studies. Food Quality and Preference 4, 223–235.
| Crossref | GoogleScholarGoogle Scholar |

Thompson J
(2002) Managing meat tenderness. Meat Science 62, 295–308.
| Crossref | GoogleScholarGoogle Scholar |

Thompson JM,
Pleasants AB, Pethick DW
(2005) The effect of demographic factors on consumer sensory scores. Australian Journal of Experimental Agriculture 45, 477–482.
| Crossref | GoogleScholarGoogle Scholar |

Thompson JM,
Polkinghorne R,
Hwang IH,
Gee AM,
Cho SH,
Park BY, Lee JM
(2008) Beef quality grades as determined by Korean and Australian consumers. Australian Journal of Experimental Agriculture 48, 1380–1386.

Watson R,
Gee A,
Polkinghorne R, Porter M
(2008) Consumer assessment of eating quality – development of protocols for Meat Standards Australia (MSA) testing. Australian Journal of Experimental Agriculture 48, 1360–1367.


