

Meta-analysis of the published effects of HGP use on beef palatability in steers as measured by objective and sensory testing
Ray WatsonDepartment of Mathematics and Statistics, University of Melbourne, Parkville, Vic. 3010, Australia. Email: rayw@ms.unimelb.edu.au
Australian Journal of Experimental Agriculture 48(11) 1425-1433 https://doi.org/10.1071/EA07174
Submitted: 12 June 2007 Accepted: 20 June 2008 Published: 16 October 2008
Abstract
Evidence is presented that suggests strongly that hormone growth promotant (HGP) implantation has a negative effect on beef palatability. This is based on a meta-analysis of results reported in refereed papers that have appeared in the meat-science literature. To be included in this analysis, a paper must have reported results for control samples (no HGP) and treatment samples (HGP) for either objective testing (Warner-Bratzler shear-force) or consumer preference (tenderness score). The paper must also have reported estimates and standard errors. Further, we consider only the case of steers, and the M. longissimus dorsi (striploin). While most of these studies yielded non-significant differences, most gave an estimate indicating that the HGP treatment had a negative effect on beef palatability. When these results are combined using a meta-analysis, they provide significant evidence that the use of HGP implants negatively influences palatability.
Additional keywords: beef palatability, meta-analysis, tenderness score, Warner-Bratzler shear-force.
Introduction
A fundamental component of both scientific research and policy decision making is the review of existing information on the methodology or intervention of interest. This information is commonly quantitative in nature and arises from a variety of sources. Inherent in this information is some variability both in the information itself and in the perceived reliability of the information supplied from each source. Questions arise therefore as to how this information is to be utilised to best aid decision making or further research on the intervention of interest. This quantitative approach, combining the results from each information source, together with the collection and selection of information has come to be widely known as meta-analysis: ‘the analysis of analyses’ (Glass 1976, p. 4). A meta-analysis can take many forms, corresponding to the field of research in which it is applied. These fields are many, including environmental sciences (Hilborn and Lierman 1998; Gurevitch and Hedges 1999), management (Forza and Dinuzzo 1998; Phillips 1998), education and the behavioural sciences (Dunn et al. 1995; Quinn et al. 1999) and medical research (Halpem et al. 1998; Bent et al. 1999). It can also be applied in meat science. The appeal of meta-analysis is that it presents a scientific, objective means of reviewing and analysing existing quantitative information. It is presented as ‘a rigorous alternative to the casual, narrative discussions of research studies’ (Glass 1976).
The intention of this paper is to assemble a complete summary of the published effects of HGP use on beef palatability as measured by tenderness scores and by Warner-Bratzler shear-force measurements for M. longissimus dorsi in steers.
The studies considered in this meta-analysis are papers that have appeared in refereed journals for which estimates and standard errors are available, including the recent Australian studies (Hunter et al. 2001; Thompson et al. 2008a, 2008b; Watson et al. 2008b; McIntyre et al. unpubl. data) summarised in the Results section. This resulted in 20 studies, with 30 treatment–control comparisons for the tenderness evaluations; and 16 studies, with 22 treatment–control comparisons for the shear-force measurements.
About 70% of these treatment–control comparisons yielded non-significant differences, but more than 90% gave an estimate indicating that the HGP treatment had a negative effect on beef palatability. When these results are combined using a meta-analysis, they provide significant evidence that the use of HGP implants negatively influences palatability. It is found that the estimate of the HGP effect is to increase shear-force by 0.27 kg, with standard error 0.03; and to reduce tenderness by 5.4 points on a 100-point scale, with standard error 0.8.
Publication bias may exist where there is a tendency for papers with significant results to be published. In most papers considered in this meta-analysis, palatability was a subsidiary result to the other reported results, usually the effect of HGP on animal growth. So the significance or otherwise of the palatability result was not important to the paper’s publication. As a consequence publication bias is unlikely to occur in this case. Indeed, in most cases, the HGP effect on palatability was found to be non-significant.
Materials and methods
A meta-analysis was conducted of results reported in refereed papers that have appeared in the meat-science literature. Such papers were found using searches on (beef or steer) and (palatability or shear-force or tenderness) and (HGP or hormone/hormonal or implants or shear-force). To be included in this meta-analysis, a paper must have appeared in a refereed English-language journal and it must have reported estimates and standard errors for either objective testing (Warner-Bratzler shear-force) or consumer preference (tenderness score). A paper may contain more than one treatment–control comparison. To be included in the meta-analysis, such a comparison must have a specific control sample (no HGP) and a treatment sample or samples (HGP).
To avoid possible sex effects and muscle differences, attention was restricted to papers reporting on steers, and the M. longissimus dorsi (striploin). This choice ensured a wide range of results, as most trials for which a comparison has been made between control (no implant) and treated (with HGP implant) include steers, striploins, and shear-force or tenderness scores. This resulted in 20 eligible papers for the tenderness evaluations; and 16 for the shear-force measurements.
In order to make the results of the objective tests and the sensory tests comparable, a ‘toughness’ measure is used in each case: in the objective case the shear-force, and in the sensory case a negative perceived tenderness. In each case then the HGP effect is the mean increase in toughness when HGP is used, as compared with a control where HGP is not used.
Sensory scores are reported on varying scales. To ensure that all sensory scores are comparable, they are converted to a scale from 0 to 100. If x denotes the tenderness score on the scale from a to b, then the following definition is used:

In performing the meta-analysis, it is assumed that all HGP treatments have the same palatability effect: i.e. that each is sampled from a random effect distribution with a common mean. This assumption is not contradicted by the published results. Further, in cases where a number of HGP treatments have been compared against a common control, the HGP effect estimates are not independent as each has a common control. In such cases, the HGP treatments are pooled before comparison with the control.
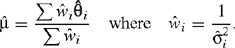
In combining independent estimates, the optimal linear combination of estimates was used, i.e. with weights inversely proportional to the square of the standard error. Given independent estimates, esti with standard error s.e.i (i = 1, 2,…,k), the combined estimate is given by
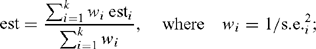
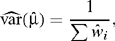
and for this estimate the standard error is such that
The number of HGP effect estimates reported here is determined by the number of independent control groups. The relevant estimates, standard errors and confidence intervals were extracted, combining results as necessary. These results were included in the meta-analysis of published results given below.
Results and discussion
Recent Australian studies
CRC trial: Hunter et al. (2001), Thompson et al. (2008b)
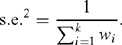
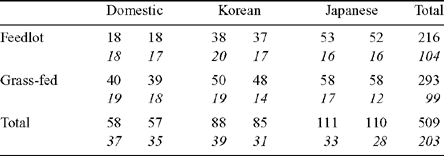
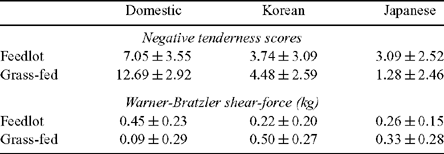
This trial has been reported in Hunter et al. (2001) where a preliminary report of the sensory results from 203 animals was given. Thompson et al. (2008b) presented further results from the same trial for 486 animals, though the results given there did not specifically elaborate on the estimates and standard errors of the HGP effects. These are specified below. In the trial, 509 Brahman and F1 Brahman crossbred steers were used. At weaning, these animals were allocated to three market endpoints (Domestic = 220 kg, Korean = 280 kg, Japanese = 320 kg) by two nutritional finishing strategies (grain-based feedlot, pasture-fed). About half of each group was allocated as control (no implant) and the other half as treated (20 mg estradiol-17 about every 100 days). Fuller details of the experimental procedure can be found in Hunter et al. (2001) or Thompson et al. (2008b). The numbers of animals in the six groups are indicated in Table 1. The completed study contains more than twice the number used in Hunter et al. (2001). However, as pointed out in the previous papers, there were some problems with processing some of the carcasses, resulting in cold-shortening: Fig. 1 indicates that there were a number of extremely tough samples. There were also a number of extreme ultimate pH values. To avoid distortion from outliers, meat for which pHu > 5.7 were deleted from the sample. As a result, meat corresponding to the points to the right of Fig. 1 were discarded from the analysis.
|
|
Estimates and standard errors of the effect of HGP implants on tenderness and shear-force are presented in Table 2.
|
Meta-analysis
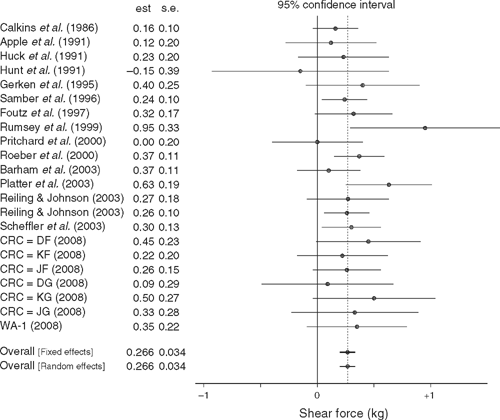
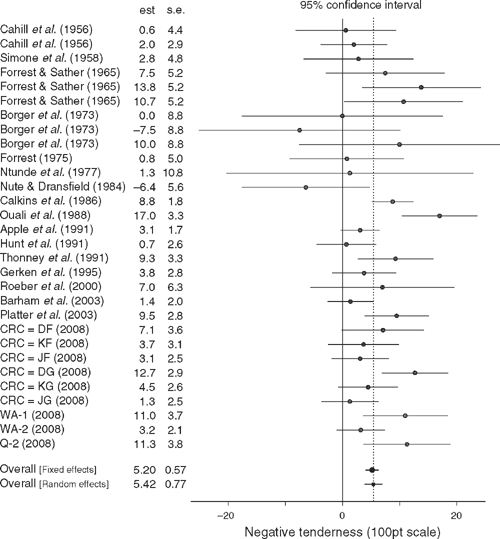
The papers used in the meta-analysis are listed in Figs 2 and 3. The results of the meta-analysis are summarised in Table 4. The details of the meta-analysis procedure are summarised in the Appendix.
|
|
|
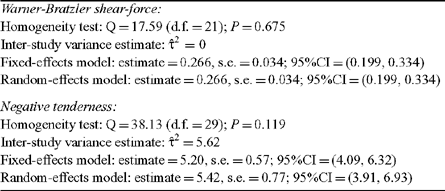
In neither case does the homogeneity test show any significant difference between the studies. In the case of shear-force, the best estimate of the inter-study variance is zero, so that the random-effects model reduces to the fixed-effects model. In the case of the sensory data, there is some indication of a difference between studies, although this is not significant (P = 0.119). Despite this, the random effects model seems preferable, so as to allow for the possible differences between studies. It is a more general model, and it includes the fixed effects model as a special case. Both fixed-effects and random-effects model results are reported: the random-effects confidence interval is slightly wider, to allow for the possible variation between studies.
The meta-analysis is illustrated in Figs 2 and 3. In these figures, each line represents a treatment–control comparison, from the specified paper. The (reported or calculated) estimate and standard error are given and, on the same line, the estimate and the 95% confidence interval are shown: the dot representing the estimate and the line the confidence interval, with respect to the specified scale. The overall estimates and confidence intervals (for both the fixed effects and random effects models) are given at the bottom of the diagram.
The confidence intervals for the separate experiments are usually quite wide, and mostly include zero, indicating non-significance. But when the results are accumulated the result is a narrow confidence interval which clearly excludes zero, and is therefore highly significant.
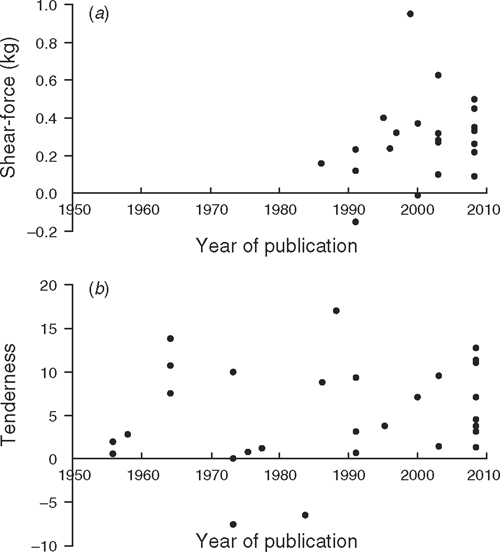
There is significant evidence here that HGP affects palatability negatively. Initially it was felt that some time limitation should be put on the studies considered. However, although there is some (non-significant) indication of a variation between studies, the estimates show no trend with year of publication (see Fig. 4). In fact the results for tenderness after 1980 yield a slightly larger estimate of HGP effect. There seemed to be no good reason for excluding any of the published studies.
|
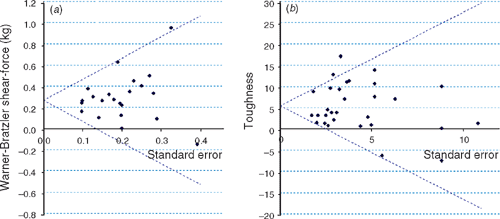
There was no a priori indication for a publication bias, and most results were non-significant in any case. A funnel plot for each of the sets of estimates is show in Fig. 5. There is no indication of asymmetry, which would suggest a publication bias.
|
Conclusion
The evidence presented here suggests very strongly that HGP has a negative effect on beef palatabilty. Evidence for the sensory results dates back 50 years and little seems to have changed: the results for 1955–1980 are quite similar to the results for 1981–2008.
The question which must now be asked is what might be done to ameliorate it. Or is it just a price to be paid for efficient beef production?
Acknowledgements
The author is grateful to two anonymous referees for their thorough reviews and helpful criticisms.
Apple JK,
Dikeman ME,
Simms DD, Kuhl G
(1991) Effects of synthetic hormone implants, singularly or in combinations, on performance, carcass traits, and longissimus muscle palatability of Holstein steers. Journal of Animal Science 69, 4437–4448.
|
CAS |
PubMed |

Barham BL
(2003) Effects of growth implants on consumer perceptions of meat tenderness in beef steers. Journal of Animal Science 81, 3052–3056.
|
CAS |
PubMed |
Bent S
(1999) Antibiotics in acute brichitis. American Journal of Medicine 107, 62–67.
|
CAS |
Crossref |
PubMed |
Borger ML
(1973) Zeranol and dietary protein level effects on live performance, carcass merit, certain endocrine factors and blood metabolite levels of steers. Journal of Animal Science 36, 706–711.
|
CAS |
PubMed |
Cahill VR
(1956) Effect of Diethylstilbestrol implantation on carcass composition and the weight of certain endocrine glands of steers and bulls. Journal of Animal Science 15, 701–709.
|
CAS |
Calkins CR
(1986) Growth, carcass and palatability traits of intact males and steers implanted with zeranol or estradiol early and throughout life. Journal of Animal Science 62, 625–631.
|
CAS |
PubMed |
Cochran WG
(1937) Problems arising in the analysis of a series of similar experiments. Journal of the Royal Statistical Society 4(Supp.), 102–118.
Danesh J
(1998) Association of fibrinogen, C-reactive protein, albumin, or leucocyte count with coronary heart disease. Journal of the American Medical Association 279, 1477–1482.
|
CAS |
Crossref |
PubMed |
DerSimonian RF
(1986) Meta-analysis in clinical trials. Controlled Clinical Trials 7, 177–188.
|
CAS |
Crossref |
PubMed |
Dunn R
(1995) A meta-analytic validation of the Dunn and Dunn model of learning-style preferences. Journal of Educational Research 88, 353–362.
Forrest RJ
(1975) Effects of castration, sire and hormone treatments on the quality of rib roasts from Holstein-Friesian males. Canadian Journal of Animal Science 55, 287–290.
Forrest RJ
(1965) The effect of hormone on the rate of gain feed consumption of Holstein-Friesian steers slaughtered at 340, 522, and 703 kilograms body weight. Canadian Journal of Animal Science 45, 173–179.
|
CAS |
Forza C
(1998) Meta-analysis applied to operations management – summarizing the results of empirical research. International Journal of Production Research 38, 837–861.
Foutz CP
(1997) Anabolic implant effects on steer performance, carcass traits, subprimal yields, and longissimus muscle properties. Journal Animal Science 75, 1256–1265.
|
CAS |
Gerken CL
(1995) Use of genetically identical (clone) steers to determine the effects of estrogenic and androgenic implants on beef quality and palatability characteristics. Journal of Animal Science 73, 3317–3324.
|
CAS |
PubMed |
Glass G
(1976) Primary, secondary and meta-analysis of research. Educational Researcher 5, 3–8.
Gurevitch J
(1999) Statistical issues in ecological meta-analysis. Ecology 80, 1142–1149.
Halpem S
(1998) Effect of epidural vs parenteral analgesia on the progress of labor—a meta-analysis. Journal of the American Medical Association 280, 2105–2110.
| Crossref |
PubMed |
Hardy RJ
(1998) Detecting and describing heterogeneity in meta-analysis. Statistics in Medicine 17, 841–856.
|
CAS |
Crossref |
PubMed |
Hilborn R
(1998) Standing on the shoulders of giants: learning from experience in fisheries. Reviews in Fish Biology and Fisheries 8, 273–283.
| Crossref |
Huck GL
(1991) Frequency and timing of trenbolone acetate implantation on steer performance, carcass characteristics, and beef quality. Journal of Animal Science 69(S1), 560.
Hunt DW
(1991) Use of trenbolone acetate and estradiol in intact and castrate male cattle: effects on growth, serum hormones, and carcass characteristics. Journal of Animal Science 69, 2452–2462.
|
CAS |
PubMed |
Hunter RA
(2001) Sustained growth promotion, carcass and meat quality of steers slaughtered at three liveweights. Australian Journal of Experimental Agriculture 41, 1033–1040.
| Crossref |
Ntunde BN
(1977) Responses in meat characteristics of Holstein–Friesian males to castration and diet. Canadian Journal of Animal Science 57, 449–458.
Nute GR
(1984) The quality of sirloin from zeranol implanted steers. Journal of Food Technology 19, 21–28.
Ouali A
(1988) Anabolic agents in beef production: effects on muscle traits and meat quality. Meat Science 24, 151–161.
|
CAS |
Crossref |
Perry D
(2001) Methods used in the CRC program for the determination of carcass yield and beef quality. Australian Journal of Experimental Agriculture 41, 953–958.
| Crossref |
Phillips J
(1998) Effects of realistic job previews on multiple organizational outcomes: a meta-analysis. Academy of Management Journal 41, 673–698.
| Crossref |
Platter WJ
(2003) Effects of repetitive use of hormonal implants on beef carcass quality, tenderness, and consumer ratings of beef palatability. Journal of Animal Science 81, 984–996.
|
CAS |
PubMed |
Pritchard RH
(2000) A comparison of lifetime implant strategies on production and carcass characteristics in steers. Journal of Animal Science 78(S1), 47.
Quinn M
(1999) A meta-analysis of social skill interventions for students with emotional or behavioral disorders. Journal of Emotional and Behavioural Disorders 7, 54–64.
| Crossref |
Reiling BA
(2003) Effects of implant regimens (Trenbolone acetate-estradiol administered alone or in combination with zeranol) and Vitamin D3 on fresh beef colour and quality. Journal of Animal Science 81, 135–142.
|
CAS |
PubMed |
Roeber DL
(2000) Implant strategies during feeding: impact on carcass grades and consumer acceptability. Journal of Animal Science 78, 1867–1874.
|
CAS |
PubMed |
Rumsey TS
(1999) The effect of roasted soybeans in the diet of feedlot steers and Synovex-S Ear implants on carcass characteristics and estimated composition. Journal of Animal Science 77, 1726–1734.
|
CAS |
PubMed |
Samber JA
(1996) Implant program effects on performance and carcass quality of steer calves finished for 212 days. Journal of Animal Science 74, 1470–1476.
|
CAS |
PubMed |
Scheffler JM
(2003) Effect of repeated administration of combination trenbolone acetate and estradiol implants on growth, carcass traits, and beef quality of long-fed Holstein steers. Journal of Animal Science 81, 2395–2400.
|
CAS |
PubMed |
Simone M
(1958) Effect of methods of Silbestrol administration on quality factors of beef. Journal of Animal Science 17, 834–840.
|
CAS |
Thompson JM
(2008a) Effects of hormonal growth promotants (HGP) on growth, carcass characteristics, the palatability of different muscles in the beef carcass and their interaction with aging. Australian Journal of Experimental Agriculture 48, 1405–1414.
|
CAS |
Thompson JM
(2008b) Effect of repeated implants of oestradiol-17β on beef palatability in Brahman and Brahman cross steers finished to different market end points. Australian Journal of Experimental Agriculture 48, 1434–1441.
|
CAS |
Thompson S
(1991) Can meta-analysis be trusted?
(editorial). Lancet 338, 1127–1130.
|
CAS |
Crossref |
PubMed |
Thonney ML
(1991)
Comparison of steaks from Holstein and Simmental × Angus Steers. Journal of Animal Science 69, 4866–4870.
|
CAS |
PubMed |
Touloumi GF
(1997) Short term effects of ambient oxidant exposure on mortality: a combined analysis within the APHEA project. American Journal of Epidemiology 146, 177–185.
|
CAS |
PubMed |
Watson R
(2008a) Consumer assessment of eating quality – development of protocols for Meat Standards Australia (MSA) testing. Australian Journal of Experimental Agriculture 48, 1360–1367.
Watson R
(2008b) Effect of hormonal growth promotants on palatability and carcass traits of various muscles from steer and heifer carcasses from a Bos indicus–Bos taurus composite cross. Australian Journal of Experimental Agriculture 48, 1415–1424.
|
CAS |
Appendix: Meta-analysis
Consider a collection of k studies, each of which measures the effect of a particular intervention. It can be assumed that from each of these studies a point estimate of the effect of intervention and a standard error of that estimate are available. This Appendix considers two standard methods by which these studies may be combined in order to obtain an estimate and confidence interval for the overall effect of the intervention of interest.
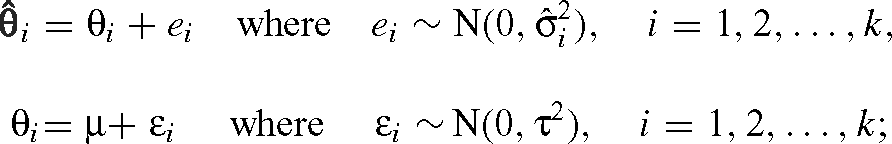
For each of the k studies let  (i = 1,2,…,k) denote the estimated effect of intervention and θi the true effect of intervention. A general model is then specified by

and the ei are assumed to be independent. The estimated effect size can be any measure of effect provided the assumption of normality is (at least approximately) appropriate.
In practice the σi2 are unknown and so estimated variances are used. It is widely assumed, however, that the individual studies provide reasonable estimates of the σi2. This assumption is almost universally made when the studies are analysed individually and should be the case provided the studies are at least moderate in size. In order to emphasize that the within study variances are estimated, the notation  is used, where
  is the standard error of . The general model is therefore rewritten as

For the meta-analyses considered here, the parameter of interest
is the overall effect of intervention, denoted μ. In the
remainder of this Appendix outlines both the fixed and random
effects models and describes how each relates μ to the
θi. In both cases the estimates are point estimates of μ. Mention is also made of a test of homogeneity, widely used to select either the fixed or random effects model.
The fixed effects approach
The fixed effects model for meta-analysis assumes that the k studies are homogeneous—each having the same true effect of intervention. Therefore θi = μ for all i = 1,2,…,k, giving the model

This model only allows for within-study variation.
The overall effect μ is commonly estimated using a weighted average. Ignoring the sampling error in the , it is optimal to use weights proportional to giving
The notation  is used to indicate that the weights use estimates , although the variation associated with these estimates is ignored in practice. Under the assumptions of independence and normality,
and an approximate 95% confidence interval for μ is given by

The random effects method and testing for homogeneity
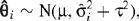
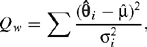
Under the random effects model a distribution is assumed for the θi giving the two-stage model
and where the ei and εi are assumed to be independent. In this model, the true effect for study i is centred around the overall effect μ, allowing the individual studies to vary in both estimated and true effect. The between-study variance parameter, τ2, is a measure of the heterogeneity between studies and clearly this model permits both within and between-study variation.
This model can be written

giving
under the assumptions of normality and independence. The variance of includes both within and between-study variance components. The fixed effects model is a special case of the random effects model with τ2 = 0. Selection of either the fixed effects or random effects models can therefore be carried out by testing the hypothesis τ2 = 0 against a one-sided alternative. If τ2 = 0 the studies are considered to be homogeneous. If the σi2 are known, a test of the homogeneity between studies can be carried out using a statistic defined by Cochran (1937):
which has a χ2k−1 distribution under the hypothesis τ2 = 0. In practice however the σi2 are not known and the statistic
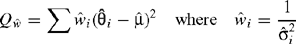
is used. If τ2 = 0 then  approximately, and the hypothesis of homogeneity is rejected if
 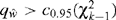 .
.
This test is frequently used to determine whether the fixed or random effects model should be adopted (for example Touloumi et al. 1997; Danesh et al. 1998). It has been suggested, however, that the power of this test can be low (Thompson and Pocock 1991; Hardy and Thompson 1998).
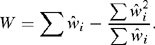
In order to estimate μ under the random effects model an estimate of τ2, the between-study variance parameter, is required.
Under the random effects model it is assumed that 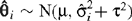 . As for the fixed effects method a weighted average is generally used to estimate μ where the weights are derived from the variances of the , i = 1,2,…,k. Therefore
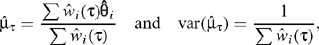
where
Here the sampling error in the is ignored and it is assumed that τ2 is known. Under these assumptions
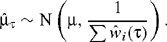
In practice however, τ2 must be estimated. The most widely-used estimate of τ2 is one proposed by DerSimonian and Laird (1986):
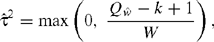
where  denotes the observed value of the homogeneity statistic and
This estimate is obtained by equating the expected value of with the observed value, and truncating to ensure that  .
.
The estimate of τ2 is then directly incorporated into the random effects weights, giving
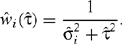
This yields
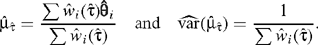
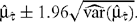
Confidence intervals for μ are calculated under the assumption of normality; thus a 95% confidence interval for μ is given by
In cases where  the random effects method estimate and interval for μ are the same as those for the fixed effects method.