

Environmental consequences of a consumer shift from dairy- to soy-based products
Aaron T. Simmons A B * , Miguel Brandão C , Zita Ritchie D and Guy Roth E
A New South Wales Department of Primary Industries, 98 Victoria Street, Taree, NSW 2430, Australia.
B University of New England, School of Business, Elm Avenue, Armidale, NSW 2351, Australia.
C KTH – Royal Institute of Technology, Stockholm SE-100 44, Sweden.
D New South Wales Department of Primary Industries, 1243 Bruxner Highway, Wollongbar, NSW 2477, Australia.
E The University of Sydney, School of Life and Environmental Science, Sydney Institute of Agriculture, 12566 Newell Highway, Narrabri, NSW 2390, Australia.
Abstract
Climate change and water scarcity are global challenges facing humanity. Animal agriculture generates considerable greenhouse gas (GHG) emissions and consumes large volumes of water from rivers, streams and lakes. Reducing consumption of animal agricultural products with a relatively high carbon or water footprint, such as dairy, is often promoted as a mechanism to reduce the environmental impacts of food production. Attributionally-based footprints do not, however, assess the consequences of a change in demand for a product.
This study aimed to assess the water and climate change consequences of replacing NSW dairy production, and co-products of dairy production, with plant-based alternatives.
Process-based consequential life cycle assessment was used.
Water savings associated with the change would be limited and GHG emissions reductions would be ~86% of that as estimated by the carbon footprint of production. When NSW dairy production was replaced with soy-based alternatives and two GHG emissions reduction strategies were implemented across the industry, namely enteric methane inhibitors and flaring methane from effluent ponds, GHG emissions increased by 0.63 Mt carbon dioxide equivalent when dairy production was replaced.
The environmental benefits associated with replacing NSW dairy production with plant-based alternatives should not be determined by attributionally-based approaches.
Policies that aim to reduce the environmental impacts of agricultural production need to consider the market effects of a change in demand for products and not rely on estimated impacts of current production.
Keywords: climate change, consequential life cycle assessment, irrigation, land use, market effects, mitigation, water.
Introduction
Livestock supply humans with food and other products (e.g. raw materials for textiles), and dairy is an animal product that is consumed worldwide. It is an excellent source of calcium and other nutrients and evidence suggests dairy consumption generally has positive health benefits (Zhang et al. 2021a) and that dairy intake is associated with high quality diets (Ridoutt et al. 2021). Dairy is a key agricultural industry in New South Wales (NSW), Australia, where around 1 GL of raw milk at the farm gate is produced per annum, the sale of which contributes ~$600 million to the state’s gross domestic product (ABS 2020a). Dairy production is also a key user of natural resources such as water, with ~5% of all water used for agriculture in NSW used by the dairy industry (ABS 2020b), where is it used for livestock drinking water, pasture irrigation and washing down dairies after milking. Dairy production occurs throughout the state. This includes inland NSW, part of the Murray–Darling Basin; a catchment that is considered to be highly water-stressed (Boulay et al. 2018). Dairy production also requires the use of land, both arable and non-arable. Arable land is used to grow pastures and crops that can be irrigated or rainfed depending on water availability. Non-arable land cannot be used to grow crops due to poor soil quality and/or high slope so is generally used to graze heifers before they enter the milking herd or cows that are dried-off prior to calving. Dairy production also generates environmental impacts and one impact of key concern is the generation of greenhouse gases (GHGs) from dairy production. Dairy production emits greenhouse gases primarily from enteric methane emitted by dairy cattle but also from other sources such as cattle manure, and more indirectly from the breakdown of plant residues and the use of fertilisers and electricity (Ridoutt et al. 2010). The impacts of GHG emissions on the global climate are recognised by the Australian dairy industry, which has set a target of a 30% in GHG emissions by 2030 (Dairy Australia 2020a).
The considerable water and carbon footprints of dairy production, as estimated using attributional approaches that estimate the impacts associated with current production, have resulted in calls for reductions in dairy consumption to reduce the environmental impacts of consumer consumption (Poore and Nemecek 2018; Berners-Lee 2020; Marinova and Bogueva 2020; Kovacs et al. 2021). However, attributional footprints are not suitable to be used to inform decisions because they do not consider the consequences of changes to a system (Plevin et al. 2013; Perry 2014; White and Hall 2017; Simmons et al. 2020). For example, organic food has a lower carbon footprint than conventionally grown food but the consequences of a move to organic agricultural production in England and Wales would increase the climate change impacts of food production (Smith et al. 2019). This is because organic production systems have lower yields so more agricultural land would be required to produce the same amount of food, and the emissions associated with the creation of more agricultural land were greater than the savings from converting to organic production. It is also important to include the market effects of changes in demand for a product (i.e. changes to co-production) but attributional footprints do not consider these market effects. For example, an attributional analysis suggested that increasing the production of milk per cow, and reducing the number of cows, was a climate change mitigation strategy because it reduces the emissions intensity of milk production (Zehetmeier et al. 2012); however, reducing the numbers of cows also reduces the number of calves produced and therefore the red meat that is produced by the system. That study demonstrated that when the GHG emissions associated with replacing the red meat no longer produced by the dairy system was replaced with meat from specialised beef production system, there was no GHG abatement associated with increasing milk production per cow.
Attributional footprints have been used to assess the impacts of dairy production (Ridoutt et al. 2010; Henriksson et al. 2011; Vergé et al. 2013; Gollnow et al. 2014; O’Brien et al. 2014; Palhares and Pezzopane 2015; Vasilaki et al. 2016) and one attributional study has compared the GHG emissions associated with the production of milk from cows and from soy (Coluccia et al. 2022). That study found that soy milk had a carbon footprint that was 88% lower than cow’s milk and concluded that environmental advantages would result from replacing cows milk with soy milk. Calls to cease dairy production and/or to move plant-based milk alternatives based on the impacts of current production do not consider the re-allocation of resources required to replace dairy milk with a milk alternative. This is important because both milk and milk substitutes utilise constrained resources such as agricultural land and water. In addition, using attributional footprints to call for a cessation of dairy production disregards the impacts of producing functional equivalents of the co-products of the dairy system (i.e. red meat, hides, meat meal and cream). Accordingly, this study assessed the water and climate change consequences of a consumer shift to soy-based products that resulted in the cessation of dairy production in NSW, Australia, and required the replacement of not only cow’s milk but also the co-products of dairy production.
Materials and methods
System boundaries
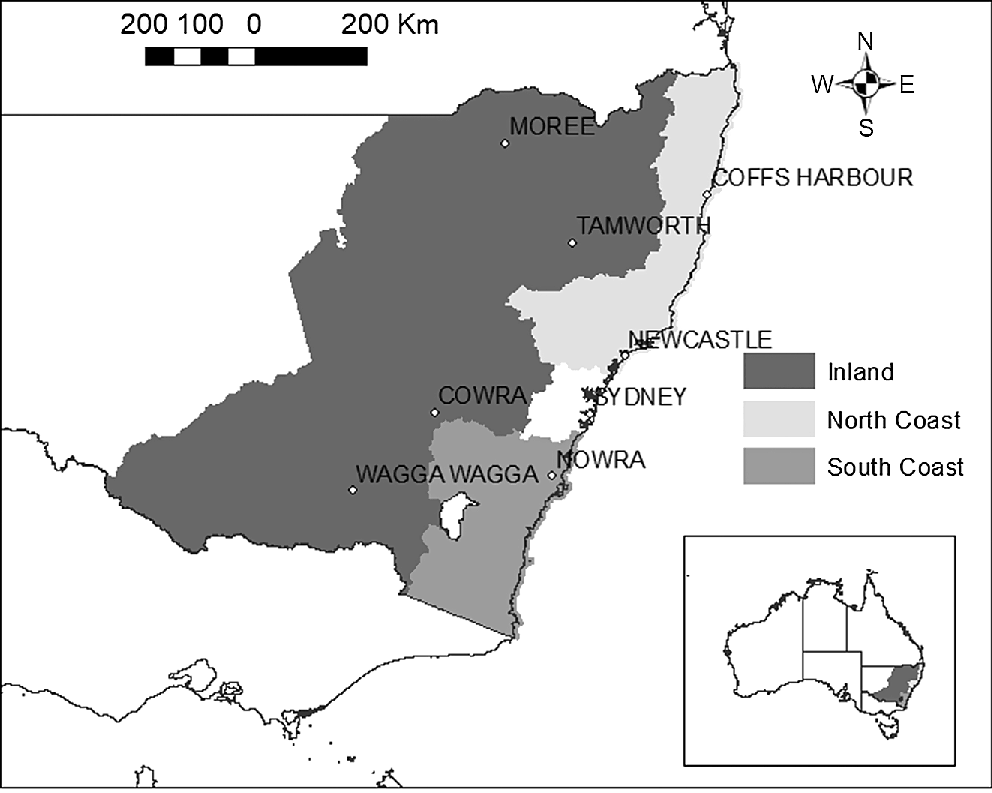
We assessed the cradle-to-gate water and climate change impacts of replacing NSW dairy milk with soy-based milk. Due to concerns about the environmental and animal welfare issues around beef production, we assumed dairy co-products were replaced with plant-based functional equivalents, including tofu. A full list of products and co-products and their functional equivalents is presented in Table 1. Convention in life cycle assessment studies is for the assessment to be done for a single functional unit; however, this is not possible for sector-scale assessment, where multiple co-products – each with a separate function – are included in the analysis (Smith et al. 2019). The basis on which dairy products and co-products were replaced was dependent on their function (Table 1). Consequences were assessed on a regional basis for three regions; the North Coast, South Coast and Inland (Fig. 1). These regions were used because they represent distinct agro-climatic zones. The North Coast of NSW has a sub-tropical climate, whereas the South Coast is temperate, and the Inland region of NSW has a Mediterranean climate. In addition, the Inland region of NSW is covered by the one river catchment (i.e. the Murray Darling Basin (MDB)). Where necessary (e.g. where the increase in supply of land was insufficient to that required to supply functional equivalents), the system boundaries were expanded to include global production (as described in the section below).
| Product/co-product | Function | Functional equivalent | Substitution basis | |
|---|---|---|---|---|
| Fresh milk | Human consumption | Soy milk | Volume | |
| Fresh cream | Human consumption | Soy milk/vegetable oil (2:1 ratio) | Volume | |
| Cream in butter | Human consumption | Soy oil | Volume | |
| Red meat | Human consumption | Tofu | Protein mass | |
| Hide | Leather | PVC | Mass | |
| Tallow | Multiple | Vegetable oil | Mass | |
| Offal | Pet meat | Soy meal | Protein mass | |
| Meat meal | Chicken/pig feed | Soy meal | Protein mass | |
| Okara | Fertiliser | Urea | Nitrogen mass |
Production and resource-use changes
Dairy production occurs on both arable land (i.e. land that has characteristics that allow it to be used for either crops or grassland) and non-arable land (i.e. land that has limitations that exclude cropping as an activity so are used as grasslands). All arable land vacated by dairy production was assumed to be used to grow soybeans to first replace dairy products with soy milk and any remaining soybeans were assumed to produce tofu as a replacement for red meat. Growing soybean crops in succession is considered poor agronomics due to the build-up of disease and weeds that reduces crop yields, so we assumed that soybeans were grown in rotation with wheat. For irrigated cropland, a 2-year rotation of irrigated soybeans and unirrigated (dryland) wheat was used and for unirrigated cropland a 2-year rotation of unirrigated soybeans and wheat was used. Water used for dairy production is either irrigation water or water used for livestock drinking. This is an important distinction to make because, in NSW, extractions for irrigation are licensed differently to water extracted for livestock drinking. Water used for irrigation on dairy farms was assumed to be redirected to the production of soy milk and then to irrigating soybean crops for soy milk and tofu production. Water used for livestock was assumed to be made available to other river users under relevant licensing provisions. Where soybean production in a region could not meet the mass required to replace all products and co-products, it was assumed that demand for marginal global soybean production increased. Conversely, where soybean production exceeded demand for soy milk and tofu, the additional production was assumed to avoid global soybean production.
The wheat produced in the soybean–wheat rotation was assumed to increase the global supply of wheat and reduce the need to produce wheat elsewhere. Dairy cattle are fed supplements that consist primarily of cereals and plant-based protein meal (e.g. canola meal) so it was assumed that a reduction in feeding supplements reduced global supply of wheat and protein meal thereby reducing the need to produce wheat and protein meal elsewhere.
Cream is separated from the milk during processing. We assumed that cream was either used as unprocessed cream or processed to make butter. The reduction in meat meal and offal as a co-product was assumed to increase global demand for by-products (i.e. dependent co-products). Soy milk and tofu production results in the co-production of the residues from the process, okara. Okara has limited uses (Li et al. 2012) and can be used as animal feed but characteristics such as fast rate of decay and high density limits the practicality of its use (Rahman et al. 2021). Hence, it was assumed that okara was applied to wheat paddocks, avoiding the need for nitrogen fertilisers on a 1:1 nitrogen mass basis.
Non-arable land is used in dairy systems primarily for growing out heifers to join the milking herd or to dry off cows that are due to calve; however, this land is not suitable for soybean production because the soils are generally too poor or the land is too steep. Under current market conditions, this land would be used to graze beef cattle if dairy production were to cease; however, the objective of the current study was to replace dairy and dairy co-products with plant-based alternatives. We, therefore, assumed that non-arable land was allowed to revegetate and sequester atmospheric carbon to provide climate change mitigation. Carbon sequestration was estimated for a central point in each region using the Full Carbon Accounting Model ((FullCAM; Australian Government 2018a). FullCAM is the model developed by the Australian Government to estimate carbon sequestration in vegetation for the purposes of reporting total GHG emissions to the United Nations Framework Convention on Climate Change (UNFCCC) and to estimate carbon sequestration for the purposes of awarding carbon credits under the Emissions Reduction Fund (ERF). For this study, we followed the guidelines (Australian Government 2020) for the Human Induced Regeneration methodology developed by the Australian Government to issue carbon credits under the ERF (Australian Government 2016). Carbon sequestration in regenerating areas is minimal during the initial years so the average carbon sequestration over the first 10 years of the simulation was used for each region. Realistically, re-vegetated land would be populated by native and feral animals (e.g. kangaroos and goats, respectively) and the emissions from these animals need to be included in any assessment. To include these impacts we assumed that kangaroos would populate the re-vegetated area and included these enteric methane emissions as calculated by Vendl et al. (2015) at estimated densities for each region (Steve McCleod, pers. comm.).
Mitigation strategies
We also tested what the consequences of ceasing NSW dairy production would be if two climate change mitigation strategies, feeding enteric methane inhibitors and capturing methane from manure collected at the dairy, were implemented across the NSW dairy industry as a theoretical alternative baseline. Roque et al. (2019) showed that dairy cows fed 1% Asparagopsis armata reduced enteric methane production, dry matter intake and milk production per cow by 67%, 38% and 11%, respectively. To test the impact of enteric methane reduction inhibitors on results, we assumed that enteric methane emissions and milk production per cow declined by those amounts. The reduction in total dry matter intake per cow would mean that more cows could be milked using the existing resources, so we assumed that the number of cows in the milking herd increased by 50%. This 50% increase is lower than achievable based on changes to dry matter intake alone (e.g. 1000 kg of dry matter at 10 kg hd−1 day−1 would supply 100 animals day−1 or 161 animals day−1 at 6.2 kg hd−1 day−1 when dry matter intake was reduced by 38%) but increasing the numbers of milking cows will be limited to some extent by infrastructure (e.g. shade, laneways) and limiting the increase to 50% accounts for these limitations. For the methane capture mitigation strategy, it was assumed that effluent ponds were covered, and methane was flared converting it to CO2. The emissions reductions associated with the implementation varies on the dairy system and were calculated as described in the GHG emissions calculations section.
Sensitivity analysis
Sensitivity analysis was used to test how sensitive the results of the study were to changes in the proportion of the farm that was arable, proportion of raw milk that was cream, soybean yields, carbon sequestration in vegetation, the availability of water, the water required to grow a soybean crop and the enteric methane emissions reduction associated with the feeding of A. armata (Table 2).
| GHG emissions (Mt CO2-e) | ||||
|---|---|---|---|---|
| Parameter | Variation (%) | Parameter increase | Parameter decrease | |
| Proportion of land arable | 50 | −1.06 | −1.16 | |
| Proportion of raw milk as cream | 25 | −1.05 | −1.18 | |
| Soybean yield | 25 | −1.26 | −0.98 | |
| Carbon sequestration in vegetation | 50 | −1.14 | −1.1 | |
| Water availability | 50 | −1.13 | −1.11 | |
| Water requirements for irrigated soy production | 25 | −1.12 | −1.13 | |
| Enteric methane reduction from A. armata | 50A | – | 0.01 | |
AA decrease only was assessed.
Life cycle inventory
Inventories for dairy, soybean and wheat production were developed by modifying relevant inventory from AusLCI (the Australian Life Cycle Inventory Database) and ecoinvent inventories modified with Australian data (Grant et al. 2017), with values that represented each region and included all farm operations and inputs. A list of input data and sources used to develop inventory is available in Supplementary Table S1. Regional experts were used to source and/or validate input data and consisted of dairy advisors and processors in each relevant region. The inputs, farm operations and outputs for each crop are presented in the Supplementary materials. Global production of soybean, vegetable oil and protein meal were represented by the appropriate inventory in the ecoinvent v3.5 consequential database (Weidema et al. 2013).
GHG emissions calculations
GHG emissions associated with the disposal of manure in the effluent system, including the spreading of effluent on paddocks, were calculated using the dairy GHG accounting tool (Eckard 2020) using input data as described in Table S1. GHG emissions associated with fertiliser use on farm, crop residue breakdown and dissolution of lime were calculated using the relevant methods from the Australian National Inventory report (Australian Government 2018b). Where GHG emissions were dependent on other biophysical processes (e.g. leaching of nitrates), calculations from the Australian National Inventory report were also used. Although it is highly likely that soil organic carbon (SOC) would be lost when converting grassland to cropland, the impacts of crop management practices on SOC are highly uncertain (Badgery et al. 2013) so we were conservative and assumed that there was no change in SOC. Emissions calculations in background inventory that represented global demand of crops were not modified.
Impact assessment
Impact assessment was done using SimaPro v8.3.0 (PRé Sustainability 2016) with the AusLCI indicator set (Renouf et al. 2015). This study used values for global warming potential over a 100 year period (GWP100) associated with the sixth assessment report (AR6) (Forster et al. 2021). These were 273, 29.8 and 27.2 for nitrous oxide (N2O), methane (CH4, fossil origin) and CH4 (non-fossil origin), respectively. Blue water stress impacts were assessed using the AWARE methodology (Available WAter REmaining, Boulay et al. 2018) and, because the North Coast and South Coast regions include multiple catchments, characterisation factors for these regions were the average of all catchments in each region. This gave an AWARE characterisation factor of 1.5, 1.2 and 92 for the North Coast, South Coast and Inland regions, respectively.
Results
Changes in commodity production
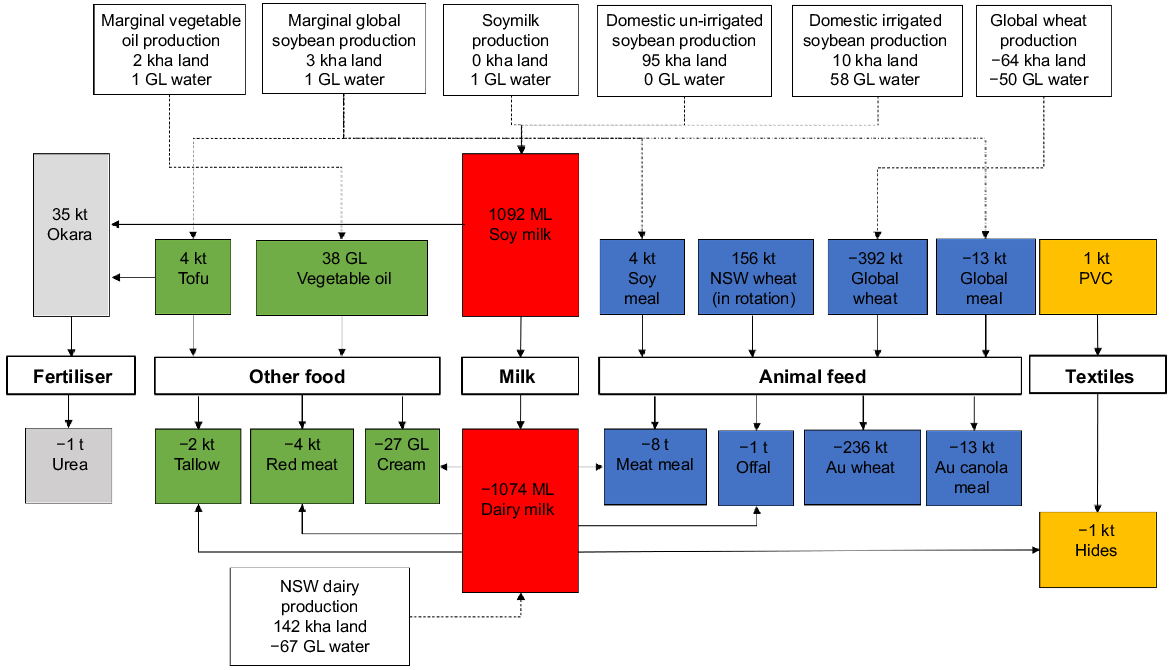
Ceasing dairy production in NSW reduced raw milk at the farm gate by 1074 kL, with the greatest reduction occurring in the South Coast region (Fig. S1). Ceasing dairy production in NSW also resulted in a decrease in the co-products of cream (27 kt), red meat (4 kt), tallow (2 kt), meat meal (8 kt), offal (1 kt) and hides for leather (1 kt) (Fig. 2). 182 kt of soybeans were required to replace dairy and dairy co-products, of which 114 kt were produced in NSW on arable land that had been used for dairy production and the remaining 68 kt of soybeans were supplied by global marginal production. An additional 156 kt of wheat were produced in rotation with soybeans and this production, combined with the wheat no longer fed to cattle as supplements, resulted in 392 kt of global wheat production being avoided. No longer feeding cattle also resulted in 13 kt of protein meal usage being avoided. Replacing meat meal and offal that comes from slaughtered dairy animals required 4 kt of protein meal, and 38 kt of vegetable oil from global marginal production were required to replace the fat in cream and tallow co-produced by the dairy system.
Land use
Ceasing dairy production in NSW freed up 142 kha of agricultural land but once changes were implemented, 108 kha of land freed up was used for soybean production and 34 kha was used for revegetation to sequester atmospheric C. Replacing fat associated with dairy production also required an additional 2 kha of agricultural land. The canola meal no longer required in the dairy system resulted in less protein meal being required on the global market freeing up 10 kha of agricultural land. The increase in supply of wheat due to dairy cattle no longer being fed supplements and due to wheat produced in rotation with soybeans resulted in an additional 118 kha of agricultural land being freed up. In combination, these changes resulted in a total of 109 kha of agricultural land being freed up at a global level. Replacing dairy with soy-based products in the South Coast made the greatest contribution to total land sparing (Fig. S2).
Water consumption
The blue water footprints of raw milk were 54, 24 and 21 L H2O L raw milk−1 for the North Coast, South Coast and Inland regions, respectively, and the production weighted average for NSW was 39 L H2O L raw milk−1. Ceasing dairy production resulted in 59 GL of irrigation water and 8 GL of livestock drinking water not being extracted from the river for dairy production, with the greatest savings occurring in the South Coast region (Fig. S3). However, of that 59 GL of irrigation water, 1 GL was re-purposed as the base liquid in soy milk and the remainder of irrigation water was used to grow soybeans to produce soy milk and tofu. For global production, 9 GL of water were required to grow global soybeans and vegetable oil whereas 124 GL were saved by the increase in wheat supply associated with ceasing NSW dairy production avoiding the need for global wheat production. The net balance at a global level was a reduction in water consumption by 123 GL, of which 8 GL was water not consumed by livestock in NSW.
Water scarcity impacts
Water scarcity footprints for raw milk production were 81, 29 and 2011 L water equivalent (H2O-e) L−1 for the North Coast, South Coast and Inland regions, respectively, with the average for NSW of 510 L H2O-e L−1. Ceasing NSW dairy production reduced water scarcity impacts at a global level by 1962 GL H2O-e with the greatest reduction associated with changes that occurred in the North Coast region (Fig. S4).
Greenhouse gas emissions
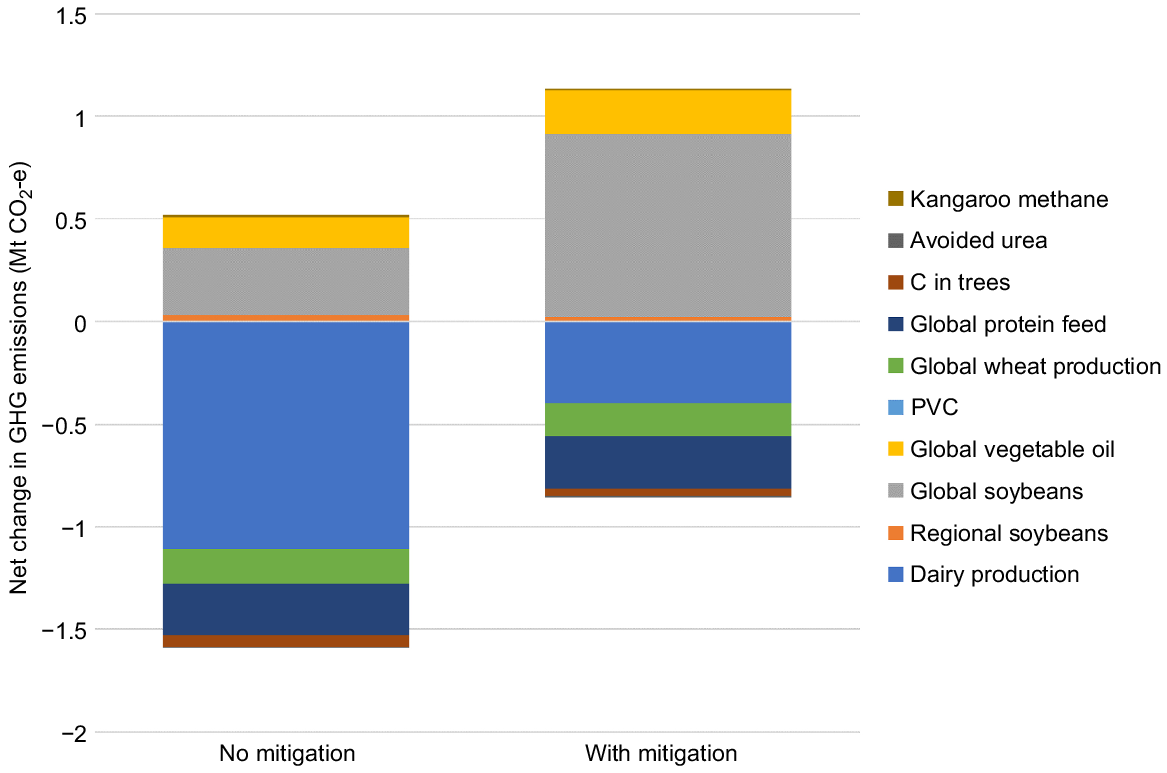
The carbon footprints of raw milk production in the North Coast, South Coast and Inland regions were 1.33, 1.06 and 1.14 kg CO2-e L−1, respectively (Fig. S5), with a production weighted carbon footprint for NSW of 1.15 kg CO2-e L−1. Results suggest that replacing dairy and dairy co-products with plant-based alternatives would reduce GHG emissions by 1.07 Mt CO2-e (Fig. 3). The greatest reduction occurred in the South Coast region due to the volume of milk produced in that region (Fig. S5). For NSW, the greatest emissions savings came from avoided emissions associated with dairy production. Avoided global wheat production and protein feed also made considerable contributions to emissions reductions associated with replacing NSW dairy production with plant-based alternatives (Fig. 3). These emissions savings were offset by global soybean production for tofu and soy milk, but also global vegetable oil production to replace tallow and fat in cream.
Climate change mitigation strategies
The reduction in dry matter required to produce one litre of milk that occurred with the feeding of Asparagopsis to dairy cattle resulted in the production of an additional 483 kL of milk using the same amount of land and inputs. The attributional footprint of raw milk produced when both mitigation strategies were implemented was 0.40 kg CO2-e L milk−1, a reduction of 65%. However, the increase in animal numbers associated with more efficient use of feed resulted in a total emissions reduction of 48% to 0.55 Mt CO2-e. Replacing NSW dairy production with soy-based products, with GHG reduction strategies implemented, was found to increase GHG emissions by 0.63 Mt CO2-e.
Sensitivity analysis
Sensitivity analysis (Table 2) showed that results were sensitive to the proportion of each farm that was under arable land, with an increase in the proportion of land that was under arable reducing GHG emissions. GHG emissions were also reduced when soybean yields increased. These results occurred because increasing arable land or soybean yield resulted in greater soybean production that reduced the need for global soybean production to replace dairy and dairy co-products. Results were also relatively sensitive to the proportion of cream in raw milk, with an increase in the proportion of cream resulting in greater climate change impacts that were attributed to an increase in the production of global vegetable oil to replace cream. Results were relatively unaffected by the carbon sequestered in vegetation, the water available for irrigation or the water required to grow a soybean crop. Importantly, the effectiveness of A. armata as an enteric methane inhibitor in the results was critical. A reduction in enteric methane inhibition of 50% of that of the baseline value of 67% (i.e. feeding A. armata resulted in a 33% decrease in enteric methane) resulted in little to no increase in GHG emissions associated when soy-based products replaced dairy.
Discussion
When assessed using attributional approaches, dairy milk has relatively high water and carbon footprints compared to alternatives (Ercin et al. 2012; Coluccia et al. 2022) and these high footprints have been used as a justification to substitute dairy products with plant-based alternatives (Poore and Nemecek 2018; Berners-Lee 2020; Marinova and Bogueva 2020; Kovacs et al. 2021). A large shift in consumer demand to plant-based alternatives would see a reduction in dairy production and an increase in demand for milk alternatives and functional equivalents of co-products from the dairy system. Based on the attributional analysis in this study, ceasing NSW dairy production would reduce GHG emissions by 1.23 Mt CO2-e per annum. Our analysis, which included market-mediated effects of changes in demand when dairy and dairy co-products were replaced with soy milk and plant-based functional equivalents, suggests that ceasing NSW dairy production is a climate change mitigation strategy. It would result in GHG emissions reductions of 1.07 Mt CO2-e, or 86% of that estimated using an attributional approach. The greatest reduction in net GHG emissions (Fig. 3) was due to ceasing dairy production, however avoided global production of crops also made a significant contribution to net GHG emissions reductions. This was due to 207 kt of wheat and 13 kt of protein meal from unneeded cattle feed and wheat grown in rotation with soybeans entering global supply chains. Previous research supports the finding that market-mediated effects associated with production changes can make a considerable contribution to the net change in GHG emissions when demand for a commodity changes (Nguyen et al. 2021). One focus of emissions reductions in agricultural systems is reforestation to sequester carbon in vegetation (Longmire et al. 2015) and the Australian government incentivises carbon sequestration in vegetation via the generation of carbon credits associated with revegetation (Australian Government 2016). Results from the present study suggest that market effects of production changes (e.g. GHG emissions avoided due to an increase in global wheat and protein meal supply) had a greater impact on the net GHG emission changes than sequestration of carbon in vegetation on non-arable land. This suggests that strategies that use existing resource more efficiently may provide more climate change mitigation than activities such as revegetation.
Ceasing dairy production appears to be an effective climate change mitigation strategy, however opportunities to reduce the GHG emissions associated within the NSW dairy sector also exist. Results suggest that inhibiting enteric methane production via the feeding of Asparagopsis and capturing manure emissions have the potential to reduce emissions by around half of current emissions while producing an additional 483 ML of raw milk. It is highly likely that enteric methane mitigation strategies will be widely adopted in dairy systems in the near future to reduce GHG emissions associated with production to meet demands for low-emissions food. For example, Asparagopsis production enterprises such as FutureFeed, are working to bring that technology to market, the compound 3-nitroxypropanol that reduces enteric methane emissions (Garcia et al. 2022; Pitta et al. 2022) is already being used commercially (JBS 2021) and the use of anti-methanogenic pasture species are also being assessed (Badgery et al. 2023). Further, strategies to capture and combust methane are already being used in larger dairies (Latimer 2019) and will possibly be implemented more widely as the technology matures and costs come down. In addition to the strategies assessed here, other strategies to reduce emissions in dairy systems exist. Heat and electricity from fossil-fuel derived sources can instead be co-generated when combusting methane captured from manure and through solar- and/or wind-generated electricity and battery storage. In addition, nitrification/urease inhibitors can be applied to fertilisers to reduce N2O emissions (Zhang et al. 2023) and electric tractors that can be powered by renewable electricity are in development. Including emissions reductions associated with the implementation of these strategies was beyond the scope of the current study, however the analysis presented here provides an indication of the emissions reductions that the industry can achieve. The results presented here also suggest that meeting the target of a 30% reduction in GHG emissions by 2030 is achievable, at least by the NSW dairy sector, if climate change mitigation strategies are implemented across the industry. These results should provide an impetus for the NSW dairy industry to move towards lower emission production systems. Most importantly, however, results suggest that when enteric methane inhibition and capture of manure methane were implemented, replacing NSW dairy with soy-based products resulted in a net increase in GHG emissions (Fig. 3). It would take a relatively small reduction in enteric methane emissions from using Asparagopsis, of approximately 25%, for a shift to soy milk to no longer become a climate change mitigation strategy. We recommend that the emissions reductions from the implementation of enteric methane inhibition strategies be monitored and a consequential approach re-applied over time as new data becomes available.
Average historic yields for soybean production were assumed for this study and sensitivity analysis suggests that increasing the yield of soybeans would not change the conclusions drawn from the results of the study (Table 2). However, increasing the yield of soybean production provided benefits mainly because it reduced the volume of soybeans required from global marginal production to produce adequate tofu and soy milk. However, it should be noted that the capacity to significantly increase soybean yields above those assumed here without a subsequent increase in GHG emissions is limited because soybeans biologically fix nitrogen from the atmosphere avoiding the need for nitrogenous fertilisers, one key source of GHG emissions (Simmons et al. 2019). As such, applying nitrogenous fertilisers to increase yields would considerably change the results presented here. It was also not reasonable to assume that more cropland was used to produce soybeans in NSW, thereby avoiding the need for global marginal production, because doing so would displace other crops and induce global marginal production of those crops. Similarly, it would not have been reasonable to assume that more soybeans could be grown through more irrigation because doing so would take water from the production of other irrigated crops. This reduction in irrigation water would result in lower production and would require global marginal production to ensure supply of those crops was maintained.
Similar to GHG emissions, estimating water savings and changes to water scarcity using an attributional approach does not consider the market-mediated effects of a change. An attributional perspective would suggest that ceasing NSW dairy production would result in 67 GL of water being returned to the environment, and reduce water scarcity impacts in NSW by 548 GL H2O-e. However, irrigation water in NSW is a tradeable asset, and also a constrained input, so any water that is not used for irrigating feed for dairy production would be traded and re-purposed for another use. In the present study, 1 GL of the water no longer used by the dairy industry was required as the base for soy milk in order to replace cow’s milk and the remaining irrigation water was re-purposed to irrigated soybean production (Fig. S3). As a result, ceasing dairy production in NSW would not result in any irrigation water being returned to the environment and there would be no reduction in water scarcity impacts. This study assumed that all water made available was redirected to growing soybeans, but realistically water would be used for many purposes. Nevertheless, the outcome would be the same (i.e. no additional water would be returned to the environment). Dairy production in NSW also uses water that is extracted under a stock and domestic licence to cattle drinking water. An attributional assessment would suggest that ceasing NSW dairy production would result in an additional 8 GL of water being returned to the environment, however the extraction of water for stock and domestic use is a basic right of any landholders whose land adjoins a waterway under NSW water legislation (Water Management Act 2000 No 92). Further, extractions of stock and domestic water do not have a volumetric cap like extractions for irrigation water so landholders are entitled to extract water for stock and domestic purposes as long as flowing water is present in the river. It is likely that additional water may be available in the river when river flows are substantial if extractions for dairy cattle were ceased, however when river flows are low (e.g. in drought) and water is more critical to the health of the system, it is likely that there would not be an increase in water available to the environment. This is because of the rebound effect (i.e. water that becomes available due to efficiency measures is consumed by other uses) that has been widely demonstrated to occur (Berbel et al. 2015; Loch and Adamson 2015; Song et al. 2018; Wheeler et al. 2020). The key conclusion from this is that it is not the choice of a product or commodity that determines the amount of water that is available to the environment but rather the policies determining water extractions. Results also suggest that at a global scale, water scarcity impacts would be reduced by 1962 GL H2O-e, however whether water scarcity would actually decline would depend on the policies that govern water extractions in regions where production was avoided, as discussed in more detail by Simmons et al. (2022).
Other water-related impacts associated with changes to production were not included in the present study due to difficulties in quantifying them. For example, converting pastures to cropland for soybean production would reduce water quality because sediment runoff is greater on cropland (Zhang et al. 2021b) and revegetating areas could increase rainfall interception and reduce inflows into streams (Khorchani et al. 2021) thereby reducing water available to the environment. Issues such as this should be a focus of future research that assess the water consequences of changes to production systems in response to changes in consumer demand.
The use of agricultural land to produce food is also of critical importance because agricultural land is constrained at a global scale, so increasing demand for agricultural land will result in the transformation of natural land with subsequent impacts, especially GHG emissions. In this study, replacing NSW dairy production with soy- and plant-based alternatives reduced demand for global agricultural land by 142 kha. It is common for global production to play a critical role in food security, with research suggesting that less than one-third of the global population can exist on locally supplied food (Kinnunen et al. 2020); so where additional demand for cropland is required to meet food demand it is imperative that the climate change impacts of land use change (LUC) are considered (Brandão et al. 2021). In our study, additional land was required for global soybean production, vegetable oil and protein meal. However, the reduction in feed for dairy cattle and the additional wheat grown in rotation with soybeans was greater than the land required for soybeans, vegetable oil and protein meal; resulting in a net decrease in demand. The GHG emissions associated with these changes are included in our results embedded in the climate change impacts of global commodities (Fig. S5). Avoiding displacement of production to global marginal production, and the climate change impacts of LUC associated with this, could not have been avoided by assuming that soybeans, vegetable oil and meal were grown on existing crop land in other parts of Australia. Utilising existing cropland in Australia would result in the displacement of crops that would have been grown where soybean, vegetable oil and protein meal were now being grown (Smith et al. 2019; Simmons et al. 2020) and still result in LUC impacts that would need to be considered.
Results were clearly sensitive to parameters that had an impact on soybean production (Table 2); however, we are confident in the robustness of estimates of yields and proportion of land arable per farm. Further, the results were not sensitive enough to change the conclusion that, as things currently stand, replacing dairy and dairy co-products with plant-based alternatives would provide climate change mitigation. It would be useful to re-do this analysis to reflect improvements in production technologies and the implementation of climate change mitigation strategies over time and integrate improvements in information relating to LUC in response to demand for agricultural land. The process used here to assess consequences can also be used at larger spatial scales where displacement of cropland can be better informed to develop optimal outcomes.
The present study has focused on the impacts of a change in demand for dairy products on two key physical constraints (i.e. land and water), however it should be noted that ceasing dairy production may have socio-economic impacts. For example, the economic viability of crop production systems may differ to dairy production, affecting the local communities that rely on dairy farms for economic stability. Further, care would be required when replacing dairy products and co-products with plant-based alternatives in societies that are conditioned to rely on these products in their diets to meet daily nutrition requirements. Impacts such as these should be considered in conjunction with environmental impacts when making policies and choices regarding dietary changes.
Conclusions
Attributional approaches that do not consider the market-mediated impacts of demand changes remain the metric of choice to inform decisions (Manfredi et al. 2012; Sustainable Apparel Coalition 2016) despite a growing body of evidence that the consequences of change in demand are not supported by these approaches (Trostle 2010; Abdul-Manan 2017; White and Hall 2017; Smith et al. 2019; Wiedemann et al. 2019; Simmons et al. 2020; Khan et al. 2021; Nguyen et al. 2021). Using NSW dairy production as a case study, we demonstrated that, under current production methods, replacing NSW dairy production with plant-based alternatives would be an effective climate change mitigation strategy. However, large-scale implementation of GHG emissions reduction strategies by the NSW dairy industry may mean that a shift to soy-based products would increase GHG emissions. As climate change mitigation strategies are implemented across agricultural industries to meet emissions reductions targets, decisions on dietary choices need to assess the consequences of changes to production systems and not rely on results from attributional studies. This study has also demonstrated that products consumers choose may not determine the volume of water that is made available to the environment. Rather, the health of rivers, streams and lakes are more likely to be determined by policies that govern water extractions. More work is also required to assess other environmental consequences (e.g. eutrophication, resource depletion) of a shift to plant-based alternatives from dairy to provide a more comprehensive understanding of trade-offs of these shifts in consumer preferences.
Data availability
Inventory used in the study can be obtained in SimaPro format by contacting the corresponding author of this publication. A paid licence for ecoinvent will be required to use the inventory because ecoinvent background inventory has been used. This work is a later version of the preprint available at https://doi.org/10.21203/rs.3.rs-1247974/v1.
References
Abdul-Manan AFN (2017) Lifecycle GHG emissions of palm biodiesel: unintended market effects negate direct benefits of the Malaysian Economic Transformation Plan (ETP). Energy Policy 104, 56-65.
| Crossref | Google Scholar |
Australian Government (2020) Requirements for using the Full Carbon Accounting Model (FullCAM) in the Emissions Reduction Fund (ERF) methodology determination: carbon credits (carbon farming initiative – human induced regeneration of a permanent even aged native forest – 1.1) methodology determination variation 2013. Australian Government, Canberra, ACT, Australia.
Badgery WB, Simmons AT, Murphy BM, Rawson A, Andersson KO, Lonergan VE, van de Ven R (2013) Relationship between environmental and land-use variables on soil carbon levels at the regional scale in central New South Wales, Australia. Soil Research 51, 645-656.
| Crossref | Google Scholar |
Badgery W, Li G, Simmons A, Wood J, Smith R, Peck D, Ingram L, Durmic Z, Cowie A, Humphries A, Hutton P, Winslow E, Vercoe P, Eckard R (2023) Reducing enteric methane of ruminants in Australian grazing systems – a review of the role for temperate legumes and herbs. Crop & Pasture Science 74, 661-679.
| Crossref | Google Scholar |
Berbel J, Gutiérrez-Martín C, Rodríguez-Díaz JA, Camacho E, Montesinos P (2015) Literature review on rebound effect of water saving measures and analysis of a Spanish case study. Water Resources Management 29, 663-678.
| Crossref | Google Scholar |
Boulay A-M, Bare J, Benini L, Berger M, Lathuillière MJ, Manzardo A, Margni M, Motoshita M, Núñez M, Pastor AV, Ridoutt B, Oki T, Worbe S, Pfister S (2018) The WULCA consensus characterization model for water scarcity footprints: assessing impacts of water consumption based on available water remaining (AWARE). The International Journal of Life Cycle Assessment 23, 368-378.
| Crossref | Google Scholar |
Brandão M, Azzi E, Novaes RML, Cowie A (2021) The modelling approach determines the carbon footprint of biofuels: the role of LCA in informing decision makers in government and industry. Cleaner Environmental Systems 2, 100027.
| Crossref | Google Scholar |
Coluccia B, Agnusdei GP, De Leo F, Vecchio Y, La Fata CM, Miglietta PP (2022) Assessing the carbon footprint across the supply chain: cow milk vs soy drink. Science of The Total Environment 806, 151200.
| Crossref | Google Scholar | PubMed |
Dairy Australia (2020a) Australian dairy industry sustainability report 2020. Available at https://cdn-prod.dairyaustralia.com.au/-/media/dairy/files/sustainability/australian-dairy-sustainability-framework/2020-sustainability-report.pdf?
Eckard RJ (2020) A Greenhouse Accounting Framework for Dairy properties (D-GAF) based on the Australian National Greenhouse Gas Inventory methodology. Available at http://www.greenhouse.unimelb.edu.au/Tools.htm
Ercin AE, Aldaya MM, Hoekstra AY (2012) The water footprint of soy milk and soy burger and equivalent animal products. Ecological Indicators 18, 392-402.
| Crossref | Google Scholar |
Forster P, Storelvmo T, Armour K, Collins W, Dufresne JL, Frame D, Lunt D, Mauritsen T, Palmer M, Watanabe M, Wild M (2021) The Earth’s energy budget, climate feedbacks, and climate sensitivity. In ‘Climate change 2021: the physical science basis. Contribution of working group I to the sixth assessment report of the intergovernmental panel on climate change’. (Eds V Masson-Delmotte, P Zhai, A Pirani, SL Connors, C Péan, S Berger, N Caud, Y Chen, L Goldfarb, MI Gomis, M Huang, K Leitzell, E Lonnoy, JBR Matthews, TK Maycock, T Waterfield, O Yelekçi, R Yu, B Zhou) pp. 923–1054. (Cambridge University Press: Cambridge, UK). doi:10.1017/9781009157896.009
Garcia F, Muñoz C, Martínez-Ferrer J, Urrutia NL, Martínez ED, Saldivia M, Immig I, Kindermann M, Walker N, Ungerfeld EM (2022) 3-Nitrooxypropanol substantially decreased enteric methane emissions of dairy cows fed true protein- or urea-containing diets. Heliyon 8, e09738.
| Crossref | Google Scholar | PubMed |
Gollnow S, Lundie S, Moore AD, McLaren J, van Buuren N, Stahle P, Christie K, Thylmann D, Rehl T (2014) Carbon footprint of milk production from dairy cows in Australia. International Dairy Journal 37, 31-38.
| Crossref | Google Scholar |
Henriksson M, Flysjö A, Cederberg C, Swensson C (2011) Variation in carbon footprint of milk due to management differences between Swedish dairy farms. Animal 5(9), 1474-1484.
| Crossref | Google Scholar |
JBS (2021) JBS and DSM partner to substantially reduce methane emissions in beef. Available at https://mediaroom.jbs.com.br/noticia/jbs-and-dsm-partner-to-substantially-reduce-methane-emissions-in-beef
Khan MMH, Deviatkin I, Havukainen J, Horttanainen M (2021) Environmental impacts of wooden, plastic, and wood-polymer composite pallet: a life cycle assessment approach. The International Journal of Life Cycle Assessment 26, 1607-1622.
| Crossref | Google Scholar |
Khorchani M, Nadal-Romero E, Lasanta T, Tague C (2021) Natural revegetation and afforestation in abandoned cropland areas: hydrological trends and changes in Mediterranean mountains. Hydrological Processes 35, e14191.
| Crossref | Google Scholar |
Kinnunen P, Guillaume JHA, Taka M, D’odorico P, Siebert S, Puma MJ, Jalava M, Kummu M (2020) Local food crop production can fulfil demand for less than one-third of the population. Nature Food 1, 229-237.
| Crossref | Google Scholar |
Kovacs B, Miller L, Heller MC, Rose D (2021) The carbon footprint of dietary guidelines around the world: a seven country modeling study. Nutrition Journal 20, 15.
| Crossref | Google Scholar | PubMed |
Latimer C (2019) Moxey biodigester to power whole farm. FarmOnline National. Available at https://www.farmonline.com.au/story/6228869/moxey-biodigester-to-power-whole-farm/
Li B, Qiao M, Lu F (2012) Composition, nutrition, and utilization of okara (soybean residue). Food Reviews International 28, 231-252.
| Crossref | Google Scholar |
Loch A, Adamson D (2015) Drought and the rebound effect: a Murray–Darling Basin example. Natural Hazards 79, 1429-1449.
| Crossref | Google Scholar |
Longmire A, Taylor C, Pearson CJ (2015) An open-access method for targeting revegetation based on potential for emissions reduction, carbon sequestration and opportunity cost. Land Use Policy 42, 578-585.
| Crossref | Google Scholar |
Marinova D, Bogueva D (2020) Which ‘milk’ is best for the environment? We compared dairy, nut, soy, hemp and grain milks. The Conversation, 14 October 2020. Available at https://theconversation.com/which-milk-is-best-for-the-environment-we-compared-dairy-nut-soy-hemp-and-grain-milks-147660
Nguyen QV, Wiedemann SG, Simmons A, Clarke SJ (2021) The environmental consequences of a change in Australian cotton lint production. The International Journal of Life Cycle Assessment 26, 2321-2338.
| Crossref | Google Scholar |
O’Brien D, Capper JL, Garnsworthy PC, Grainger C, Shalloo L (2014) A case study of the carbon footprint of milk from high-performing confinement and grass-based dairy farms. Journal of Dairy Science 97, 1835-1851.
| Crossref | Google Scholar | PubMed |
Palhares JCP, Pezzopane JRM (2015) Water footprint accounting and scarcity indicators of conventional and organic dairy production systems. Journal of Cleaner Production 93, 299-307.
| Crossref | Google Scholar |
Perry C (2014) Water footprints: path to enlightenment, or false trail? Agricultural Water Management 134, 119-125.
| Crossref | Google Scholar |
Pitta DW, Indugu N, Melgar A, Hristov A, Challa K, Vecchiarelli B, Hennessy M, Narayan K, Duval S, Kindermann M, Walker N (2022) The effect of 3-nitrooxypropanol, a potent methane inhibitor, on ruminal microbial gene expression profiles in dairy cows. Microbiome 10, 146.
| Crossref | Google Scholar |
Plevin RJ, Delucchi MA, Creutzig F (2013) Using attributional life cycle assessment to estimate climate-change mitigation benefits misleads policy makers. Journal of Industrial Ecology 18, 73-83.
| Crossref | Google Scholar |
Poore J, Nemecek T (2018) Reducing food’s environmental impacts through producers and consumers. Science 360, 987-992.
| Crossref | Google Scholar | PubMed |
Rahman MM, Mat K, Ishigaki G, Akashi R (2021) A review of okara (soybean curd residue) utilization as animal feed: nutritive value and animal performance aspects. Animal Science Journal 92, e13594.
| Crossref | Google Scholar | PubMed |
Ridoutt BG, Williams SRO, Baud S, Fraval S, Marks N (2010) The water footprint of dairy products: case study involving skim milk powder. Journal of Dairy Science 93, 5114-5117.
| Crossref | Google Scholar | PubMed |
Ridoutt BG, Baird D, Hendrie GA (2021) The role of dairy foods in lower greenhouse gas emission and higher diet quality dietary patterns. European Journal of Nutrition 60, 275-285.
| Crossref | Google Scholar | PubMed |
Roque BM, Salwen JK, Kinley R, Kebreab E (2019) Inclusion of Asparagopsis armata in lactating dairy cows’ diet reduces enteric methane emission by over 50 percent. Journal of Cleaner Production 234, 132-138.
| Crossref | Google Scholar |
Simmons AT, Murray A, Brock PM, Grant T, Cowie AL, Eady S, Sharma B (2019) Life cycle inventories for the Australian grains sector. Crop & Pasture Science 70, 575-584.
| Crossref | Google Scholar |
Simmons AT, Cowie AL, Brock PM (2020) Climate change mitigation for Australian wheat production. Science of The Total Environment 725, 138260.
| Crossref | Google Scholar |
Simmons AT, Perovic DJ, Roth G (2022) Making waves – are water scarcity footprints of irrigated agricultural commodities suitable to inform consumer decisions? Agricultural Water Management 268, 107689.
| Crossref | Google Scholar |
Smith LG, Kirk GJD, Jones PJ, Williams AG (2019) The greenhouse gas impacts of converting food production in England and Wales to organic methods. Nature Communications 10, 4641.
| Crossref | Google Scholar | PubMed |
Song J, Guo Y, Wu P, Sun S (2018) The agricultural water rebound effect in China. Ecological Economics 146, 497-506.
| Crossref | Google Scholar |
Vasilaki V, Katsou E, Ponsá S, Colón J (2016) Water and carbon footprint of selected dairy products: a case study in Catalonia. Journal of Cleaner Production 139, 504-516.
| Crossref | Google Scholar |
Vendl C, Clauss M, Stewart M, Leggett K, Hummel J, Kreuzer M, Munn A (2015) Decreasing methane yield with increasing food intake keeps daily methane emissions constant in two foregut fermenting marsupials, the western grey kangaroo and red kangaroo. Journal of Experimental Biology 218, 3425-3434.
| Crossref | Google Scholar | PubMed |
Vergé XPC, Maxime D, Dyer JA, Desjardins RL, Arcand Y, Vanderzaag A (2013) Carbon footprint of Canadian dairy products: calculations and issues. Journal of Dairy Science 96, 6091-6104.
| Crossref | Google Scholar | PubMed |
Weidema BP, Bauer C, Hischier R, Mutel C, Nemecek T, Reinhard J, Vadenbo C, Wernet G (2013) The ecoinvent database: overview and methodology. Data quality guideline for the ecoinvent database version 3. (The ecoinvent Centre: St Gallen, Switzerland). Available at http://www.ecoinvent.org [Accessed 21 September 2015]
Wheeler SA, Carmody E, Grafton RQ, Kingsford RT, Zuo A (2020) The rebound effect on water extraction from subsidising irrigation infrastructure in Australia. Resources, Conservation and Recycling 159, 104755.
| Crossref | Google Scholar |
White RR, Hall MB (2017) Nutritional and greenhouse gas impacts of removing animals from US agriculture. Proceedings of the National Academy of Sciences 114, E10301-E10308.
| Crossref | Google Scholar |
Wiedemann SG, Simmons A, Watson KJL, Biggs L (2019) Effect of methodological choice on the estimated impacts of wool production and the significance for LCA-based rating systems. The International Journal of Life Cycle Assessment 24, 848-855.
| Crossref | Google Scholar |
Zehetmeier M, Gandorfer M, Heibenhuber A, de Boer IJM (2012) Modelling GHG emissions of dairy cow production systems differing in milk yield and breed – the impact of uncertainty. In ‘8th International Conference on Life Cycle Assessment in the Agri-Food Sector (LCA Food 2012), 1–4 October 2012, Saint Malo, France. (INRA)
Zhang X, Chen X, Xu Y, Yang J, Du L, Li K, Zhou Y (2021a) Milk consumption and multiple health outcomes: umbrella review of systematic reviews and meta-analyses in humans. Nutrition & Metabolism 18, 7.
| Crossref | Google Scholar | PubMed |
Zhang X, Lark TJ, Clark CM, Yuan Y, LeDuc SD (2021b) Grassland-to-cropland conversion increased soil, nutrient, and carbon losses in the US Midwest between 2008 and 2016. Environmental Research Letters 16, 054018.
| Crossref | Google Scholar |
Zhang Y, Wang W, Yao H (2023) Urea-based nitrogen fertilization in agriculture: a key source of N2O emissions and recent development in mitigating strategies. Archives of Agronomy and Soil Science 69, 663-678.
| Crossref | Google Scholar |