

The mechanisms behind the contrasting responses to waterlogging in black-grass (Alopecurus myosuroides) and wheat (Triticum aestivum)
Christian Harrison A , Clarice Noleto-Dias B , Gianluca Ruvo B , David J. Hughes C , Daniel P. Smith C , Andrew Mead C , Jane L. Ward B , Sigrid Heuer D and Dana R. MacGregor A *
A
B
C
D
Abstract
Black-grass (Alopecurus myosuroides) is one of the most problematic agricultural weeds of Western Europe, causing significant yield losses in winter wheat (Triticum aestivum) and other crops through competition for space and resources. Previous studies link black-grass patches to water-retaining soils, yet its specific adaptations to these conditions remain unclear. We designed pot-based waterlogging experiments to compare 13 biotypes of black-grass and six cultivars of wheat. These showed that wheat roots induced aerenchyma when waterlogged whereas aerenchyma-like structures were constitutively present in black-grass. Aerial biomass of waterlogged wheat was smaller, whereas waterlogged black-grass was similar or larger. Variability in waterlogging responses within and between these species was correlated with transcriptomic and metabolomic changes in leaves of control or waterlogged plants. In wheat, transcripts associated with regulation and utilisation of phosphate compounds were upregulated and sugars and amino acids concentrations were increased. Black-grass biotypes showed limited molecular responses to waterlogging. Some black-grass amino acids were decreased and one transcript commonly upregulated was previously identified in screens for genes underpinning metabolism-based resistance to herbicides. Our findings provide insights into the different waterlogging tolerances of these species and may help to explain the previously observed patchiness of this weed’s distribution in wheat fields.
Keywords: aerenchyma, black-grass, metabolism-based herbicide resistance, metabolomics, OPR1, transcriptomics, waterlogging tolerance, wheat.
Introduction
As photosynthetic organisms, plants need a balance of water, oxygen and carbon dioxide to survive. In poorly draining fields, soils can become water saturated, especially after heavy rainfall. When this happens, the excess water fills up the spaces between soil particles, leaving little or no room for air. Plants growing in waterlogged soils experience hypoxia as their roots are no longer able to efficiently exchange gases. Reviewed in Loreti and Perata (2020), hypoxia hinders the plant’s ability to carry out aerobic respiration, affecting its metabolic processes and overall growth. Waterlogging is one of the main abiotic stresses that plants currently endure and climate change models predict that by 2080, global crop yield penalties caused by waterlogging stress will increase from 3–11% to 10–20% annually (Liu et al. 2023). A better understanding of plant responses to waterlogging stress could reduce current yield penalties and enhance resilience to climate change.
Some plants have the ability to adapt to waterlogging using structural and functional adaptations. Structural adaptations that allow plants to cope with hypoxic conditions include the formation of aerenchyma, which help facilitate oxygen uptake in low-oxygen or hypoxic environments (Loreti and Perata 2020; Pan et al. 2021). Aerenchyma are air-filled pores within existing roots, which serve as pathways for oxygen to move from non-waterlogged parts of the plant to the root system, and eliminate carbon dioxide and other harmful gases that build up in waterlogged tissues. Aerenchyma therefore play a crucial role in gas exchange within the plant and in maintaining normal cell functioning in waterlogged roots, allowing plants to continue growth and development. Functional adaptations are driven by changes in the transcriptome, proteome and metabolome of the plant in response to waterlogging. To tolerate and adapt to waterlogging stress, plants alter the production, perception or movement of hormones including ethylene, abscisic acid (ABA), auxin, gibberellin, salicylic acid, jasmonic acid (JA), brassinosteroids and melatonin; these are nicely reviewed in Pan et al. (2021).
Black-grass (Alopecurus myosuroides) is the UK’s most costly and problematic weed (Varah et al. 2020). This diploid, allogamous grass has moved from its native range in the Mediterranean and Western Asia to much of Western Europe, where it is now found almost exclusively on arable land (Naylor 1972). Surveys of English black-grass populations showed that most were resistant to multiple herbicides and that a combination of target site and metabolism-based resistances were used to survive herbicide treatments (Hicks et al. 2018; Comont et al. 2020). Analysis of pedigreed seed families from nine field-collected populations of black-grass showed that herbicide resistance was strongly heritable, as were various flowering or reproductive traits, such as the timing of flowering and subsequent seed filling and shedding (Comont et al. 2022). These analyses suggest that different populations of black-grass can inherit locally advantageous traits that help them circumvent various weed control methods including herbicide application. Despite this, there was no evidence for genetic correlations between herbicide resistance and these flowering or reproductive traits, indicating herbicide resistance in black-grass does not come with fitness costs (Comont et al. 2022). Other authors have put forward the idea that stress tolerance and herbicide resistance are functionally linked (Radchenko et al. 2021; Mohammad et al. 2022). This hypothesis is supported by evidence that the efficacy of herbicides is altered if they are applied under conditions of drought stress (Radchenko et al. 2021), and that experiencing maternal drought increases the probability that subsequent offspring will evolve heritable herbicide resistance (Mohammad et al. 2022). Altogether, these and other data reviewed elsewhere (Torra et al. 2021; Torra and Alcántara-de la Cruz 2022) demonstrate that although herbicide resistances are important in determining which weeds become insidious, additional heritable traits influence which plants become problematic agricultural weeds; and the data suggest there is a mechanistic link between tolerance to abiotic stresses and the capacity to adapt anthropogenic weed control methods.
Field studies demonstrate that black-grass can form high-density patches in winter wheat fields, especially on heavy soil prone to waterlogging (Metcalfe et al. 2018). We suspect this occurs because black-grass can endure waterlogging better than wheat and therefore has the capacity to occupy this wet niche. To test this, we set out to quantitatively compare the ability of British black-grass and cultivated wheat to tolerate waterlogging conditions. We compared physical, transcriptomic and metabolic traits to better understand what underpinned tolerance/intolerance. We developed a glasshouse-based experimental protocol that robustly recapitulated waterlogged conditions and generated the phenotypes expected from field observations (Metcalfe et al. 2018) and reported in the literature (Herzog et al. 2018; Sundgren et al. 2018). The generated data showed that black-grass tolerates waterlogging better than wheat and that there is genetic variation within and between populations for tolerance. We evidenced aerenchyma formation in black-grass in waterlogged as well as control conditions. Paired omics analysis of leaf tissue from two cultivars/biotypes grown under waterlogging or control conditions revealed that these two species exhibit very different molecular responses.
Materials and methods
Plant material, growth and treatments
Max Herzog at Copenhagen University provided wheat (Triticum aestivum L.) seed. Four spring wheat cultivars were supplied. The waterlogging tolerance of these had been assessed using analysis of above-ground traits that were clearly affected by the treatment and could be quantified by visual scoring or simple measures under field conditions. Field conditions were such that irrigation of plastic-reinforced levees led to water that was just above the soil surface for the duration of the treatment. Quarna and Naxos were recorded as intolerant and Bjarne and Zebra as tolerant (Sundgren et al. 2018). Two winter wheat cultivars were supplied. For these, submergence tolerance had been assessed based on differences in dry weight after submergence within glass aquariums filled with submergence solution. Frument was recorded as intolerant and Jackson as tolerant (Herzog et al. 2018). Jackson has also been shown to be waterlogging tolerant and hypoxia tolerant in response to exposure to hypoxic nutrient solution (Huang and Johnson 1995; Huang et al. 1997). Unpublished data using pot experiments reported in Herzog et al. (2018) characterised Frument as waterlogging intolerant. We used germplasm from populations gathered in 2014 as part of the Black-Grass Resistance Initiative project (BGRI 2019), choosing 10 field-collected black-grass (Alopecurus myosuroides Huds.) biotypes, nine of which were characterised for their life-history and resistance traits (Comont et al. 2022) (Lola8, Lola19, Lola23, Lola45, Lola59, Lola91, Lola103, Lola108 and Lola123), plus an additional population (Lola81) that was sensitive to the herbicides tested against it (Comont et al. 2020). A percentage of plants within these the field-collected populations carry target site mutations in ACETOLACTATE SYNTHASE (ALS) and/or ACETYL-COA-CARBOXYLASE (ACCase) and they also exhibit metabolism-based resistance (Comont et al. 2020). Three additional black-grass populations that had been selected in the laboratory to exhibit characteristic herbicide patterns of sensitive, target site resistance or metabolism-based resistance were also included. Their purification and selection are described in Mellado-Sánchez et al. (2020). In summary, a black-grass population designated Roth was produced from progenitors collected from the section of the Rothamsted Research Long-Term Experiment that has never received herbicides (Moss et al. 2004). The germplasm used here was from seeds generated from clonally propagated siblings of plants that were sensitive to all herbicide treatments. Roth is also the population from which the genome sequence was generated (Cai et al. 2023). Notts is a population collected from near Nottingham (Moss et al. 2003). The germplasm used here was selected to have herbicide resistance conferred only by target site mutations in acetyl coenzyme A carboxylase (ACCase). The Peldon population has been used in many publications (e.g. Cummins et al. 1997). The germplasm used here was selected to have no known target site mutations and to exhibit resistance to ACCase-inhibiting herbicides through metabolism-based resistance mechanisms.
Seedlings were germinated on three layers of Whatman Filter paper watered with 2 g/L KNO3 inside sealed Petri dishes. These were incubated under 16/8 h of light/dark conditions at 22°C for 7 days for black-grass, or 3 days for wheat. Evenly germinated seedlings were transplanted to square 9 × 9 × 14 cm freestanding pots filled with bespoke field-replicating soil (80% sterilised screened loam, 20% grit (3–6 mm screened, lime free), 2.0 kg Osmocote Exact 5–6 month per m3), which had been coarse sieved using a 4-mm aperture sieve to remove any large stones and improve both uniformity and compaction. The top 4 cm between the soil surface and rim of pots were left open for sand-topping treatment (see below). For biomass measurements, four germinated seedlings were transplanted 1–2 cm away from each of the four corners of each pot. Samples taken for paired omics experiments had only one plant per pot and were planted in the middle of the pot. Pots were placed in a heated glasshouse maintained at a minimum set temperature of 18°C both day and night. The average temperature for the replicate sampled for transcriptomics and metabolomics was 19.8 ± 1.5°C (Trial ST10, Supplementary Table S1). Supplementary lighting was set to come on from 05:00 hours to 21:00 hours, but only when the radiation fell below 175 w/m2. This regime ensured lighting for 16-h day lengths. Seedlings were allowed to recover for 4–6 days after transplanting, with normal levels of watering and freely draining pots. To prevent contaminating algal growth, 100 g of autoclaved sand was poured around the established seedlings and then smoothed to create a level surface. Plants were arranged using a Randomised Complete Block Design (RCBD) layout. Pots for waterlogging treatments were placed into clear heavy-duty, 125 micron polythene bags (Polybags Limited, Greenford, Middlesex, UK). These bags extended above the top of the pot to ensure that full saturation of the soil could be obtained, and rubber bands and heavy-duty duct tape were used to ensure good fit and no leaks. Control pots were left without bags so that the water could drain out naturally. All the pots were watered normally for control treatment, whereas the soil was fully saturated and water visible at the top of the sand for up to 21 days for the waterlogging treatment. Qualitative and quantitative measurements were taken regularly throughout the duration of the treatments. The protocol was optimised to compare growth rates and extent between the species rather than among them. We therefore imposed waterlogging stress that statistically repressed growth of all the wheat accessions but still maintained the relative rankings of intolerance/tolerance from Sundgren et al. (2018) or Herzog et al. (2018) (Figs 1a and S1).
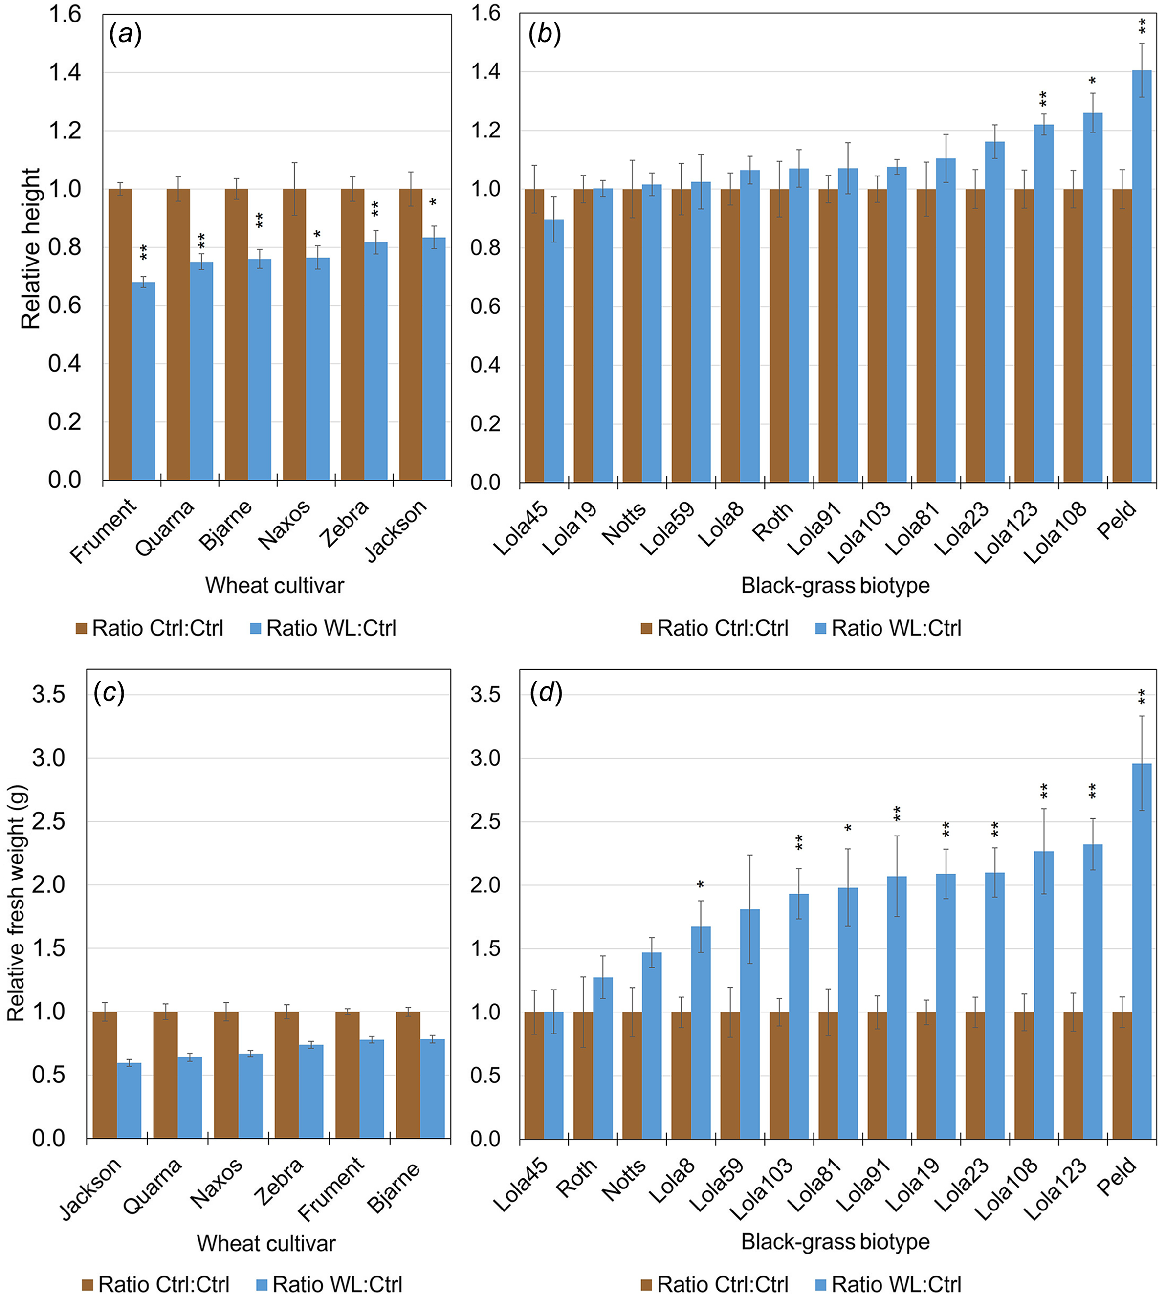
Relative heights (a, b) or fresh weight measures (c, d) of wheat (a, c) or black-grass (b, d) shows that compared to control (brown), waterlogging (blue) inhibited wheat growth, whereas the growth of black-grass was equal or better. Bars represent averages of relative values for 12 individual plants ± s.e. * indicates that a heteroscedastic, two-tailed distribution Student’s t-test gave P < 0.05 between unnormalised control samples compared to unnormalised waterlogged samples and ** indicates P < 0.01.
Aerial tissue biomass measurements and sampling
Because not all biotypes/cultivars could be tested simultaneously, the experiment was repeated eight times (Table S1). Each biotype/cultivar was included in at least one and up to five experiments. At each measured time point, length of the longest leaf was recorded to the nearest mm by measuring from the top of the soil to the tip of the leaf using a ruler with a flat base to ensure it did not insert into the soil. A representative dataset is shown in Fig. S1. Samples were taken for analysis of RNA or metabolomics 1 day before taking fresh weight measurements, and were immediately frozen in liquid nitrogen. For samples taken for RNA, the youngest leaves were taken starting from the leaf tip until 100–300 mg material was obtained. At the end of the experiment, total fresh weight of the aerial tissue was recorded, clipping all material just above the top of the soil. A representative dataset is shown in Fig. 1. To account for large natural height or weight differences between black-grass and wheat plants of the same age, data were normalised by dividing each value by the average of the respective non-waterlogged control.
A combined analysis of the plant fresh weight data from the set of waterlogging trials (ST1, ST3, ST4, ST5, ST6, ST8, ST9) was conducted by fitting a linear mixed model (LMM) using the REML (Restricted Maximum Likelihood) algorithm (Fig. S2). Data were omitted from block F for ST9 as it was not complete. A total of 13 black-grass lines and six wheat lines were included across the set of experiments, with each experiment including replicate plots for both the waterlogging and control treatments of each included line. All plots nominally included four plants, though there were approximately 30 plants missing at random across the set of trials. Replication levels varied significantly between lines, with some lines only included in one of the experiments and others included in multiple trials. There were a minimum of three replicate plots for each treatment with a maximum replication of 19 plots for each treatment – a total of 294 plots were included across the trials. The random component of the linear mixed model allowed for variation between experiments, between trays within experiments, between plots within trays, and between plants within plots, though the variation in this last stratum did not impact on the comparison of lines and treatments, as the four plants within a plot all received the same combination of line and treatment. In general, trays within experiments did not contain a full replicate of the set of line-by-treatment combinations included in each experiment, so that the effects of lines and treatments were non-orthogonal to differences between trays, as well as to differences between experiments, thus requiring the fitting of a linear mixed model. The fixed component of the linear mixed model considered the effects of line, of treatment, and of the interaction between these two factors. The full outcomes of these analyses are shown in Fig. S2. Fresh weights for the wheat lines were generally larger than those for the black-grass lines, and to cope with the anticipated (and observed) heterogeneity in the responses, fresh weights were natural log-transformed prior to analysis. In addition to coping with the heterogeneity of the responses, this has the advantage for the interpretation of the analysis that the difference between the waterlogged and control treatment means on this transformed scale is directly related to the ratio of the treatment means on the observed fresh weight scale (‘Control’, ‘Waterlogged’ and ‘Difference (W – C)’ columns in Fig. S2). A negative difference (ratio < 1.00) shows the fresh weight was reduced in the waterlogged treatment compared to the control, whereas a positive difference (ratio > 1.00) indicates the fresh weight was increased in waterlogging relative to the control. A two-sided t-test of the difference for each line was calculated (Column ‘Prob’ in Fig. S2) to identify those lines showing a significant treatment effect (in either direction), and 95% confidence limits calculated on the log-transformed scale (‘Lower CL’ and ‘Upper CL’ in Fig. S2), and then back-transformed to provide a confidence interval for the treatment ratio (‘Lower CL bt’ and ‘Upper CL bt’ in Fig. S2). In summary, all wheat lines had a relative measure of waterlogging that is less than 1.00 and negative values for Difference (W – C), whereas black-grass relative measures were greater than 1.00 and positive differences (Fig. S2).
Aerenchyma induction and assessment by microscopy in wheat and black-grass using Hoagland’s solution
Seeds of each biotype/cultivar were germinated as described above and seedlings were transplanted, one plant per pot, into 6.5 × 6.5 × 6.3 cm or 9 × 9 × 10 cm pots containing vermiculite soaked in water filled to within 1 cm of the top of the pot. Pots on trays were placed into a glasshouse at 20°C with 16-h daylength and watered twice weekly with approximately 30–50 mL of 0.25% Hoagland’s No. 2 Basal Salt Mixture (Melfords H2395) per pot. Four biological replicates were grown for each line for both the control and waterlogging treatment. Plants were arranged using a Randomised Complete Block Design. Approximately 3–4 weeks after transplanting, the waterlogging pots were placed into a small plastic bag that extended above the rim of the pot by at least 6 cm and another pot was put over the outside to hold the bag in place. The bag was filled with 0.25% Hoagland’s solution to 2 cm above the surface of the vermiculite. This protocol was kindly provided by Orla Sherwood of University College, Dublin. After 7 days of flooding, roots were washed and stored overnight in 15 mL Falcon tubes at 4°C. Three biological replicate root systems from each biotype/cultivar were fixed with FAA (50 mL ethyl alcohol (100%), 5 mL glacial acetic acid, 10 mL formaldehyde (37–40%), 35 mL distilled water) in small glass vials for 24 h at room temperature on a rotator to ensure complete contact between the fixative and the samples. Samples were then washed in distilled water at least three times before microscopy and stored at 4°C until imaged as described below. Individual fixed roots were separated and placed length-wise into a microcentrifuge tube and covered with warm 5% agar. Once set, a double-edged razor blade was used to cut thin cross-sections of root and agar and these discs were placed into a well in a 12-well plate filled with water. To stain, water was removed from the well using a Pasteur pipette. Evans blue stain (0.25%) was added to the root sections and left for 20–30 min. The staining solution was then removed and sections rinsed twice with distilled water before they were lifted onto a glass slide using forceps. Samples were kept immersed in water until imaging. Excess liquid was removed, before imaging using a Leica M205 FA stereomicroscope. The quantification of aerenchyma was based on qualitative assessment of the individual root slices, where each was categorised as Unable to determine, No aerenchyma, Aerenchyma-like structures, or Clear aerenchyma. Between 7 and 16 different root sections were analysed by microscopy for each cultivar or biotype and condition.
Omics sampling
To assess whole-plant responses to water logging, leaf tissue was analysed. Five biological replicates, with one plant per pot, were used to generate samples for paired transcriptomic and metabolomic analysis. Sampling occurred from 11:00 hours to 12:30 hours (therefore at ZT6 to ZT7.5) at 21 days after start of the waterlogging treatment from plants grown in ST10. A sample of 200–300 mg fresh leaf tissue from the three youngest leaves, including the tip, was taken for transcriptomic analysis and the remainder of the aerial tissue harvested for metabolomics. All fresh leaf material was immediately frozen in liquid nitrogen in Falcon tubes or clip-top 2-mL microcentrifuge tubes and stored at −80°C until processing. Fig. S3 shows a pictorial illustration of this process.
For the metabolomic analysis, wheat and black-grass leaf samples were analysed together throughout the sampling, processing and analysis. For metabolomics, tissue was lyophilised (4 days) and then milled to a fine power using a pestle and mortar. Milled tissue was stored at −80°C until analysis. For nuclear magnetic resonance (NMR) analysis, 10 mg of milled freeze-dried plant material was suspended in 1 mL D2O:CD3OD (deuterated water and trideuterio(deuteriooxy)methane, 80:20 v/v) containing 0.01% w/v d4-TSP (deuterated trimethylsilylpropanoic acid) as a reference standard. For ultra-high performance liquid chromatography and mass spectrometry (UHPLC-MS), 5 mg was suspended in 0.5 mL H2O:CH3OH (80:20 v/v). The extracts were vortexed vigorously, heated to 50°C in a water bath (10 min) and then centrifuged at 16,100g (10 min). The supernatant was transferred to a clean tube prior to heating to 90°C (2 min) followed by cooling to 4°C (30 min). Samples were centrifuged (10 min) at 16,100g. For UHPLC-MS analysis, the supernatant was transferred to a clean 2 mL glass autosampler vial. For 1H-NMR analysis, 20 μL of phosphate buffer solution (3M KH2PO4/K2HPO4 in D2O pH 7.4) and 10 μL of Na2-EDTA (32 mM in D2O) were added to the supernatant. Samples were centrifuged (5 min) at 16,100g and the supernatant was transferred to a 5 mm NMR tube.
High resolution LC-MS data were recorded with an Dionex UltiMate 3000 RS UHPLC system, equipped with a DAD-3000 photodiode array detector, coupled to an LTQ-Orbitrap Elite mass spectrometer (Thermo Fisher Scientific, Germany). UHPLC separation was achieved via the use of a reversed-phase Hypersil GOLD™ column (1.9 μm, 30 × 2.1 mm i.d. Thermo Fisher Scientific, Germany), which was maintained at 35°C. The solvent system consisted of water/0.1% formic acid (A) and acetonitrile/0.1% formic acid (B), both Optima™ grade (Thermo Fisher Scientific, Germany). Separation was carried out for 40 min under the following conditions: 0–5 min, 0% B; 5–27 min, 31.6% B; 27–34 min, 45% B; 34–37.5 min, 75% B. The flow rate was 0.3 mL/min, and the injection volume was 10 μL. Mass spectra were collected in both negative and positive ion mode. Spectra were acquired with a resolution of 120 000 over m/z 50–1500. The source voltage, sheath gas, auxiliary gas, sweep gas and capillary temperature were set to 2.5 kV(−)/3.4(+), 35 (arbitrary units), 10 (arbitrary units), 0.0 (arbitrary units) and 350°C, respectively. Default values were used for other acquisition parameters. Automatic MS–MS was performed on the four most abundant ions and an isolation width of m/z 2 was used. Ions were fragmented using high-energy C-trap dissociation with a normalised collision energy of 65 and an activation time of 0.1 ms. Data were inspected using Xcalibur (ver. 2.2, Thermo Fisher Scientific, Germany).
Metabolite screening data were collected via LC-QTOF instrumentation. Data were recorded on an Agilent 6546 QTOF mass spectrometer fitted with a dual Agilent Jet Stream (AJS) electrospray ion source. The mass spectrometer was coupled to an Agilent 1290 Infinity II LC system, equipped with a Diode Array Detector (DAD) photodiode array detector. Chromatographic separation was carried out using a ZORBAX RRHD column (2.1 × 50 mm, particle size 1.8 μm), which was maintained at 30°C. The solvent system consisted of water/0.1% formic acid (A) and acetonitrile/0.1% formic acid (B), both Optima™ grade (Thermo Fisher Scientific, Germany). Separation was carried out for 7 min under the following conditions: 0–1 min, isocratic 3% B; 1–5 min, linear from 3 to 50% B; 5–6 min, linear from 50 to 100% B; 6–6.5 min, isocratic 100% B; 6.5–7 min, linear from 100 to 3% B. The flow rate was 0.5 mL/min, and the injection volume was 10 μL. Mass spectra were collected in both negative and positive ion mode (Static Polarity) under the following parameters: gas temperature, 360°C; gas flow, 10 L/min; nebuliser, 40 psi; sheath gas temperature, 400°C; sheath gas flow, 12 L/min; capillary voltage, 4000 V(−)/3500(+); nozzle voltage, 500 V.
1H-NMR spectra were acquired under automation at 300°K using an Avance Neo Spectrometer (BrukerBiospin, Coventry, UK) operating at 600.0528 MHz and equipped with a cryoplatform and a 5-mm triple inverse cryoprobe. Spectra were collected using a water suppression pulse sequence with a 90° pulse and a relaxation delay of 5 s. Each spectrum was acquired using 64 scans of 64 000 data points with a spectral width of 7309.99 Hz. Spectra were automatically Fourier-transformed using an exponential window with a line broadening value of 0.5 Hz. Phasing and baseline correction were carried out within the instrument software. 1H chemical shifts were referenced to d4-TSP at δ0.00. Signal intensities for spectral regions of 22 major metabolites were extracted for absolute quantitation (qNMR) against the known concentration of d4-TSP to provide the concentration expressed in mg/g of dry weight plant material.
LC-QTOF data were processed in Profinder 10.0 software using the Batch Recursive Feature Extraction method (small molecules and peptides) and analysed in Mass Professional Profiler (MPP) software (ver. 15.1, Agilent Technologies). Comparisons within and between species were performed using volcano plots with statistical significance of P < 0.05 and magnitude of change (fold change, FC) > 2. LC-QTOF dataset was curated manually by deleting duplicated peaks (isotope peaks and fragment products) and features that were also present in the blanks (contaminants/impurities). 1H-NMR spectra were automatically reduced, using Amix (Analysis of MIXtures software, BrukerBiospin), to ASCII files containing integrated regions or ‘buckets’ of 0.01 ppm equal width. Spectral intensities were scaled to the d4-TSP region (δ0.05 to −0.05). ASCII files of 1H-NMR spectra, absolute quantitation of major compounds and LC-QTOF features tables were submitted to Principal Component Analysis (PCA) using SIMCA-P software (ver. 17.0.1, Sartorius Data Analytics).
A pooled black-grass sample was prepared and injected (100 μL) in a high performance liquid chromatography-ultraviolet (HPLC-UV) system for fractionation. Separation was carried out on a reversed-phase Ascentis C18 column (5 μm, 5 × 250 mm, Supelco). General experimental procedures for HPLC have been reported previously (Noleto-Dias et al. 2019). Fractions containing the two major peaks in the HPLC trace were analysed by NMR and HPLC-MS as described in previous sections.
Citraconic acid: 1H NMR (600 MHz, D2O-CD3OD) δ 5.92 (brs, 1H), 2.01 (d, J = 1.4 Hz, 3H).
Isovitexin-2″-O-arabinoside:1H NMR (600 MHz, MeOD) δ 7.86 (d, J = 8.8 Hz, 2H), 6.95 (d, J = 8.9 Hz, 2H), 6.62 (s, 1H), 6.50 (s, 1H), 4.94 (d, J = 10.2 Hz, 1H, H-1″), 4.37 (d, J = 8.0 Hz, 1H, H-1‴), 3.87 (dd, J = 12.2, 2.1 Hz, 1H, H-6″), 3.72 (dd, J = 12.3, 5.5 Hz, 1H, H-6″), 3.67 (t, J = 8.9 Hz, 1H, H-3″), 3.61 (m, 2H), 3.52 (m, 2H, H-2‴), 3.44 (d, J = 3.4 Hz, 1H), 3.40 (ddd, J = 9.6, 5.5, 2.0 Hz, 1H, H-5″), 3.10 (dd, J = 12.5, 1.8 Hz, 1H, H-5‴).
For the transcriptomes, leaf material from plants were sampled, RNA extracted, library preparation and sequencing were all done in parallel with the wheat and black-grass samples. RNA was extracted by BGI (www.bgi.com) using their standard plant CTAB extraction protocol as per Chen et al. (2021). Messenger RNA (mRNA) libraries were constructed and sequenced using the standard BGI DNA nanoball sequencing (DNB-seq) pipelines as described in Chen et al. (2021) with a paired 150bp read length.
The RNA-seq processing pipeline was done on wheat and black-grass separately as the data needed to be aligned to each respective genome to ensure that specific gene expression differences could be identified. Samples of five biological replicates of all genotypes included in this study and exposed to waterlogged and control conditions were processed, except for waterlogged Jackson, which had only four replicates due to lack of quality RNA extraction. The reads for each RNA-seq sample were mapped to the relevant reference – either wheat iwgsc_refseqv2.1_assembly_idx and iwgsc_refseqv2.1_annotation_200916_ALL.gtf at https://www.ncbi.nlm.nih.gov/assembly/GCF_018294505.1 or published black-grass genome at Cai et al. (2023) using HISAT2 (Kim et al. 2019), with an additional step to trim the first 10 bases of each read. Transcript abundance was estimated using featureCounts (Liao et al. 2014). The transcript abundance table was analysed using the BioConductor R package DESeq2 (Love et al. 2014). The same package was used to make pairwise comparisons between waterlogged and control samples in four biotypes or cultivars (Lola103, Peldon, Frument, Jackson). PCA plots were generated from the wheat and black-grass samples with the aim of determining the consistency of replicate samples of different treatments, and to look for overall differences between treatments. Analysis of the variations amongst the samples showed sample labelled as Jackson Control_A was an outlier and it was therefore omitted from the subsequent analyses. Significantly differentially expressed genes (DEGs) between control and waterlogged conditions were identified using cut-offs of log2FoldChange = ±2 and P < 10−5 for black-grass and log2FoldChange = ±2 and P < 10−20 for wheat. DEGs for each biotype or cultivar were put through a GO enrichment analysis, using the BioConductor package topGO with additional cross-referencing for wheat using Gene Ontology (https://geneontology.org/) tools (Ashburner et al. 2000) or Triticeae-GeneTribe (Chen et al. 2020) or the PANTHER (Protein ANalysis THrough Evolutionary Relationships) Classification System (https://pantherdb.org/tools/compareToRefList.jsp).
Results
Physiological traits
To derive a physiological and molecular basis for waterlogging tolerance or intolerance we conducted side-by-side assessments of black-grass and wheat grown in field-replicating soil in pots that were either allowed to drain naturally or sealed so that they were completely waterlogged in a controlled glasshouse. Others have shown wheat exhibits no significant differences in a variety of physiological measurements, including stomatal conductance, mesophyll conductance, internal CO2, chlorophyll fluorescence, net photosynthesis and relative growth rates of shoot or roots when waterlogged (Ploschuk et al. 2018). Accordingly, we focused only on total biomass production of the aerial tissues, and our physiological analyses aimed to identify differences between the species.
Quantitative phenotypic data were taken regularly throughout the treatment period and total aerial tissue fresh weights were obtained at the end of the experiment. Assessing the height of the longest leaf gave non-destructive measurements through time (Figs 1a, b and S1). Final fresh weight measures were also taken, as they better represent total growth of plants with multiple tillers (Fig. 1c, d). Because of the large variation within and between the species, relative values, where data were normalised to the control, are presented. The waterlogging stress we imposed significantly reduced the height of all the wheat accessions (Figs 1a and S1) and significantly increased the total biomass of 9 of the 13 black-grass biotypes (Fig. 1d). Therefore, at the species level, our data demonstrates that application of an equal amount of waterlogging stress repressed the growth of multiple cultivars of wheat, whereas all tested black-grass biotypes were either unchanged or larger under waterlogging (Figs 1 and S1). This is further supported by restricted maximum likelihood/linear mixed effects model (REML/LMM) analysis, which shows that all wheat lines had a relative measure of waterlogging that was less than 1.00 and negative values for Difference (W – C), whereas black-grass relative measures were greater than 1.00 and displayed positive values for Difference (Fig. S2). The differences within and between the species suggest that different adaptation mechanisms may be employed in response to waterlogging.
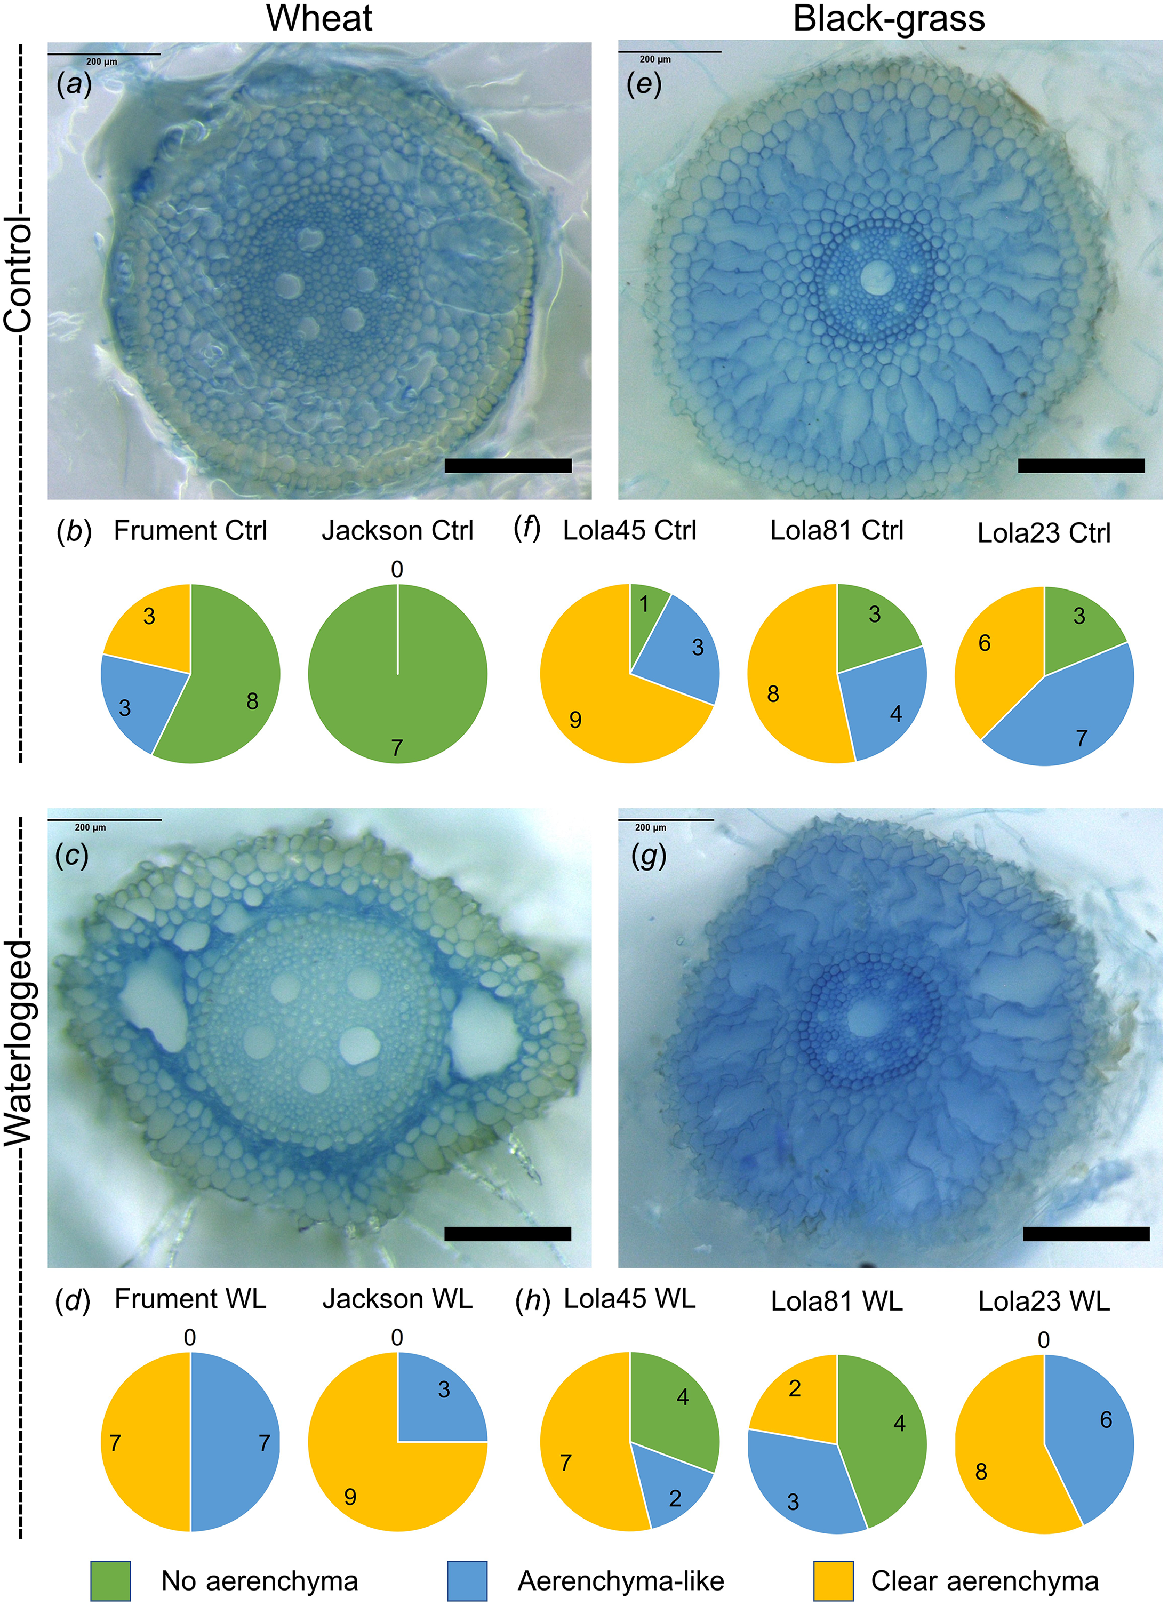
As previously shown for wheat (Ploschuk et al. 2018), we found that waterlogged wheat (Fig. 2a–d) and black-grass (Figs 2e–h and S4) have aerenchyma, or aerenchyma-like structures in roots. Because the black-grass root system is not well described and the definition of aerenchyma is imprecise, we classified individual root sections into three categories: those lacking aerenchyma-like structures, those with aerenchyma-like airspaces, and those with clearly identifiable aerenchyma. Using these classifications, both wheat varieties showed an obvious increase in the aerenchyma and aerenchyma-like structures (Fig. 2b, d). Interestingly, all of the black-grass biotypes had more aerenchyma or aerenchyma-like structures than wheat in the control treatment, and some of the black-grass biotypes analysed had more aerenchyma and aerenchyma-like structures in the controls compared to the waterlogged treatments (Figs 2f, h and S4). Therefore, in contrast to wheat, aerenchyma-like structures are constitutively present in all black-grass biotypes tested and there is no consistent increase in aerenchyma in response to the waterlogging treatment.
Black-grass has constitutive aerenchyma in the roots, whereas wheat induces root aerenchyma in response to waterlogging. Microscopy sections showing evidence for aerenchyma formation in wheat (cultivar Jackson a, c) and black-grass (biotype Lola45 e, g). Scale bars represent 200 μm. Qualitative assessment for presence or absence of aerenchyma in black-grass (f or h) and wheat root sections (b or d). Number of sections with no aerenchyma (green), small or ill-defined aerenchyma (blue) or clearly identifiable aerenchyma (yellow) are shown in the pie graphs.
Molecular and metabolic traits
Taking an unbiased approach to determine which gene expression patterns and metabolites were being altered in response to waterlogging in black-grass and wheat, we conducted a parallel transcriptomic and metabolomic analysis of leaf tissue from plants exposed to 21 days of waterlogging and non-stressed control plants. As black-grass is a winter annual grass weed that is more problematic in winter wheat than spring wheat (Naylor 1972; Moss 1985), we focused on the two winter-wheat cultivars Jackson and Frument. We paired these wheats with two black-grass biotypes (Peldon, Lola103) where the REML/LMM analysis showed evidence of a significant increase in above-ground fresh weight due to waterlogging (Fig. S2). The data from relative fresh weights (Fig. 3a) and length of the longest leaf (Fig. 3b–e) support the previous conclusions that wheat is significantly smaller when waterlogged (Student’s t-Test between unnormalised data from waterlogging and control P < 0.05), and that the wheat cultivar Frument is less tolerant than Jackson based on the relative differences between their tolerances. For black-grass, Lola103 was unaffected by this waterlogging treatment, whereas Peldon grew larger under waterlogging (Student’s t-Test between unnormalised data from waterlogged and control P < 0.05). Because of the unbalanced design used for the trial (for 16 treatment combinations allocated to trays each containing six pots, with six different treatment combinations in each tray), the fresh weight data were analysed as a linear mixed model using the REML algorithm, and with a random model allowing for variation between trays and between pots within trays. Two fixed models were considered, the first assessing differences between the four lines, differences between the waterlogging and control treatments, and the interaction effect between these two factors. A more complex model assessed whether the variation between lines and the interaction effect could be explained by difference between species, or whether there was additional variation due to differences between lines within each species. The fresh weight data were log-transformed prior to analysis to cope with variance heterogeneity. The analysis of the log-transformed fresh weight data indicated a highly significant overall effect of line (F = 37.22 on 3 and 89 d.f., P < 0.001), a marginally significant overall effect of treatment (F = 3.71 on 1 and 94 d.f., P = 0.057) and a marginally significant line-by-treatment interaction effect (F = 2.57 on 3 and 90 d.f., P = 0.059). Further analysis using the more complex model showed that most of the variation due to the line-by-treatment interaction term was explained by the different effects of the waterlogging treatment for the two species (F = 7.54 on 1 and 95 d.f., P = 0.007), with no evidence for additional variation between the effects for the two lines within each species (F = 0.51 on 2 and 88 d.f., P = 0.776).
Black-grass was less affected by waterlogging than wheat when fresh weight (a), height (b–e), transcriptomes (f, h) or metabolomes (g, i) were measured. Control samples are represented by different shades of brown colours and waterlogged samples represented by different shades of blue colours, where colours are consistent in all panels and across Figs 6 and 7. * indicates that a heteroscedastic, two-tailed distribution Student’s t-Test gave P < 0.05 between unnormalised control samples compared to unnormalised waterlogged samples and ** indicates P < 0.01. Relative fresh weights (a) or heights as measured by the length of the longest leaf (b–e) for samples sent for transcriptomic and metabolomic analysis. Averages of five individual plants ± s.e. are shown. PCA clustering of transcriptomics datasets for wheat (f) or black-grass (h). PCA scores plot of 1H-NMR metabolomics datasets for wheat (g) or black-grass (i). Note: sample JACAA indicated with ‡ was identified as an outlier and removed from further analysis.
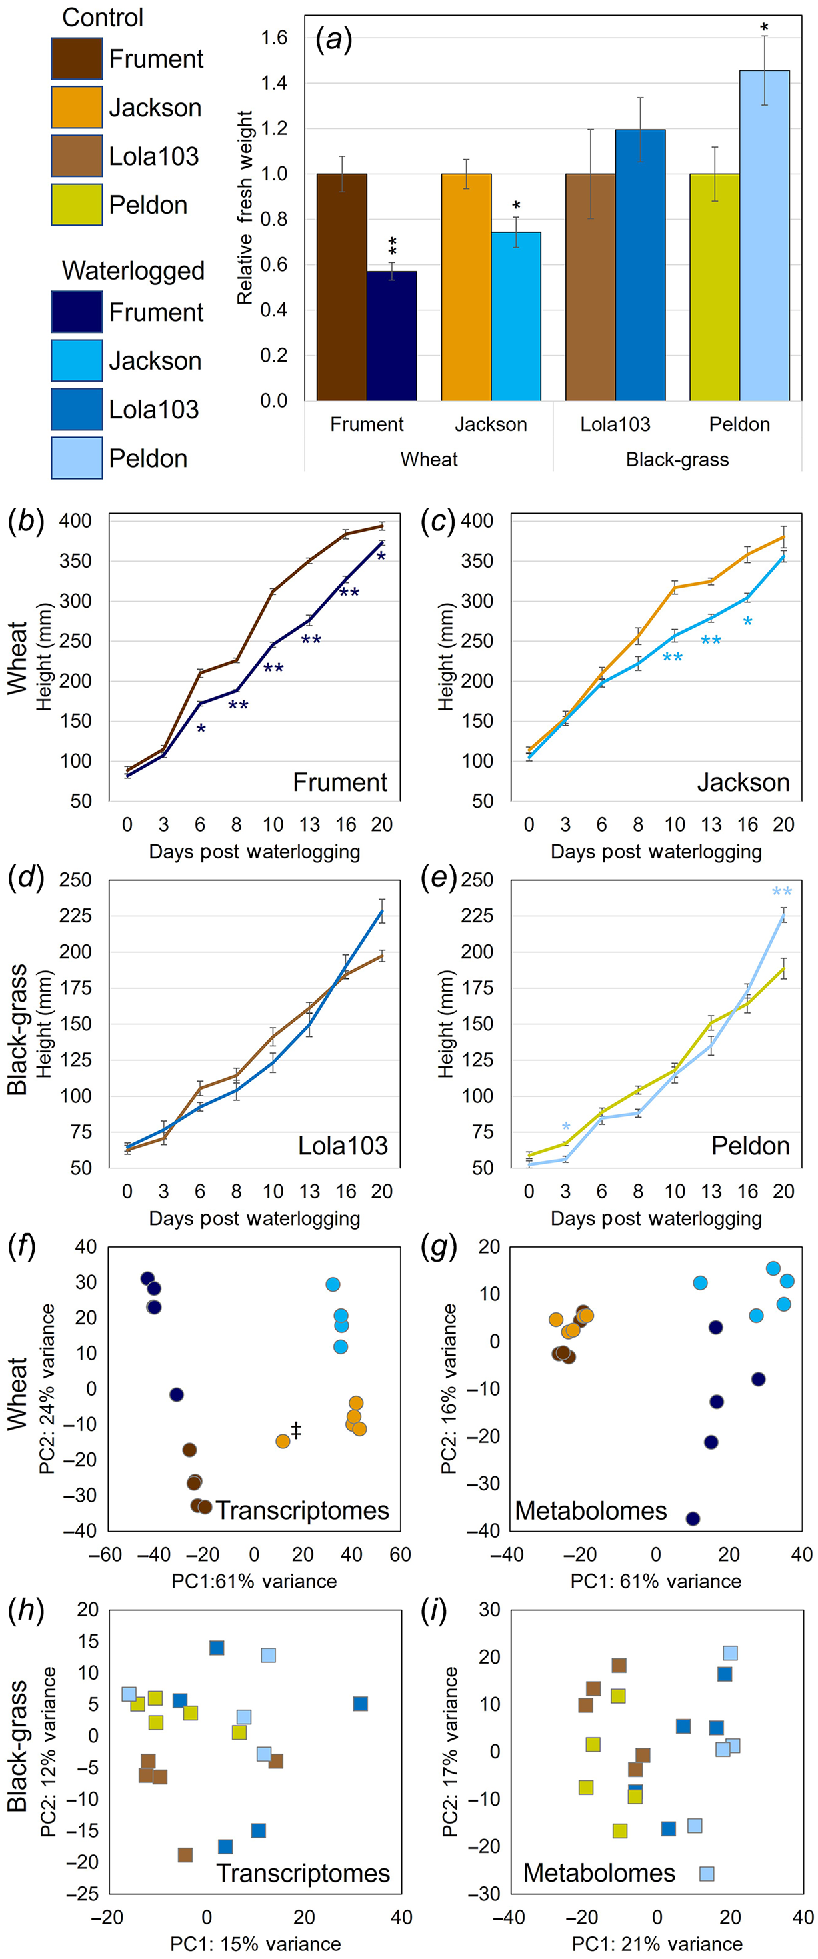
Interestingly, we found that in both transcriptome and metabolome samples, rather than the clear separation seen in the Principal Component Analysis (PCA) for wheat (Fig. 3f, g), black-grass showed little separation and clustering of the samples/replicates (Fig. 3h, i). Although the black-grass PCA plots showed that the first two coordinates sufficiently explained 27% of the variance for transcriptomics, 38% for the 1H-NMR variance (Fig. 3h, i), and 52% and 26% for the qNMR and LC-MS data, respectively (Fig. S5A, B), this was much lower than what was seen in wheat, where the first two coordinates explained 85% and 77% of the variance in the transcriptome and in the metabolome by 1H-NMR, respectively (Fig. 3f, g). Similarly, 79% and 65% of the variance in qNMR and LC-MS datasets, respectively, was explained by the first two coordinates (Fig. S5C, D). These PCA plots show that black-grass’ transcriptome and metabolome were not greatly changed in response to waterlogging treatment. Additionally, these results suggest that these samples had more complex patterns of omic variation than wheat. In wheat, the main responses to the waterlogging treatment were highly correlated and most of the variation could be explained in the two first components.
We first acquired 1H-NMR spectra to determine absolute quantities of the major primary and secondary metabolites in the extracted samples from wheat or black-grass cultivars/biotypes that had been exposed to waterlogging or control conditions (Fig. 4, Table S2). These data were then paired with screening data from LC-MS, which allowed for the analysis of a wider range of less abundant secondary metabolites (Table S3). Both these untargeted approaches require comparison to authentic standards for data annotation and in the case of unknowns, compound isolation to enable structural characterisation to confirm the identity of a given peak.
Ratio of waterlogged over control for the target metabolites quantified by 1H-NMR. Red = Frument, Orange = Jackson, Green = Lola103 and Purple = Peldon. * indicates statistically significant differences between unnormalised control and unnormalised waterlogged values at P < 0.05 and ** at P < 0.01 from ANOVA analysis. Thick black line is at 1 to highlight metabolites with no difference between waterlogged and control. Targets are grouped by behaviour. GABA, gamma-aminobutyric acid. The data that underpin this graph, e.g. the absolute quantities of the metabolites, fold change between waterlogged and control samples within a cultivar or biotype, and the P value from ANOVA analysis between unnormalised values from waterlogged and control samples, are shown in Table S2.
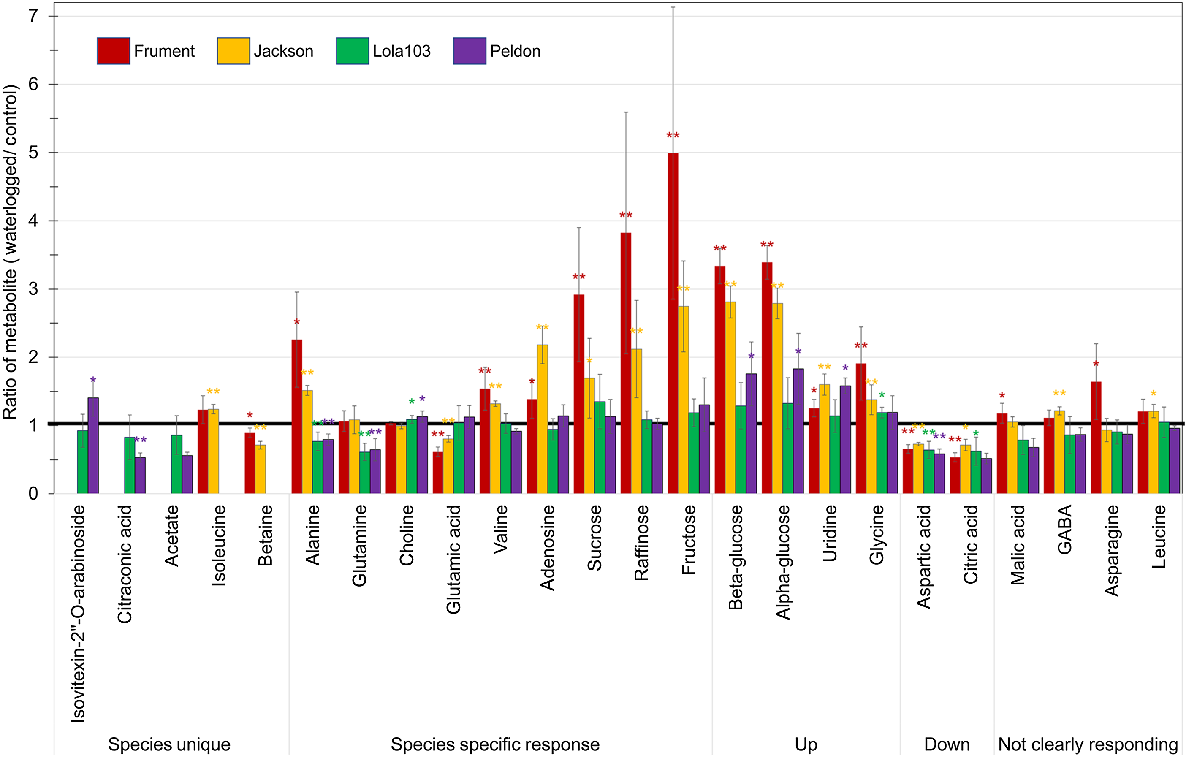
Analysis by 1H-NMR showed that of the 24 metabolites measured by 1H-NMR, 12 were significantly increased and 4 significantly decreased in Frument, 13 significantly increased and 4 significantly decreased in Jackson, 2 significantly increased and 4 significantly decreased in Lola103, and 5 significantly increased and 4 significantly decreased in Peldon in response to the waterlogging treatment (Fig. 4, Table S2). Of these significantly altered metabolites, only aspartic acid was similarly altered in all samples and it was decreased in response to the waterlogging (Fig. 4, Table S2). More generally, beta-glucose, alpha-glucose, uridine and glycine were significantly increased in Peldon and the two wheats, whereas citric acid was significantly reduced in Lola103 and the two wheats (Fig. 4, Table S2). Analysis by LC-MS showed similar results with lower number of altered compounds identified in black-grass and few overlaps between the species (Fig. 5, Table S3). There was a total of 87 compounds that showed significant differences between waterlogged and control in at least one sample (Fig. 5a, Table S3). Yet, only two compounds with formulas of C25H40O9 and mass and retention times of 484.2664@5.61 or 484.2665@5.53 were downregulated in Control versus Waterlogging comparisons for all samples; and C21H16O7 with a retention time of 380.0904@0.32 was downregulated in Lola103 and both wheat cultivars (Table S3). Therefore, although the metabolic profile of each sample was altered by waterlogging, the response to waterlogging was less pronounced in black-grass than in wheat and the profile changes were different between the species.
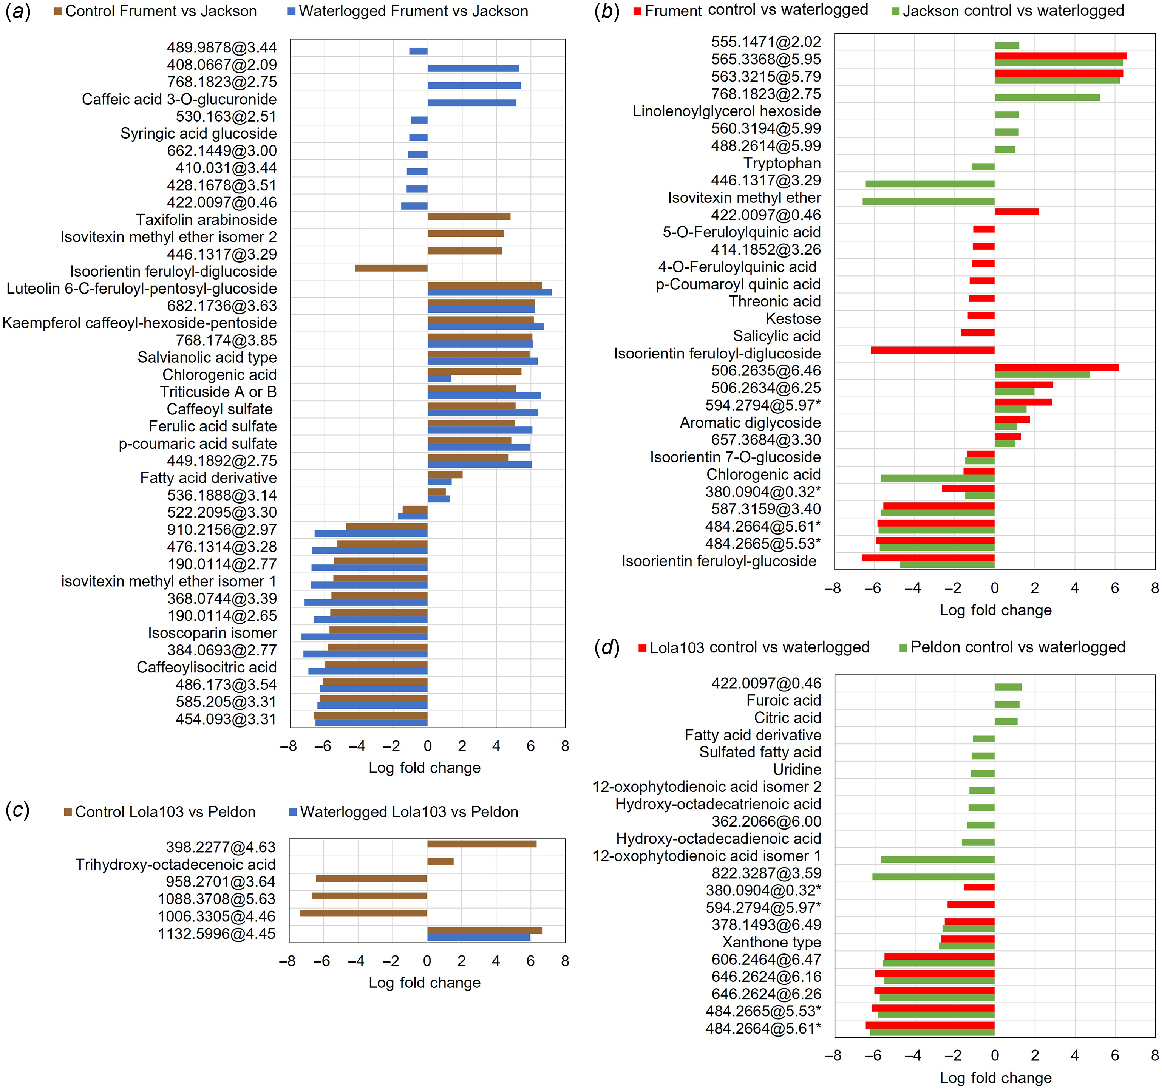
Analysis of LC-MS targets showing Log Fold Change of targets grouped by comparison. Where compounds could not be identified, mass and retention time are given. (a) Differences between wheat cultivars on control (brown) or waterlogging (blue) treatments. (b) Differences of wheat cultivars biotypes between treatments showing Frument Control compared to Waterlogged (red) and Jackson Control compared to Waterlogged (green). (c) Differences between black-grass biotypes on control (brown) or waterlogging (blue) treatments. (d) Differences of black-grass biotypes between treatments showing Lola103 Control compared to Waterlogged (red) and Peldon Control compared to Waterlogged (green). The data underpinning this figure, i.e. the mass and retention times, compound identifications and formula, description of the treatment in which it was elevated, log of the fold change, and corrected P values for statistical analysis between various comparisons within or between cultivars or biotypes, are shown in Table S3.
The aromatic/olefinic region of 1H-NMR spectra of all black-grass samples was dominated by peaks of two metabolites (Fig. S6A). The black-grass chromatogram traces (from the DAD and MS) also showed two major peaks (Fig. S6B, C). To confirm their identity, these peaks were isolated by HPLC fractionation and identified as citraconic acid and isovitexin-2″-O-arabinoside. These major metabolites were only present in the black-grass samples and could not be detected in any of the wheat samples. Citraconic acid is an unsaturated dicarboxylic acid that is increased by drought stress (Wang et al. 2022) or salt stress (Zhang et al. 2016) and isovitexin-2″-O-arabinoside is characterised as an inactive flavonoid in Avena sativa (Mandeau et al. 2011).
Some metabolites were unique to one of the species (Fig. 4, Table S2). Of these, citraconic acid was significantly decreased in waterlogged Peldon, and betaine in both wheat cultivars. On the other hand, the increase in isovitexin-2″-O-arabinoside was only significant in waterlogged Peldon and isoleucine in Jackson.
Under waterlogging conditions, both wheat cultivars had higher levels of sugars (e.g. sucrose, raffinose, fructose, β-glucose and α-glucose, Fig. 4, Table S2) than either black-grass biotype. Sucrose and alanine accumulated more than two-fold in Frument. The nucleoside adenosine was two-fold higher in Jackson only.
Among the metabolites that showed species-specific patterns, the amino acid alanine is the most interesting since it significantly accumulated in wheat, whereas it was significantly reduced in black-grass. Waterlogged black-grass had lower levels of glutamine and higher levels of choline than their control samples, whereas these metabolites were unchanged in wheat. On the other hand, glutamic acid was reduced with valine, adenosine and sugars (sucrose, raffinose and fructose) elevated in waterlogged wheat, whereas no changes were observed in black-grass (Fig. 4, Table S2).
The effect on aspartic and citric acid was similar on both species as they are both decreased in their waterlogged samples. Conversely, waterlogged samples from both species accumulated glucose, uridine and glycine (Fig. 4, Table S2).
From the LC-MS analysis, discriminatory lists via Volcano plots for within and between species comparisons as well as between treatments in negative ion mode can be found in Table S3. As a generalisation, the differences between the species were greater than within the species and when modelled together, the biotypes/cultivars behaved similarly to each other.
Intrinsic differences can be noted between the wheat cultivars when control samples are compared (Figs 5a and S5C, D, Table S3). There was a total of 40 compounds that showed significant genotypic differences (Fig. 5a, Table S3). Frument is richer in sulfated phenylpropanoids (coumaroyl, caffeoyl and feruloyl sulfates) and flavonoid glycosides such as luteolin 6-C-feruloyl-pentosyl-glucoside, kaempferol caffeoyl-hexoside-pentoside and triticuside A or B (Fig. 5a, Table S3). In contrast, Jackson had higher levels of isoscoparin, isovitexin methyl ether and isoorientin feruloyl-diglucoside. Most of these metabolites were consistently higher or lower in the respective genotype under both control and waterlogged conditions, and thus not related to secondary effects in the leaves due to stress (Fig. 5a, Table S3). These include components of the flavonoid and phenylpropanoid pathways (e.g. ferulic and chlorogenic acid), a lignan-glycoside, as well as salvianolic acid, which has been implicated with drought tolerance in maize and soybean (Kazerooni et al. 2022).
Differences between control and waterlogging in wheat was more evident with a higher number of significant differences (Fig. 5b, Table S3). Tryptophan, which has been implicated with drought tolerance (Sadak and Ramadan 2021), was elevated in the waterlogged samples of Jackson. Though different, molecules with antioxidant/anti-inflammatory properties showed the highest increase under waterlogging in both genotypes (Fig. 5b, Table S3). Under waterlogging conditions, Frument showed higher levels of phenolic acids, such as feruloylquinic, p-coumaroylquinic, salicylic and chlorogenic acids and flavonoids, as glycosides of isoorientin (Fig. 5b, Table S3). A similar metabolic response was observed for Jackson, but with a lower number of discriminant phenolics and flavonoids.
We observed very little difference between the control or waterlogged metabolomes of the two black-grass genotypes (Fig. 5c, Table S3). Trihydroxy-octadecenoic acid, also known as pinellic acid, which has been implicated with plant defence (Mareya et al. 2019), was at higher levels in Peldon than in Lola103 under control conditions. In black-grass a total of 21 compounds were responsive to waterlogging (Fig. 5d, Table S3). Waterlogged Peldon accumulated more fatty acids, uridine and isomers of oxophytodienoic acid, a primary precursor of jasmonic acid (12-oxophytodienoic acid, OPDA), whereas citric and furoic acids were reduced in these samples.
The average mapping percentages for black-grass and wheat samples were 81.4% and 95.5%, respectively. Analysis of these transcriptomes shows that Frument displayed many more differentially expressed genes (DEG) between waterlogged and control than the other three samples; Jackson, and both black-grass biotypes had few DEG (Figs 6 and 7, Tables S4 and S5). Despite these small numbers, interesting patterns have emerged.
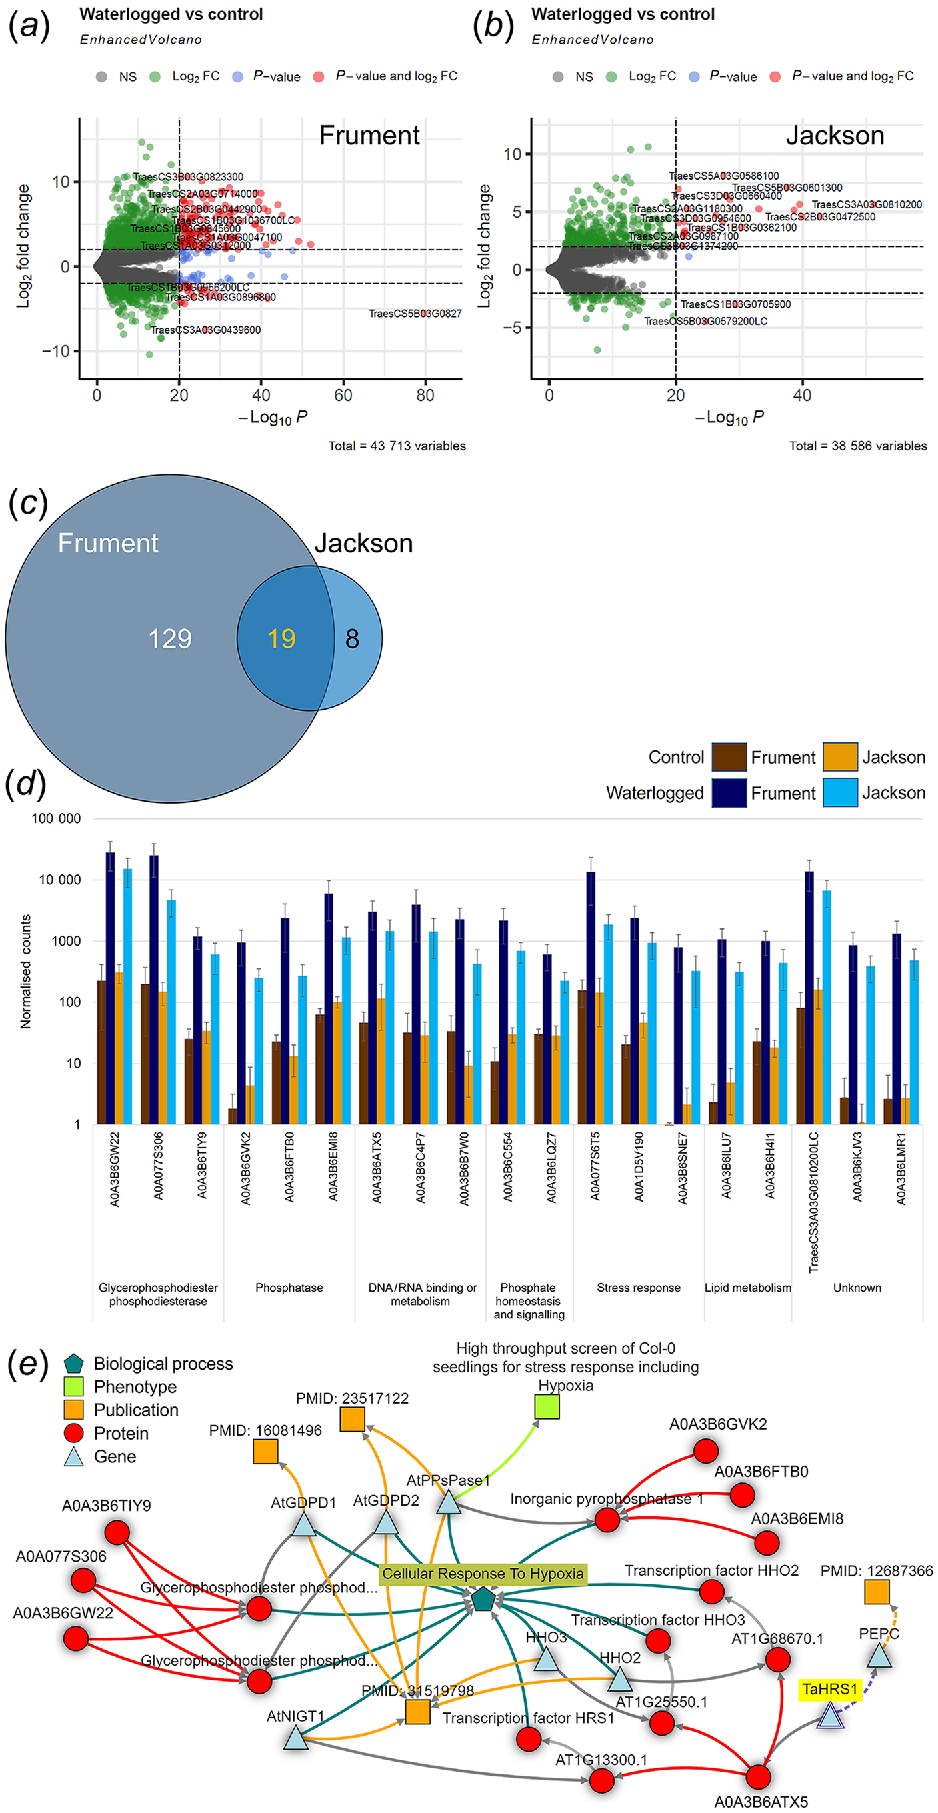
Transcriptomics analysis of wheat. Volcano plot analysis of DEG for Frument (a), Jackson (b). Labelling includes total number of variables and gene names. Colouring indicates non-significant (NS, grey), log2FoldChange = ±2 (green), significant above P < 10−20 (blue) or log2FoldChange = ±2 and P < 10−20 (red). (c) Venn diagrams of the overlap between DEG of Frument and Jackson. (d) Bar chart of normalised counts for the DEG of wheat. Control (brown colours) or waterlogged samples (blue colours). Shown are 19 common DEG from the two wheat cultivars Frument and Jackson as sorted by function. The IWGSC gene names (International Wheat Genome Sequencing Consortium, Chinese Spring v2.1) are given except when no match was present, in which case the UniProtKB/Swiss-Prot entry name is shown. (e) Knetminer network linking encoded proteins (red circles), genes (blue triangles), phenotype (green square), publications (orange squares) to biological process GO term GO:0071456 ‘Cellular Response to Hypoxia’ (blue pentagon). Publications indicated: PMID: 16081496 Branco-Price et al. (2005), PMID: 23517122 Luhua et al. (2013) and PMID: 31519798 Lee and Bailey-Serres (2019).
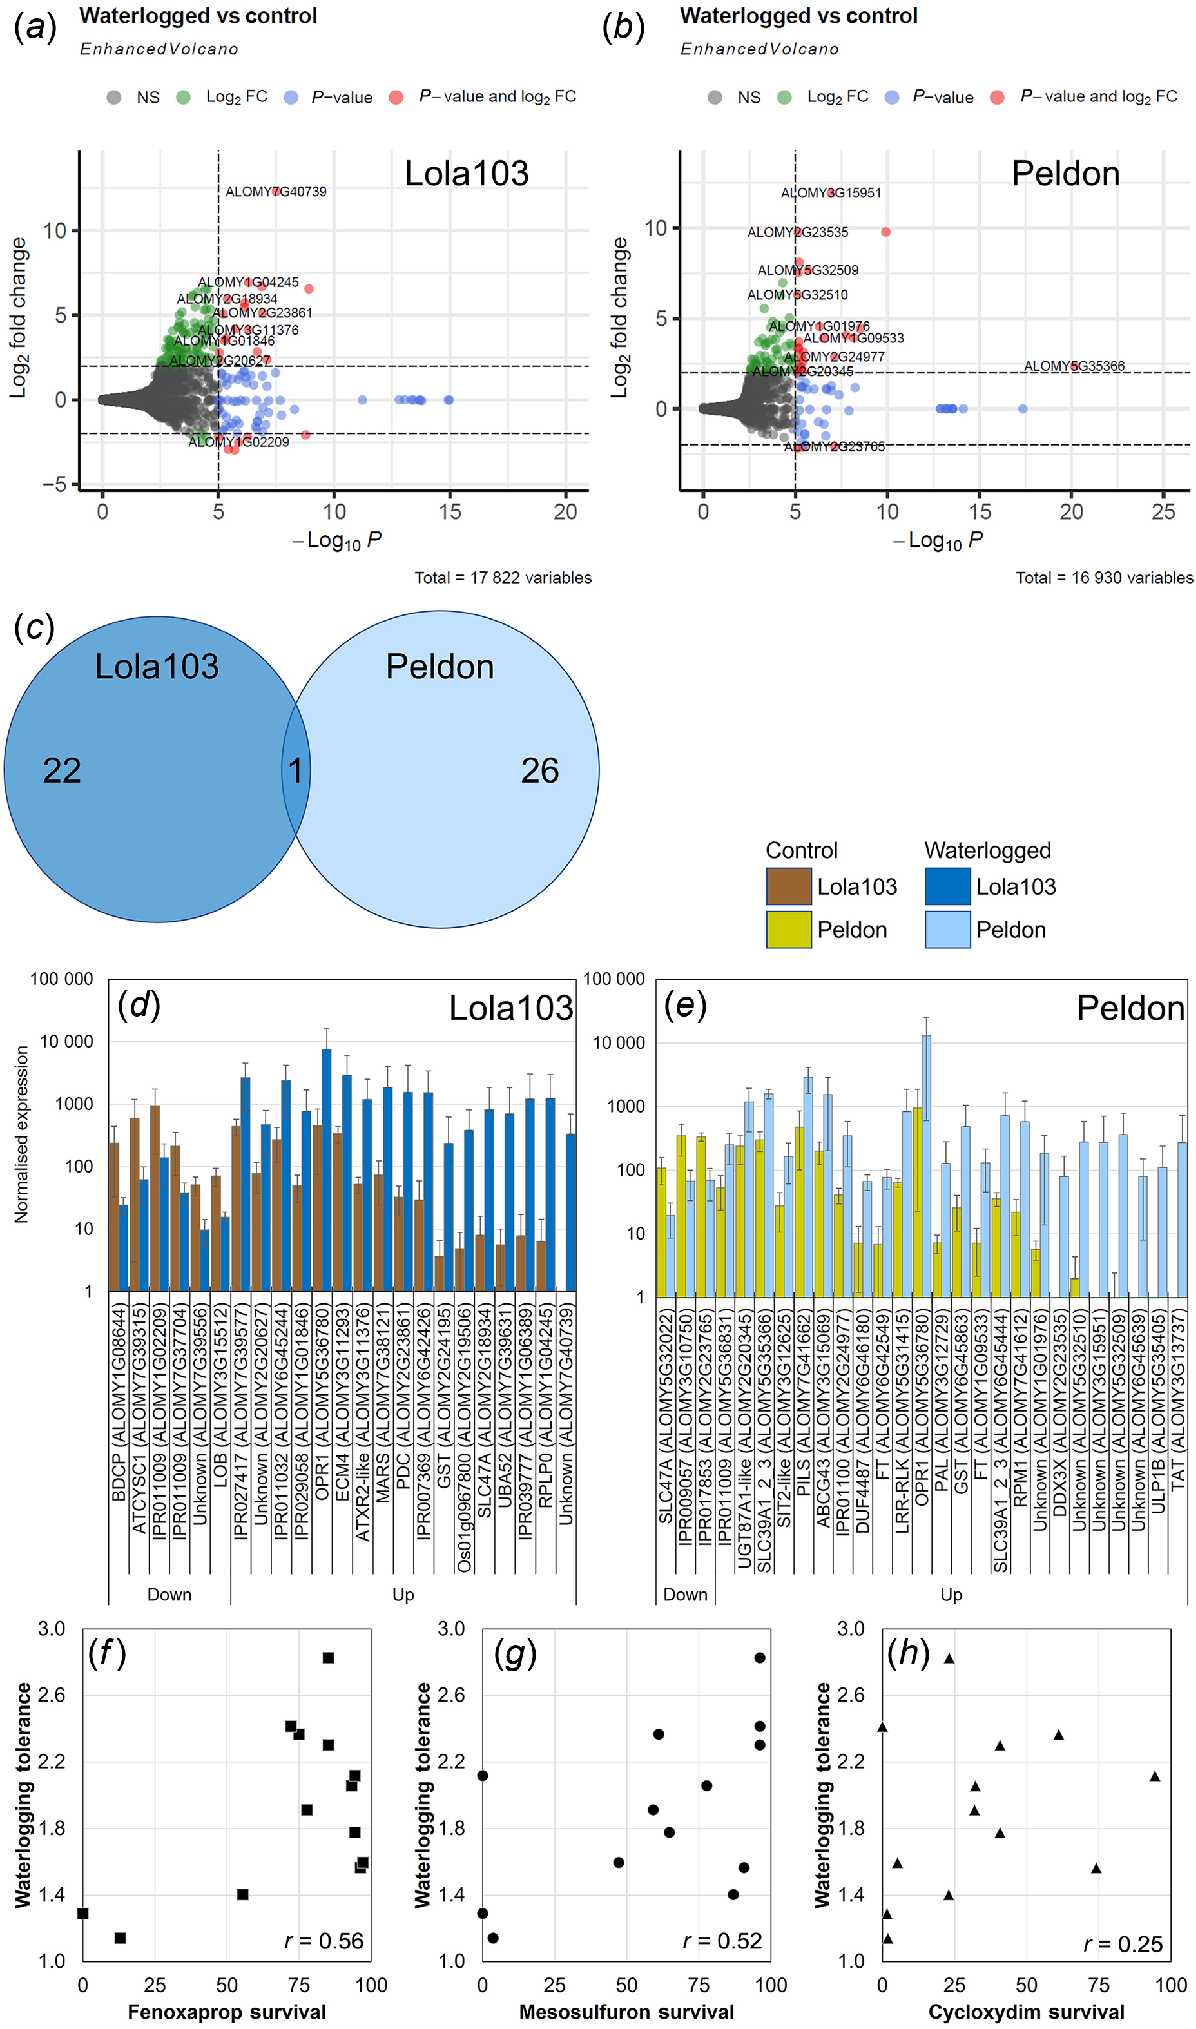
Transcriptomics analysis of black-grass. Volcano plot analysis of DEG for Lola103 (a) or Peldon (b). Labelling includes total number of variables and gene names. Colouring indicates non-significant (NS, grey), log2FoldChange = ±2 (green), significant above P < 10−5 (blue) or log2FoldChange = ±2 and P < 10−5 (red). (c) Venn diagrams of the overlap between DEG of Lola103 and Peldon. Bar chart of normalised counts for 23 DEG from Lola103 (d) and 27 DEG from Peldon (e). Control (brown colours) or waterlogged samples (blue colours). Genes are sorted by the fold change in waterlogging over control. The gene names given by Cai et al. (2023) or InterPro predictions are given where available. (f–h) Correlation analysis between Restricted Maximum Likelihood algorithm calculated waterlogging tolerance compared against herbicide resistance reported in Comont et al. (2020) for survival after application of fenoxaprop-p-ethyl (Fenoxaprop, f), mesosulfuron-methyl + iodosulfuron (Mesosulfuron, g) or cycloxydim (h). The r numbers given are the calculated correlations between survival and waterlogging tolerance.
Comparing within the wheat cultivars, we see differences and commonalities between Frument and Jackson. Our PCA analysis shows PC1 explained 61% of the variance and without waterlogging, the transcriptomes of Frument and Jackson were separated on the PCA (Fig. 3f). This suggests constitutive differences in gene expression exist between these cultivars. However, despite these intrinsic differences, most of the identified transcripts that change in response to waterlogging were common between the cultivars. Comparing between the waterlogged and control conditions, 148 DEG were identified in Frument (Fig. 6a–c), whereas Jackson had 27 DEG (Fig. 6a–c). Of the latter, all showed the same expression pattern in Frument and 19 were DEG in Frument by the same cut-offs (Fig. 6b, Table S4). Exploring the top 20 DEG for either cultivar, they clustered into up- or downregulated by treatment (Fig. S7A, B). We analysed the top 25 in wheat for enrichment of GO terms using Triticeae-GeneTribe (Chen et al. 2021), which showed 14 Biological processes, 7 Molecular Functions and 8 Cellular Component terms were common between the two wheat cultivars (Table S6). Looking at only the DEG that are commonly differentially expressed, all were upregulated in response to the waterlogging (Fig. 6, Table S4) and GO terms were identified and analysed from tools described in Ashburner et al. (2000) and The Gene Ontology Consortium (2021) (Table S7) or PANTHER (https://pantherdb.org/tools/compareToRefList.jsp, Table S8). In addition to several uncharacterised proteins, these 19 DEG encode for three proteins that are involved in stress responses, specifically characterised as ABA, water-stress, cold, or phosphate starvation responsive, or the hydrophobic protein ORS8 (Fig. 6d, Tables S4, S7 and S8). Of the DEG, there were three glycerophosphodiester phosphodiesterases, three phosphatase, and two encoding for proteins involved in phosphate homeostasis and signalling (Fig. 6d, Tables S4, S7 and S8). Three of the DEG identified encode for proteins involved in metabolism of glycerophospholipids and two involved in lipid metabolism more generally (Fig. 6d, Tables S4, S7 and S8). Finally, three DEG are implicated in DNA or RNA binding or metabolism (Fig. 6d, Tables S4, S7 and S8). When they were queried using Knetminer (Hassani-Pak et al. 2021), a network was generated that linked 7 of the 19 DEG through publications to the cellular response to hypoxia via homologs in the literature (González et al. 2003; Branco-Price et al. 2005; Luhua et al. 2013; Lee and Bailey-Serres 2019) (Fig. 6e).
Exploring the eight transcripts that were uniquely differentially expressed in Jackson (Fig. 6b, c), six were upregulated and two downregulated. These DEG were identified in Frument as well and although they changed in the same direction, they fell outside the statistical criteria of log2FoldChange = ±2 and P < 10−20 to be DEG (Table S4). One upregulated transcript (TraesCS1B03G0362100) is predicted to encode for the glycerophosphodiester phosphodiesterase GDPD5. This compound has previously been identified in a genome wide association study for variation in salinity tolerance during seed germination and seedling establishment in spring. In that study, it showed the highest expression under abiotic stress in the root (Hasseb et al. 2022). The glycosylphosphatidylinositol (GPI)-anchored protein LORELEI-LIKE GPI-ANCHORED PROTEIN 1 (LLG1, TraesCS3B03G1374200) was also upregulated in Jackson. LLG1 plays a role in plant immunity (Shen et al. 2017) and acts as a chaperone and coreceptor for FERONIA to regulate plant growth and development (Li et al. 2015). Similarly, TraesCS2A03G0353700 was upregulated and encodes for SPX domain-containing protein 5 which was one of seven phosphate signalling regulatory proteins (SPX) that were upregulated in wheat flag leaf transcriptomes in response to sodicity stress (Prasad et al. 2021). Also in this set is a helix-turn-helix (HTH) myb-type domain-containing transcription factor called NIGT1 (TraesCS2B03G0328200), which in Arabidopsis and maize under phosphate starvation, modulates uptake of phosphate and nitrate to maintain the phosphorus to nitrogen balance (Wang et al. 2020). A putative glycerol-3-phosphate transporter 1 (TraesCS2A03G0987100) is a DEG in Jackson, further supporting the role of lipid and phosphate metabolism in Jackson’s response. There is limited information on the other DEGs, which encode a (1,31,4) beta glucanase reported as Lichenase-2 (TraesCS1B03G0705900), a putative coatomer subunit beta’-3 (TraesCS7B03G1238300) and an uncharacterised protein (TraesCS5B03G0579200LC).
There were 129 transcripts that were unique DEG in Frument (Fig. 6a, c, Tables S4, S6, S7 and S8). A gene enrichment analysis of these using online tools from Chen et al. (2020) shows enrichment of zinc ion transmembrane transport, glycerophospholipid catabolic process, protein tetramerisation, cellular response to hypoxia, glycerol metabolic process and glycolipid biosynthetic process are the top six enriched terms (Table S6, Fig. S8). A different tool (Ashburner et al. 2000; The Gene Ontology Consortium 2021) produces a similar result (Table S7) with lipid remodelling, ion transport and alcohol metabolism categories being enriched in this dataset of 129 DEG. Lipid remodelling, particularly a decrease in phosphatidylcholine and phosphatidylethanolamine, is a known feature of hypoxia (Xie et al. 2015). The GO term associated with glycerophospholipid catabolic process (GO:0046475) is the top over-represented hit from these 129 transcripts where 7 DEG are found out of 8 in the genome giving a >100 fold enrichment (q = 1.1 × 10⁻¹³).
Despite the poor clustering between the black-grass samples (Fig. 3h) with a reduced stringency (log2FoldChange = ±2 and P < 10−5 for black-grass compared to log2FoldChange = ±2 and P < 10−20 for wheat), it was possible to identify transcripts that were differentially expressed in response to the waterlogging treatment (Fig. 7a–e, Tables S5 and S9). Lola103, which had similar biomass with and without waterlogging, showed a total of 23 DEG that were altered; whereas Peldon, which was larger with waterlogging, had 27 (Fig. 7a–c). Because of the small number of DEG, it was not possible to do analyses such as GO term enrichment, but the Gene Ontology terms associated with these DEG are provided in Table S9. Similar to the PCA plot (Fig. 3h), cluster analysis of the top 20 DEG did not present a clear pattern of separation by treatment or biotype (Fig. 5c, d).
Importantly, only one of these DEG was shared among the two biotypes (Fig. 7a–e). This DEG (ALOMY5G36780) was upregulated in both Lola103 and Peldon and it encodes for a 12-oxophytodienoic acid reductase (OPR1). OPR1 has been previously identified in black-grass (KY172653) as one of the few transcripts (Franco-Ortega et al. 2021) or proteins (Tétard-Jones et al. 2018) that are upregulated and strongly correlated with metabolism based resistance to herbicides. 12-oxophytodienoate reductases (OPRs) are enzymes involved in the biosynthesis of bioactive jasmonic acid (JA), converting 12-oxophytodienoic acid (OPDA) to 3-oxo-2-(2’-pentenyl)cyclopentane-1-octanoic acid (OPC-8:0), which is then used for synthesis of various JA derivatives, such as jasmonoyl-isoleucine (JA-Ile) (Stintzi and Browse 2000). As mentioned above, the LC-MS data identified several compounds that are associated with OPR activity including hydroxy-octadecatrienoic acid, a sulfated fatty acid, α-linolenic acid, two isomer peaks that identify as oxophytodienoic acids, as well as jasmonic acid; when detected, these were significantly increased in Jackson and Peldon in response to the waterlogging (Fig. S9, Table S3).
Additional transcripts of interest that were identified as DEG from black-grass included pyruvate decarboxylase (PDC1, ALOMY2G23861) which in response to the waterlogging treatment was significantly upregulated in Lola103 (Fig. 7a, c, d and S9B). PCD1 catalyses the first step in ethanolic fermentation and is a well-known player in hypoxia and anoxia tolerance (Pan et al. 2021). We saw significant upregulation of two different glutathione S transferases (GSTs, ALOMY6G45863 and ALOMY2G24195, respectively) in Lola103 and Peldon in response to waterlogging (Fig. 7d). Interestingly we also saw MULTIDRUG AND TOXIC COMPOUND EXTRUSION (MATE) family protein SLC47A (ALOMY5G32022) downregulated in Peldon and SLC47A (ALOMY2G18934) upregulated in Lola103 (Fig. 7d, e). Two different phosphatidylethanolamine-binding proteins (ALOMY6G42549 and ALOMY1G09533) with similarities to FLOWERING LOCUS T (FT) are upregulated in Peldon (Fig. 7e). The two most upregulated DEG (as defined by fold change over control) that are not uncharacterised proteins (Tables S9 and S10) contain InterPro domains of IPR030670 for the 60S acidic ribosomal protein P0 (RPLP0, ALOMY1G04245) and IPR005958 for Tyrosine/nicotianamine aminotransferase (TAT, ALOMY3G13737) in Lola103 and Peldon, respectively (Fig. 7d, e).
These data suggests that the transcript profiles associated with metabolism-based resistance to herbicides and waterlogging tolerance overlap. Consistent with this, there is a weak positive correlation between the compiled waterlogging tolerance of these black-grass biotypes (Fig. S2) with previous measures of metabolism-based resistance in these same biotypes (Comont et al. 2020). Correlations between waterlogging tolerance and the ability to survive fenoxaprop-p-ethyl (r = 0.56, Fig. 7f) or mesosulfuron-methyl + iodosulfuron (r = 0.52, Fig. 7g) are evident. Resistance to both these herbicides primarily occurs through metabolism-based resistances and as explained above, these metabolism-based resistances are exemplified by increased abundance of detoxification enzymes including OPR1, various GSTs, and cytochrome P450 enzymes (Comont et al. 2020; Franco-Ortega et al. 2021; Cai et al. 2023). We see little evidence for correlation between waterlogging tolerance and ability to survive to cycloxydim (r = 0.25, Fig. 7h); this lack of correlation was expected as resistance to cycloxydim is primarily conferred through target site resistance (Comont et al. 2020). Our data raise the possibility that OPR1, and perhaps other DEG with xenobiotic detoxification activity such as SLC47A or GSTs, play dual roles in helping plants to survive both herbicide application and waterlogging stress.
Discussion
Our analysis of aerial tissue biomass showed that all biotypes of black-grass tested did equally well, if not better in waterlogged soil for up to 21 days. This is contrasted against all cultivars of wheat tested, which showed smaller aerial tissue biomass if waterlogged. Our experiments were conducted using young seedlings, as wheat is most sensitive to waterlogging stress after gemination but before emergence (Cannell et al. 1980) and early waterlogging stress reduces wheat yields by up to 86% of controls (Ploschuk et al. 2018). Moreover, managing early-season weed competition is crucial to minimise yield losses caused by weeds (Hartzler 2009). Therefore, as waterlogging stress impedes wheat but benefits black-grass growth, our data suggest that early waterlogging in fields with high black-grass pressure would have higher yield losses than would occur from either stress alone. As fields with dense populations of multiple-herbicide resistant black-grass are already widespread (Hicks et al. 2018; Varah et al. 2020), the frequency and intensity of waterlogging incidents are projected to rise due to ongoing climate change (Madakumbura et al. 2021). The compound yield losses that will occur in waterlogged, black-grass infested wheat fields pose a significant challenge to securing wheat productivity in affected areas.
Waterlogging tolerance in black-grass
Our molecular data indicate that black-grass is sensing and responding to the waterlogging stress, but we hypothesise that its comparatively large root aerenchyma air space (Figs 2 and S3) is preventing or reducing hypoxia stress, thus explaining the muted transcriptomic (Fig. 6) and metabolic (Figs 4 and 5) responses observed in the leaves of these plants. The aerenchyma-like structures we see in black-grass roots without waterlogging treatment (Figs 2 and S3) suggests that black-grass would be able to maintain gas exchange via the aerenchyma and/or aerenchyma-like structures and therefore continue normal growth and development under waterlogging conditions without the need for restructuring existing roots through programmed cell death (Xu et al. 2013), or altering hormones to generate new adventitious and axile roots (Nguyen et al. 2018). These findings suggest that the different root anatomy of black-grass plays an enabling role in its ability to cope with waterlogging stress and allows it to produce larger aerial tissue biomass compared to wheat when waterlogged. Alternatively, as the measurements were taken 3 weeks after the stress was first applied, it may be that black-grass has adapted to the stress faster and gene expression and metabolite concentrations have returned to levels similar to without stress.
The changes we observed in black-grass data support the hypothesis that there is a mechanistic link between the molecular mechanisms that black-grass uses to survive waterlogging and those involved in responses to other abiotic stress and herbicide resistance. We identified OPR1 specifically as the only transcript differentially expressed in both black-grass biotypes (Figs 6 and S7) and in agreement with that we also saw changes in specific metabolites in the OPDA-JA pathway (Figs 5 and S7). Increased abundance of OPR1 is correlated with metabolism-based resistance mechanisms from untargeted transcriptomic (Franco-Ortega et al. 2021) and proteomic (Tétard-Jones et al. 2018) analyses. Arabidopsis OPRs, including OPR1, are also upregulated after exposure to and are able to detoxify the explosive 2,4,6-Trinitrotoluene (TNT) (Beynon et al. 2009). Moreover, extensive characterisation of OPR family members in wheat, rice and Arabidopsis show OPR family members are important for responses to abiotic stresses, exogenous hormones and plant wounding (Li et al. 2011; Mou et al. 2019).
In addition to OPR1, two GSTs were upregulated in response to waterlogging stress in black-grass, with ALOMY6G45863 upregulated in Peldon and ALOMY2G24195 upregulated in Lola103 (Fig. 6c). GSTs function in abiotic stress tolerance, including through quenching reactive oxygen species to protect the cell from oxidative stress (Kumar and Trivedi 2018). Surprisingly, our analyses did not identify the very well-characterised AmGSTF1, a glutathione transferase (Cummins et al. 1997) that is necessary for resistance to the herbicide fenaxoprop (Mellado-Sánchez et al. 2020) and has been identified numerous times as being highly correlated with metabolism-based resistance (Tétard-Jones et al. 2018; Franco-Ortega et al. 2021; Cai et al. 2023). It therefore might have been expected to feature in the present analysis. Although the level of AmGSTF1 expression was altered by waterlogging, as was expression of another glutathione transferase AmGSTU2 and NADPH:quinone oxidoreductase 1 (AmNADPHQO1) (Tétard-Jones et al. 2018; Cai et al. 2023) (Fig. S7B), they were not sufficiently different between the treatments to have qualified as DEG. These and other transcripts associated with metabolism-based resistance (Franco-Ortega et al. 2021; Cai et al. 2023) are shown in Fig. S7B and Table S10.
When black-grass is under nutrient stress or in competition either with itself or wheat, the plants exhibiting a metabolism-based resistance phenotype are more competitive even in the absence of herbicide selection (Comont et al. 2019). Comont et al. (2019) separated a field-collected population exhibiting metabolism-based resistance into true-breeding herbicide resistant and sensitive sub-populations and showed that the herbicide resistant sub-population had larger aerial tissue biomass when competition levels were low, and these resistant plants were more competitive against wheat per gram of biomass. Unfortunately we cannot directly correlate this increased competitiveness with increased expression of OPR1 or other metabolism-based resistance-associated genes since gene expression was not measured in these plants; however the correlation analysis in Fig. 6e–g shows that the populations with larger aerial tissue biomass under waterlogging also showed increased survival to fenoxaprop in Comont et al. (2020), where this herbicide was used as a proxy for metabolism-based resistance. Altogether, our data suggest that in addition to the physiological advantage that the root aerenchyma would provide, that having the molecular fingerprints of metabolism-based resistance, specifically having increased expression of OPR1 and other GSTs, alongside increased expression or responsiveness of genes known to confer waterlogging tolerance (e.g. PCD1), gives black-grass a competitive advantage under waterlogging stress. It is also likely that waterlogging tolerance in black-grass capitalises on the metabolites that were altered or unique in black-grass, including the two major metabolites that were identified as citraconic acid and isovitexin-2″-O-arabinoside (Figs 4 and 5); the former is upregulated in plants in response to drought stress (Wang et al. 2022) or salt stress (Zhang et al. 2016), whereas the latter is an inactive flavonoid in Avena sativa (Mandeau et al. 2011).
Acetate was detectable only in black-grass samples and it was not significantly different between the treatments (Fig. 4). This was surprising because acetate metabolism and its links to carbohydrate fermentation has been identified as an evolutionarily conserved survival strategy for both drought and hypoxia responses with the amount of acetate produced directly correlated with survival mechanisms, including defence gene activation, biosynthesis of primary and secondary metabolites, and aerobic respiration (reviewed in Jardine and McDowell (2023). In drought-stressed Arabidopsis, there is a dynamic metabolic flux conversion from glycolysis into acetate synthesis and this conversion is triggered by the activation of a pyruvate decarboxylase (AtPDC1), which catalyses the first step in ethanolic fermentation, and an aldehyde dehydrogenase (AtALDH2B7). This is correlated with the activity of a histone deacetylase implicated in drought tolerance (AtHDA6) (Kim et al. 2017). AtPCD1 is required for anoxia tolerance and its expression is strongly induced in response to anoxia, as well as ABA, cold, salinity, mannitol, wounding, and paraquat (Kürsteiner et al. 2003). A putative black-grass PCD1 transcript (ALOMY2G23861) was identified as significantly different in the Lola103 transcriptome in response to waterlogging (Fig. 7c). Additionally, other genes characterised as PCD1 (ALOMY6G44321) and ALDH2B7 (ALOMY2G21934 and ALOMY4G27723) were upregulated in black-grass in the transcriptomic data, if not with sufficient significance to be identified as DEG (Fig. S7B, Table S10).
Waterlogging tolerance in wheat
The analyses herein, like others reviewed in Pan et al. (2021), show that wheat has changes in gene expression and metabolites in response to waterlogging. This is particularly true for Frument, which was previously characterised as intolerant to submergence stress (Herzog et al. 2018), and we observed significant changes in the leaf tissue with 148 transcripts and 14 of the 21 metabolites measured by 1H-NMR in response to waterlogging (Figs 4 and 5). Many of the wheat genes and metabolites changed in the analysed leaf tissue in response to waterlogging, especially sugars and amino acids, which have been previously identified as altered in response to anoxia (Huang et al. 2018). For example, A0A077S6T5 was found to be significantly upregulated by waterlogging in both wheat cultivars (Fig. 6d). This gene is also known as TaASR3B and is one of the 33 abscisic acid and water stress-induced transcription factors in the Abscisic acid-, stress-, and ripening-induced (ASR) family, which plays roles in plant growth, development, and abiotic stress responses (Li et al. 2020). Therefore the changes we observe in wheat are consistent with previous findings.
Sucrose, raffinose and fructose were also all only increased specifically in wheat leaf tissue compared to black-grass (Fig. 4). Therefore, it appears that black-grass does not use sugar responses in the same way as wheat, or it simply does not require changes in sugar concentration at this timepoint. Sugars have previously been implicated in waterlogging stress responses. Fructose and glucose were increased in waterlogged cucumber that translocates raffinose-related oligosaccharides, which through an interaction with auxin-signalling led to formation of adventitious roots (Qi et al. 2020). Sucrose accumulation results from reduced respiration and limited oxidative phosphorylation and it acts as a carbon source for energy production through glycolysis and fermentation pathways (Rolland et al. 2002). A wheat-specific increase was also seen for adenosine (Fig. 4). In Arabidopsis, adenosine concentration increased during reoxygenation after hypoxia and it was suggested that high adenosine helps meet the increased energy demand during reoxygenation (Fu and Xu 2023).
Comparison between species
Although between species comparisons are challenging for many reasons, uridine matches the relative phenotypic differences as it is more increased in the two more tolerant genotypes Jackson and Peldon, compared to their less tolerant counterparts Frument and Lola103 (Fig. 4). This was the only metabolite to show this pattern and suggests that differences in uridine concentration are correlated with waterlogging tolerance. This observation is particularly interesting as application of uridine has recently been investigated as a means to increase stress tolerances in plants (Cansev et al. 2014). Further work is required to determine the relevance of uridine for tolerance and how broadly applicable this is across cultivars or biotypes.
The role of amino acids in waterlogging tolerance has been established where major changes in concentration, typically increases, have been observed under stress because of protein degradation (Ma et al. 2022). In our study, the concentration of alanine went down in black-grass but up in wheat (Fig. 4). Other studies have shown that concentrations of alanine is increased in roots of oxygen-deficient maize (Roberts et al. 1992) or rice (Reggiani et al. 2000) and hypoxia-induced increase in expression of the alanine aminotransferase homologue AlaAT1 in wheat has been demonstrated (Kendziorek et al. 2012). In Arabidopsis, alanine increases during hypoxia, whereas valine and glutamine decrease (Fu and Xu 2023). Valine and adenosine were both increased in wheat but unchanged in black-grass. Similarly, glutamine decreased in black-grass but it did not change in wheat, in contrast to glutamic acid which decreased in wheat but was unchanged in black-grass (Fig. 4). Exogenous application of glutamic acid, a precursor to essential amino acids, to different crops effectively reduced osmotic, salt, nitrogen deficiency and low temperature stresses (reviewed in Lee et al. 2021). In the hypoxia-inducible factor (HIF) pathway amino acid metabolism of aspartic acid, glutamic acid, and glutamine contribute to the cellular and molecular responses to hypoxia, aiding in energy production and signalling processes necessary for the survival and adaptation of organisms under low-oxygen conditions (Zhang et al. 2021).
In addition to acetate, discussed above, other measured metabolites showed no significant differences, although their role in anoxia tolerance has been previously established in the literature. Although gamma-aminobutyric acid (GABA) has been shown to increase several orders of magnitude in Arabidopsis (Wu et al. 2021), maize (Roberts et al. 1992) or rice (Reggiani et al. 2000) in response to waterlogging we see it was only significantly different in waterlogged Jackson and even then only 1.2-fold increased (Fig. 4). Similarly, choline is a precursor of betaine that forms glycinebetaine, a known stress response molecule (Giri 2011). However, although choline was significantly increased in both black-grass biotypes, it was only up 1.1-fold over the controls and both wheat cultivars have equivalent levels in waterlogging and control conditions (Fig. 3). Betaine is only detectable in the wheat cultivars but it was significantly decreased in both. Glycinebetaine was not measured in these analyses (Fig. 4). Therefore, not all expected changes are being seen in our dataset.
It will also be useful to determine the molecular–physiological waterlogging responses in roots that are directly exposed to hypoxia. We performed leaf sampling with the aim of identifying whole-plant responses to the waterlogging treatment. Others have previously used similar methods for metabolomics or transcriptomics (Lee et al. 2014; Hong et al. 2023) and more specifically shown that waterlogging applied at the root leads to significant metabolic changes in the aerial tissues, which reduce growth and limit plant productivity (Hill et al. 2023). Follow up studies of black-grass that focus specifically on assessing root-specific transcriptomic and/or metabolomic responses, perhaps with multiple sampling points through time, could identify other differences than we were unable to observe here.
General conclusion
This study compares the waterlogging tolerance mechanisms between black-grass and wheat, highlighting differences in metabolite concentrations and gene expression patterns within and between species that contribute to their respective tolerances. As predicted from field observations, we show black-grass and wheat respond differently to waterlogging. Our data suggests that waterlogging tolerance in black-grass is conferred by both the constitutive presence of aerenchyma and additional molecular mechanisms that perhaps overlap with those that confer metabolism-based resistance, particularly increased expression of OPR and its downstream metabolites. Our analysis of winter wheat varieties shows that intraspecies variation for waterlogging tolerance exists and identifies phosphate homeostasis and signalling as well as activity of glycerophosphodiester phosphodiesterases are important for waterlogging responses. Similar to previous findings we find that wheat increases sugars and specific amino acids in response to waterlogging. Our conclusions will be useful for informing agricultural practice decisions such as crop selection and management in the face of climate change and pressure from herbicide resistant black-grass.
Data availability
The sequence data analysed in this study will be available from the NCBI Bioproject database (accession: PRJNA1009248) following publication as BioSamples SAMN37356815-37356853, SRR26036855-26036893. In accordance with a commitment to FAIR principles (Wilkinson et al. 2016), all relevant raw data supporting the findings of this study have been provided in the Supplementary Materials including the metabolomics data. Further data are available in the Supplementary Tables and Figures.
Declaration of funding
Rothamsted Research receives strategic funding from the Biotechnology and Biological Sciences Research Council of the United Kingdom (BBSRC). DM acknowledges support from the Growing Health Institute Strategic Programme [BB/X010953/1; BBS/E/RH/230003A]. CH was supported on internal funding as part of the Science Initiative Catalyst Awards.
Acknowledgements
The authors thank Max Herzog for providing wheat seed and useful discussions about waterlogging resistance in wheat and Orla Sherwood for aerenchyma induction protocol and useful discussions about hypoxia induction. They acknowledge Claudia Harflett for work done to prepare the plant samples for metabolomics analysis. They thank Rothamsted Bioimaging Facility for help with the microscopic analysis and the Rothamsted Horticulture and Controlled Environment teams for help maintaining the plants. They acknowledge BGI for the RNA extraction, library preparation and sequencing for transcriptomics.
References
Ashburner M, Ball CA, Blake JA, Botstein D, Butler H, Cherry JM, Davis AP, Dolinski K, Dwight SS, Eppig JT, Harris MA, Hill DP, Issel-Tarver L, Kasarskis A, Lewis S, Matese JC, Richardson JE, Ringwald M, Rubin GM, Sherlock G (2000) Gene ontology: tool for the unification of biology. Nature Genetics 25(1), 25-29.
| Crossref | Google Scholar | PubMed |
Beynon ER, Symons ZC, Jackson RG, Lorenz A, Rylott EL, Bruce NC (2009) The role of oxophytodienoate reductases in the detoxification of the explosive 2,4,6-trinitrotoluene by Arabidopsis. Plant Physiology 151(1), 253-261.
| Crossref | Google Scholar | PubMed |
BGRI (2019) Black-grass herbicide resistance initiative (BGRI): multiple herbicide resistance in grass weeds: from genes to agroecosystems [project report]. AHDB Project Reports, 601. (BGRI) Available at https://cereals.ahdb.org.uk/media/1501380/pr601-final-project-report-v2.pdf
Branco-Price C, Kawaguchi R, Ferreira RB, Bailey-Serres J (2005) Genome-wide analysis of transcript abundance and translation in Arabidopsis seedlings subjected to oxygen deprivation. Annals of Botany 96(4), 647-660.
| Crossref | Google Scholar | PubMed |
Cai L, Comont D, MacGregor D, Lowe C, Beffa R, Neve P, Saski C (2023) The blackgrass genome reveals patterns of non-parallel evolution of polygenic herbicide resistance. New Phytologist 237, 1891-1907.
| Crossref | Google Scholar | PubMed |
Cannell RQ, Belford RK, Gales K, Dennis CW, Prew RD (1980) Effects of waterlogging at different stages of development on the growth and yield of winter wheat. Journal of the Science of Food and Agriculture 31(2), 117-132.
| Crossref | Google Scholar |
Chen Y, Song W, Xie X, Wang Z, Guan P, Peng H, Jiao Y, Ni Z, Sun Q, Guo W (2020) A collinearity-incorporating homology inference strategy for connecting emerging assemblies in the triticeae tribe as a pilot practice in the plant pangenomic era. Molecular Plant 13(12), 1694-1708.
| Crossref | Google Scholar | PubMed |
Chen S-Y, Zhang H-P, Li J, Shi J-H, Tang H-W, Zhang Y, Zhang J-K, Wen P-H, Wang Z-H, Shi X-Y, He Y-T, Hu B-W, Yang H, Guo W-Z, Zhang S-J (2021) Tripartite motif-containing 27 attenuates liver ischemia/reperfusion injury by suppressing transforming growth factor β-activated kinase 1 (TAK1) by TAK1 binding protein 2/3 degradation. Hepatology 73(2), 738-758.
| Crossref | Google Scholar | PubMed |
Comont D, Knight C, Crook L, Hull R, Beffa R, Neve P (2019) Alterations in life-history associated with non-target-site herbicide resistance in Alopecurus myosuroides. Frontiers in Plant Science 10, 837.
| Crossref | Google Scholar |
Comont D, Lowe C, Hull R, Crook L, Hicks HL, Onkokesung N, Beffa R, Childs DZ, Edwards R, Freckleton RP, Neve P (2020) Evolution of generalist resistance to herbicide mixtures reveals a trade-off in resistance management. Nature Communications 11(1), 3086.
| Crossref | Google Scholar |
Comont D, MacGregor DR, Crook L, Hull R, Nguyen L, Freckleton RP, Childs DZ, Neve P (2022) Dissecting weed adaptation: fitness and trait correlations in herbicide-resistant Alopecurus myosuroides. Pest Management Science 78(7), 3039-3050.
| Crossref | Google Scholar |
Cummins I, Moss S, Cole DJ, Edwards R (1997) Glutathione transferases in herbicide-resistant and herbicide-susceptible black-grass (Alopecurus myosuroides). Pesticide Science 51(3), 244-250.
| Crossref | Google Scholar |
Franco-Ortega S, Goldberg-Cavalleri A, Walker A, Brazier-Hicks M, Onkokesung N, Edwards R (2021) Non-target site herbicide resistance is conferred by two distinct mechanisms in black-grass (Alopecurus myosuroides). Frontiers in Plant Science 12(194), 636652.
| Crossref | Google Scholar |
Fu X, Xu Y (2023) Dynamic metabolic changes in Arabidopsis seedlings under hypoxia stress and subsequent reoxygenation recovery. Stresses 3(1), 86-101.
| Crossref | Google Scholar |
Giri J (2011) Glycinebetaine and abiotic stress tolerance in plants. Plant Signaling & Behavior 6(11), 1746-1751.
| Crossref | Google Scholar |
González M-C, Sánchez R, Cejudo FJ (2003) Abiotic stresses affecting water balance induce phosphoenolpyruvate carboxylase expression in roots of wheat seedlings. Planta 216(6), 985-992.
| Crossref | Google Scholar | PubMed |
Hartzler RG (2009) Early-season weed competition in corn. Available at http://dx.doi.org/10.31274/farmprogressreports-180814-1014
Hassani-Pak K, Singh A, Brandizi M, Hearnshaw J, Parsons JD, Amberkar S, Phillips AL, Doonan JH, Rawlings C (2021) KnetMiner: a comprehensive approach for supporting evidence-based gene discovery and complex trait analysis across species. Plant Biotechnology Journal 19(8), 1670-1678.
| Crossref | Google Scholar | PubMed |
Hasseb NM, Sallam A, Karam MA, Gao L, Wang RRC, Moursi YS (2022) High-LD SNP markers exhibiting pleiotropic effects on salt tolerance at germination and seedlings stages in spring wheat. Plant Molecular Biology 108(6), 585-603.
| Crossref | Google Scholar | PubMed |
Herzog M, Fukao T, Winkel A, Konnerup D, Lamichhane S, Alpuerto JB, Hasler-Sheetal H, Pedersen O (2018) Physiology, gene expression, and metabolome of two wheat cultivars with contrasting submergence tolerance. Plant, Cell & Environment 41(7), 1632-1644.
| Crossref | Google Scholar | PubMed |
Hicks HL, Comont D, Coutts SR, Crook L, Hull R, Norris K, Neve P, Childs DZ, Freckleton RP (2018) The factors driving evolved herbicide resistance at a national scale. Nature Ecology & Evolution 2(3), 529-536.
| Crossref | Google Scholar | PubMed |
Hill RD, de Castro J, Mira MM, Igamberdiev AU, Hebelstrup KH, Renault S, Xu W, Badea A, Stasolla C (2023) Over-expression of the barley Phytoglobin 1 (HvPgb1) evokes leaf-specific transcriptional responses during root waterlogging. Journal of Plant Physiology 283, 153944.
| Crossref | Google Scholar |
Hong B, Zhou B, Peng Z, Yao M, Wu J, Wu X, Guan C, Guan M (2023) Tissue-specific transcriptome and metabolome analysis reveals the response mechanism of Brassica napus to waterlogging stress. International Journal of Molecular Sciences 24(7), 6015.
| Crossref | Google Scholar |
Huang B, Johnson JW (1995) Root respiration and carbohydrate status of two wheat genotypes in response to hypoxia. Annals of Botany 75(4), 427-432.
| Crossref | Google Scholar |
Huang B, Johnson JW, Box JE, NeSmith DS (1997) Root characteristics and hormone activity of wheat in response to hypoxia and ethylene. Crop Science 37(3), 812-818.
| Crossref | Google Scholar |
Huang S, Shingaki-Wells RN, Petereit J, Alexova R, Millar AH (2018) Temperature-dependent metabolic adaptation of Triticum aestivum seedlings to anoxia. Scientific Reports 8(1), 6151.
| Crossref | Google Scholar |
Jardine KJ, McDowell N (2023) Fermentation-mediated growth, signaling, and defense in plants. New Phytologist 239(3), 839-851.
| Crossref | Google Scholar | PubMed |
Kazerooni EA, Al-Sadi AM, Rashid U, Kim I-D, Kang S-M, Lee I-J (2022) Salvianolic acid modulates physiological responses and stress-related genes that affect osmotic stress tolerance in Glycine max and Zea mays. Frontiers in Plant Science 13, 904037.
| Crossref | Google Scholar |
Kendziorek M, Paszkowski A, Zagdańska B (2012) Differential regulation of alanine aminotransferase homologues by abiotic stresses in wheat (Triticum aestivum L.) seedlings. Plant Cell Reports 31(6), 1105-1117.
| Crossref | Google Scholar | PubMed |
Kim J-M, To TK, Matsui A, Tanoi K, Kobayashi NI, Matsuda F, Habu Y, Ogawa D, Sakamoto T, Matsunaga S, Bashir K, Rasheed S, Ando M, Takeda H, Kawaura K, Kusano M, Fukushima A, Endo TA, Kuromori T, Ishida J, Morosawa T, Tanaka M, Torii C, Takebayashi Y, Sakakibara H, Ogihara Y, Saito K, Shinozaki K, Devoto A, Seki M (2017) Acetate-mediated novel survival strategy against drought in plants. Nature Plants 3(7), 17097.
| Crossref | Google Scholar |
Kim D, Paggi JM, Park C, Bennett C, Salzberg SL (2019) Graph-based genome alignment and genotyping with HISAT2 and HISAT-genotype. Nature Biotechnology 37(8), 907-915.
| Crossref | Google Scholar | PubMed |
Kumar S, Trivedi PK (2018) Glutathione S-transferases: role in combating abiotic stresses including arsenic detoxification in plants. Frontiers in Plant Science 9, 751.
| Crossref | Google Scholar |
Kürsteiner O, Dupuis I, Kuhlemeier C (2003) The Pyruvate decarboxylase1 gene of Arabidopsis is required during anoxia but not other environmental stresses. Plant Physiology 132(2), 968-978.
| Crossref | Google Scholar |
Lee TA, Bailey-Serres J (2019) Integrative analysis from the epigenome to translatome uncovers patterns of dominant nuclear regulation during transient stress. The Plant Cell 31(11), 2573-2595.
| Crossref | Google Scholar |
Lee Y-H, Kim K-S, Jang Y-S, Hwang J-H, Lee D-H, Choi I-H (2014) Global gene expression responses to waterlogging in leaves of rape seedlings. Plant Cell Reports 33(2), 289-299.
| Crossref | Google Scholar | PubMed |
Lee HJ, Lee JH, Wi S, Jang Y, An S, Choi CK, Jang S (2021) Exogenously applied glutamic acid confers improved yield through increased photosynthesis efficiency and antioxidant defense system under chilling stress condition in Solanum lycopersicum L. cv. Dotaerang Dia. Scientia Horticulturae 277, 109817.
| Crossref | Google Scholar |
Li W, Zhou F, Liu B, Feng D, He Y, Qi K, Wang H, Wang J (2011) Comparative characterization, expression pattern and function analysis of the 12-oxo-phytodienoic acid reductase gene family in rice. Plant Cell Reports 30(6), 981-995.
| Crossref | Google Scholar | PubMed |
Li C, Yeh F-L, Cheung AY, Duan Q, Kita D, Liu M-C, Maman J, Luu EJ, Wu BW, Gates L, Jalal M, Kwong A, Carpenter H, Wu H-M (2015) Glycosylphosphatidylinositol-anchored proteins as chaperones and co-receptors for FERONIA receptor kinase signaling in Arabidopsis. eLife 4, e06587.
| Crossref | Google Scholar |
Li H, Guan H, Zhuo Q, Wang Z, Li S, Si J, Zhang B, Feng B, Kong L-A, Wang F, Wang Z, Zhang L (2020) Genome-wide characterization of the abscisic acid-, stress- and ripening-induced (ASR) gene family in wheat (Triticum aestivum L.). Biological Research 53(1), 23.
| Crossref | Google Scholar |
Liao Y, Smyth GK, Shi W (2014) featureCounts: an efficient general purpose program for assigning sequence reads to genomic features. Bioinformatics 30(7), 923-930.
| Crossref | Google Scholar |
Liu K, Harrison MT, Yan H, Liu DL, Meinke H, Hoogenboom G, Wang B, Peng B, Guan K, Jaegermeyr J, Wang E, Zhang F, Yin X, Archontoulis S, Nie L, Badea A, Man J, Wallach D, Zhao J, Benjumea AB, Fahad S, Tian X, Wang W, Tao F, Zhang Z, Rötter R, Yuan Y, Zhu M, Dai P, Nie J, Yang Y, Zhang Y, Zhou M (2023) Silver lining to a climate crisis in multiple prospects for alleviating crop waterlogging under future climates. Nature Communications 14(1), 765.
| Crossref | Google Scholar |
Loreti E, Perata P (2020) The many facets of hypoxia in plants. Plants 9(6), 745.
| Crossref | Google Scholar |
Love MI, Huber W, Anders S (2014) Moderated estimation of fold change and dispersion for RNA-seq data with DESeq2. Genome Biology 15(12), 550.
| Crossref | Google Scholar |
Luhua S, Hegie A, Suzuki N, Shulaev E, Luo X, Cenariu D, Ma V, Kao S, Lim J, Gunay MB, Oosumi T, Lee SC, Harper J, Cushman J, Gollery M, Girke T, Bailey-Serres J, Stevenson RA, Zhu J-K, Mittler R (2013) Linking genes of unknown function with abiotic stress responses by high-throughput phenotype screening. Physiologia Plantarum 148(3), 322-333.
| Crossref | Google Scholar | PubMed |
Ma J, Rukh G, Ruan Z, Xie X, Ye Z, Liu D (2022) Effects of hypoxia stress on growth, root respiration, and metabolism of Phyllostachys praecox. Life 12(6), 808.
| Crossref | Google Scholar |
Madakumbura GD, Thackeray CW, Norris J, Goldenson N, Hall A (2021) Anthropogenic influence on extreme precipitation over global land areas seen in multiple observational datasets. Nature Communications 12(1), 3944.
| Crossref | Google Scholar |
Mandeau A, Aries M-F, Boé J-F, Brenk M, Crebassa-Trigueros V, Vaissière C, Teysseyre V, Bieber T (2011) Rhealba® oat plantlet extract: evidence of protein-free content and assessment of regulatory activity on immune inflammatory mediators. Planta Medica 77(9), 900-906.
| Crossref | Google Scholar |
Mareya CR, Tugizimana F, Piater LA, Madala NE, Steenkamp PA, Dubery IA (2019) Untargeted metabolomics reveal defensome-related metabolic reprogramming in Sorghum bicolor against infection by Burkholderia andropogonis. Metabolites 9(1), 8.
| Crossref | Google Scholar |
Mellado-Sánchez M, McDiarmid F, Cardoso V, Kanyuka K, MacGregor DR (2020) Virus-mediated transient expression techniques enable gene function studies in black-grass. Plant Physiology 183(2), 455-459.
| Crossref | Google Scholar | PubMed |
Metcalfe H, Milne AE, Webster R, Lark RM, Murdoch AJ, Kanelo L, Storkey J (2018) Defining the habitat niche of Alopecurus myosuroides at the field scale. Weed Research 58(3), 165-176.
| Crossref | Google Scholar | PubMed |
Mohammad VH, Osborne CP, Freckleton RP (2022) Drought exposure leads to rapid acquisition and inheritance of herbicide resistance in the weed Alopecurus myosuroides. Ecology and Evolution 12(2), e8563.
| Crossref | Google Scholar |
Moss S (1985) Effect of drilling date, pre-drilling cultivations and herbicides on Alopecurus myosuroides (black-grass) populations in winter cereals. Aspects of Applied Biology 9, 31-39.
| Google Scholar |
Moss SR, Cocker KM, Brown AC, Hall L, Field LM (2003) Characterisation of target-site resistance to ACCase-inhibiting herbicides in the weed Alopecurus myosuroides (black-grass). Pest Management Science 59(2), 190-201.
| Crossref | Google Scholar | PubMed |
Moss SR, Storkey J, Cussans JW, Perryman SAM, Hewitt MV (2004) The Broadbalk long-term experiment at Rothamsted: what has it told us about weeds? Weed Science 52(5), 864-873.
| Crossref | Google Scholar |
Mou Y, Liu Y, Tian S, Guo Q, Wang C, Wen S (2019) Genome-wide identification and characterization of the OPR gene family in wheat (Triticum aestivum L.). International Journal of Molecular Sciences 20(8), 1914.
| Crossref | Google Scholar |
Naylor REL (1972) Biological flora of the British Isles. No. 129 Alopecurus myosuroides Huds. (A. agrestis L.). Journal of Ecology 60, 611-622.
| Crossref | Google Scholar |
Nguyen T-N, Tuan PA, Mukherjee S, Son SH, Ayele BT (2018) Hormonal regulation in adventitious roots and during their emergence under waterlogged conditions in wheat. Journal of Experimental Botany 69(16), 4065-4082.
| Crossref | Google Scholar | PubMed |
Noleto-Dias C, Wu Y, Bellisai A, Macalpine W, Beale MH, Ward JL (2019) Phenylalkanoid glycosides (non-salicinoids) from wood chips of Salix triandra × dasyclados Hybrid Willow. Molecules 24(6), 1152.
| Crossref | Google Scholar |
Pan J, Sharif R, Xu X, Chen X (2021) Mechanisms of waterlogging tolerance in plants: research progress and prospects. Frontiers in Plant Science 11, 627331.
| Crossref | Google Scholar |
Ploschuk RA, Miralles DJ, Colmer TD, Ploschuk EL, Striker GG (2018) Waterlogging of winter crops at early and late stages: impacts on leaf physiology, growth and yield. Frontiers in Plant Science 9, 1863.
| Crossref | Google Scholar |
Prasad G, Mittal S, Kumar A, Chauhan D, Sahu TK, Kumar S, Singh R, Yadav MC, Singh AK (2021) Transcriptome analysis of bread wheat genotype KRL3-4 provides a new insight into regulatory mechanisms associated with sodicity (high pH) tolerance. Frontiers in Genetics 12, 782366.
| Crossref | Google Scholar |
Qi X, Li Q, Shen J, Qian C, Xu X, Xu Q, Chen X (2020) Sugar enhances waterlogging-induced adventitious root formation in cucumber by promoting auxin transport and signalling. Plant, Cell & Environment 43(6), 1545-1557.
| Crossref | Google Scholar |
Radchenko M, Ponomareva I, Pozynych I, Morderer Y (2021) Stress and use of herbicides in field crops. Agricultural Science and Practice 8(3), 50-70.
| Crossref | Google Scholar |
Reggiani R, Nebuloni M, Mattana M, Brambilla I (2000) Anaerobic accumulation of amino acids in rice roots: role of the glutamine synthetase/glutamate synthase cycle. Amino Acids 18(3), 207-217.
| Crossref | Google Scholar |
Roberts JKM, Hooks MA, Miaullis AP, Edwards S, Webster C (1992) Contribution of malate and amino acid metabolism to cytoplasmic pH regulation in hypoxic maize root tips studied using nuclear magnetic resonance spectroscopy. Plant Physiology 98(2), 480-487.
| Crossref | Google Scholar |
Rolland F, Moore B, Sheen J (2002) Sugar sensing and signaling in plants. The Plant Cell 14(Suppl 1), S185-S205.
| Crossref | Google Scholar |
Sadak MS, Ramadan AAE-M (2021) Impact of melatonin and tryptophan on water stress tolerance in white lupine (Lupinus termis L.). Physiology and Molecular Biology of Plants 27(3), 469-481.
| Crossref | Google Scholar |
Shen Q, Bourdais G, Pan H, Robatzek S, Tang D (2017) Arabidopsis glycosylphosphatidylinositol-anchored protein LLG1 associates with and modulates FLS2 to regulate innate immunity. Proceedings of the National Academy of Sciences 114(22), 5749-5754.
| Crossref | Google Scholar |
Stintzi A, Browse J (2000) The Arabidopsis male-sterile mutant, opr3, lacks the 12-oxophytodienoic acid reductase required for jasmonate synthesis. Proceedings of the National Academy of Sciences 97(19), 10625-10630.
| Crossref | Google Scholar |
Sundgren TK, Uhlen AK, Waalen W, Lillemo M (2018) Field screening of waterlogging tolerance in spring wheat and spring barley. Agronomy 8(4), 38.
| Crossref | Google Scholar |
Tétard-Jones C, Sabbadin F, Moss S, Hull R, Neve P, Edwards R (2018) Changes in the proteome of the problem weed blackgrass correlating with multiple-herbicide resistance. The Plant Journal 94(4), 709-720.
| Crossref | Google Scholar | PubMed |
The Gene Ontology Consortium (2021) The gene ontology resource: enriching a GOld mine. Nucleic Acids Research 49(D1), D325-D334.
| Crossref | Google Scholar |
Torra J, Alcántara-de la Cruz R (2022) Molecular mechanisms of herbicide resistance in weeds. Genes 13(11), 2025.
| Crossref | Google Scholar |
Torra J, Osuna MD, Merotto A, Vila-Aiub M (2021) Editorial: multiple herbicide-resistant weeds and non-target site resistance mechanisms: a global challenge for food production. Frontiers in Plant Science 12(2372), 763212.
| Crossref | Google Scholar |
Varah A, Ahodo K, Coutts SR, Hicks HL, Comont D, Crook L, Hull R, Neve P, Childs DZ, Freckleton RP, Norris K (2020) The costs of human-induced evolution in an agricultural system. Nature Sustainability 3(1), 63-71.
| Crossref | Google Scholar | PubMed |
Wang X, Wang H-F, Chen Y, Sun M-M, Wang Y, Chen Y-F (2020) The transcription factor NIGT1.2 modulates both phosphate uptake and nitrate influx during phosphate starvation in Arabidopsis and maize. The Plant Cell 32(11), 3519-3534.
| Crossref | Google Scholar |
Wang F, Wei Y, Yan T, Wang C, Chao Y, Jia M, An L, Sheng H (2022) Sphingomonas sp. Hbc-6 alters physiological metabolism and recruits beneficial rhizosphere bacteria to improve plant growth and drought tolerance. Frontiers in Plant Science 13, 1002772.
| Crossref | Google Scholar |
Wilkinson MD, Dumontier M, Aalbersberg IJJ, Appleton G, Axton M, Baak A, Blomberg N, Boiten J-W, da Silva Santos LB, Bourne PE, Bouwman J, Brookes AJ, Clark T, Crosas M, Dillo I, Dumon O, Edmunds S, Evelo CT, Finkers R, Gonzalez-Beltran A, Gray AJG, Groth P, Goble C, Grethe JS, Heringa J, ’t Hoen PAC, Hooft R, Kuhn T, Kok R, Kok J, Lusher SJ, Martone ME, Mons A, Packer AL, Persson B, Rocca-Serra P, Roos M, van Schaik R, Sansone S-A, Schultes E, Sengstag T, Slater T, Strawn G, Swertz MA, Thompson M, van der Lei J, van Mulligen E, Velterop J, Waagmeester A, Wittenburg P, Wolstencroft K, Zhao J, Mons B (2016) The FAIR guiding principles for scientific data management and stewardship. Scientific Data 3(1), 160018.
| Crossref | Google Scholar |
Wu Q, Su N, Huang X, Cui J, Shabala L, Zhou M, Yu M, Shabala S (2021) Hypoxia-induced increase in GABA content is essential for restoration of membrane potential and preventing ROS-induced disturbance to ion homeostasis. Plant Communications 2(3), 100188.
| Crossref | Google Scholar |
Xie L-J, Chen Q-F, Chen M-X, Yu L-J, Huang L, Chen L, Wang F-Z, Xia F-N, Zhu T-R, Wu J-X, Yin J, Liao B, Shi J, Zhang J-H, Aharoni A, Yao N, Shu W, Xiao S (2015) Unsaturation of very-long-chain ceramides protects plant from hypoxia-induced damages by modulating ethylene signaling in Arabidopsis. PLoS Genetics 11(3), e1005143.
| Crossref | Google Scholar |
Xu QT, Yang L, Zhou ZQ, Mei FZ, Qu LH, Zhou GS (2013) Process of aerenchyma formation and reactive oxygen species induced by waterlogging in wheat seminal roots. Planta 238(5), 969-982.
| Crossref | Google Scholar | PubMed |
Zhang J, Yang D, Li M, Shi L (2016) Metabolic profiles reveal changes in wild and cultivated soybean seedling leaves under salt stress. PLoS ONE 11(7), e0159622.
| Crossref | Google Scholar |
Zhang B, Chen Y, Shi X, Zhou M, Bao L, Hatanpaa KJ, Patel T, DeBerardinis RJ, Wang Y, Luo W (2021) Regulation of branched-chain amino acid metabolism by hypoxia-inducible factor in glioblastoma. Cellular and Molecular Life Sciences 78(1), 195-206.
| Crossref | Google Scholar |