

Introducing the halophyte Salicornia europaea to investigate combined impact of salt and tidal submergence conditions
Angelina Jordine A * , Julia Retzlaff A , Lina Gens A , Brigitta Ehrt A , Lisa Fürtauer B and Joost T. van Dongen A *
A
B
Handling Editor: Ole Pedersen
Abstract
Tolerance mechanisms to single abiotic stress events are being investigated in different plant species, but how plants deal with multiple stress factors occurring simultaneously is still poorly understood. Here, we introduce Salicornia europaea as a species with an extraordinary tolerance level to both flooding and high salt concentrations. Plants exposed to 0.5 M NaCl (mimicking sea water concentrations) grew larger than plants not exposed to salt. Adding more salt reduced growth, but concentrations up to 2.5 M NaCl were not lethal. Regular tidal flooding with salt water (0.5 M NaCl) did not affect growth or chlorophyll fluorescence, whereas continuous flooding stopped growth while plants survived. Quantitative polymerase chain reaction (qPCR) analysis of plants exposed to 1% oxygen in air revealed induction of selected hypoxia responsive genes, but these genes were not induced during tidal flooding, suggesting that S. europaea did not experience hypoxic stress. Indeed, plants were able to transport oxygen into waterlogged soil. Interestingly, sequential exposure to salt and hypoxic air changed the expression of several but not all genes as compared to their expression upon hypoxia only, demonstrating the potential to use S. europaea to investigate signalling-crosstalk between tolerance reactions to multiple environmental perturbations.
Keywords: extremophile, flooding, halophyte, hypoxia, Salicornia europaea, salt, stress response, tolerance.
Introduction
Throughout evolution, environmental conditions have influenced the adaptation and diversification of plants. The additional competition between plant species resulted in a specialisation of plants in their respective ecological niches (Kenrick and Crane 1997; Holt 2009; Turnbull et al. 2016). When plants adapt to an environmental condition rather than compete with other species, they became tolerant. The development of tolerance mechanisms has allowed plants to establish themselves in most extreme territories of the world (Waters 2003) like deserts, the Arctic, alpine or coastal regions (Billings and Mooney 1968; Bliss 1971; Gutterman 2012). Since tolerance mechanisms should be tested on tolerant plants, it is ideal to use plants from such areas to study the tolerance mechanism for the particular environmental conditions.
Salinity and flooding are both compound stresses that influence physiological and biochemical processes. Under salt stress, ion homeostasis has to be regulated to avoid osmotic stress or ionic toxicity (Yang and Guo 2018). Flooding causes reduced gas exchange, reduced light intensity, and reduced soil oxidation with implications for energy supply (Mommer et al. 2005). Since abiotic conditions affect the efficiency of photosynthesis, which is the main energy delivering process in plants, chlorophyll fluorescence measurements are used to monitor the physiological state of plants (Baker 2008; Biswal et al. 2011). As an effect of salt and flooding conditions maximum quantum yield at the PSII is reduced (Kalaji et al. 2016). Every reduction in the photosynthetic performance leads to reduced energy supply and ultimately to morphological changes (Mommer et al. 2005; Acosta-Motos et al. 2017). For flooding conditions, two main strategies are known in plants to overcome a flooding period (Nagai et al. 2010). Upon flooding, energy consumption and elongation can be suppressed to endure submergence (quiescence strategy). Alternatively, stem elongation can be activated to keep the top leaves above the water surface for improving gas exchange and photosynthesis (escape strategy) (Bailey-Serres and Voesenek 2008). However, under saline conditions, plant growth is generally reduced (Rengasamy and Olsson 1993; Acosta-Motos et al. 2017).
One consequence of the progressing climate change is an extreme fluctuation in environmental conditions. An example for this is a stronger oscillation in rainfall intensity that plants must survive. This includes not only drought, but also heavy rain and flooding periods (Hirabayashi et al. 2013). In conjunction with sea level rise, a combination of salinisation and flooding is occurring with increasing frequency. Unlike the study of single conditions, the effect of multiple conditions simultaneously has been analysed to a comparatively small extent. In this context, studies of simultaneous drought and heat conditions already show that adaptive responses to simultaneous conditions cannot be extrapolated directly from the response of plants to each individual factor (Rizhsky et al. 2004; Mahalingam 2015; Mahalingam et al. 2021). Under oxygen deficiency, respiration in root tissue of Pisum sativum (pea) decreased while salt stress mainly increases or has no effect on respiration, depending on the species (Zabalza et al. 2009; Jacoby et al. 2011). The PROTEOLYSIS 6 branch of the N-degron pathway is known for its important role in the oxygen sensing mechanism (Licausi et al. 2011). The same pathway modulates the salt tolerance in Arabidopsis thaliana hinting towards a common mechanism (Lamichhane et al. 2020). How simultaneous salt and low oxygen stress influence these adaptive responses and whether a link between both conditions via the N-degron pathway exists is not known. Therefore, the investigation of combined flood and salt stress is essential to understand acclimation responses of plants to multiple stressors.
Coastal regions and salt marshes are habitats where flooding and saline conditions naturally occur together (Zedler et al. 2008). Depending on the height above the mean sea level, a salt marsh can be divided into three different growth zones: (1) upper salt marsh; (2) lower salt marsh; and (3) pioneer zone where only a few specialised species settle permanently (Glup 1985). Across the three growth zones, halophytic species have different strategies and adaptive mechanisms to live through the regular inundations of saltwater. Halophytes can tolerate high external salt concentrations in one of three ways: (1) exclusion of salt with granular cells, bladder hairs or shed of whole leaves (Koyro 2002); (2) inclusion of salt with vacuolar storage (Breckle 2002); or (3) restricted salt inclusion by stem cells (Acosta-Motos et al. 2017). Salt tolerance involves not only morphological adaptations, but also includes all physiological regulatory processes that lead to these adaptations.
Tolerance mechanisms to salinity or flooding conditions have already been studied extensively in plants that are not tolerant to these conditions (Bray et al. 2000; Loreti and Perata 2020; Patel et al. 2020). Here, we present the euhalophyte Salicornia europaea to investigate the mechanism underlying tolerance to combined salinity and flooding conditions. S. europaea is a succulent plant and belongs to the family Amaranthaceae (Steffen et al. 2015). It is a species that colonise the pioneer zone of coastal regions and saltmarshes around the globe (Chapman 1974; Redelstein et al. 2018). Both habitats have high salinities (at the same level as or higher than seawater, ~3% = 0.513 M) and are influenced by tidal floods (Zedler et al. 2008). For optimal growth, S. europaea needs 200–400 mM NaCl but it is also able to tolerate more than 1000 mM NaCl (Lv et al. 2012). This optimal growth (measured as yield and dry weight of shoot and root) under saline conditions; however, is not affected by waterlogging (Cooper 1982). Until now, S. europaea was primarily used to investigate adaptive responses to salt (Fan et al. 2013; Ma et al. 2013; Mishra and Tanna 2017; Salazar et al. 2023). Hence, compartmentalisation of Na+ into the vacuole of S. europaea is known to maintain cell turgor, enhance photosynthetic performance and plant growth (Lv et al. 2012). Due to its natural habitat, S. europaea is also adapted to flooding conditions (Keiffer et al. 1994), which is why we want to adopt S. europaea as model plant for tolerance studies on simultaneous and sequential salt and flooding conditions.
In this study, we investigated how the extremophile S. europaea deals with a dynamic environment. We characterised the fluctuation and frequency of tidal floods in the natural environment of S. europaea. Based on these data, we studied morphologic, molecular, and physiological responses during laboratory flooding conditions. Our results show the high adaption of S. europaea to salinity and tidal flooding conditions. In this context, we determined the influence of S. europaea on the soil oxygen content levels and vice versa. Additionally, gene expression studies suggest an interplay of gene regulation between genes involved in adaptative responses to salt and oxygen concentrations.
Materials and methods
Characterisation of the natural growth environment
A levelling instrument (Wild NA0 – NAK0, Virtual Archive of WILD Heerbrugg, Switzerland) was used to determine the heights of the different saltmarsh zones over mean sea level (MSL) and a reference high tide level in a salt marsh of Terschelling (Wadden Sea island in the Netherlands, at the east end of the island the side facing the Dutch main land; 53.41787N, 5.45386E). In combination with publicly available tide data (Dutch Ministerie van Infrastructuur en Waterstaat, https://getij.rws.nl) the frequency and duration of natural flooding events was calculated. Therefore, the tide height was used as maximum value and a linear water increase and decrease was assumed (see Supplementary Fig. S1). Together with the measured reference high tide level and the heights of the growth zone of S. europaea, the flooding duration was calculated.
Plant material and cultivation
Salicornia europaea L. seeds were obtained from a seed distributer (Rühlemann’s Kräuter und Duftpflanzen, Germany). For all experiments, the seeds were sown in fleece trays filled with greenhouse soil (HAWITA Dachgartenextensive substrate). The trays were initially watered with 0.5 M NaCl solution or tap water to obtain salt pre-treated plants or no salt pre-treated plants, respectively. Trays were then transferred to a growth chamber under controlled conditions with 16 h light (95 μmol photons m−2 s−1) at 22°C. For germination, the seeds were covered with a plastic lid that was removed at cotyledon leave stage. At the first internodium stage, six plantlets were planted into one pot. For salt pre-treated plants, the pots were again watered initially with 0.5 M NaCl solution while plants without salt pre-treatment were watered with tap water. All plants were then further watered with tap water to prevent salt accumulation.
Experimental setups
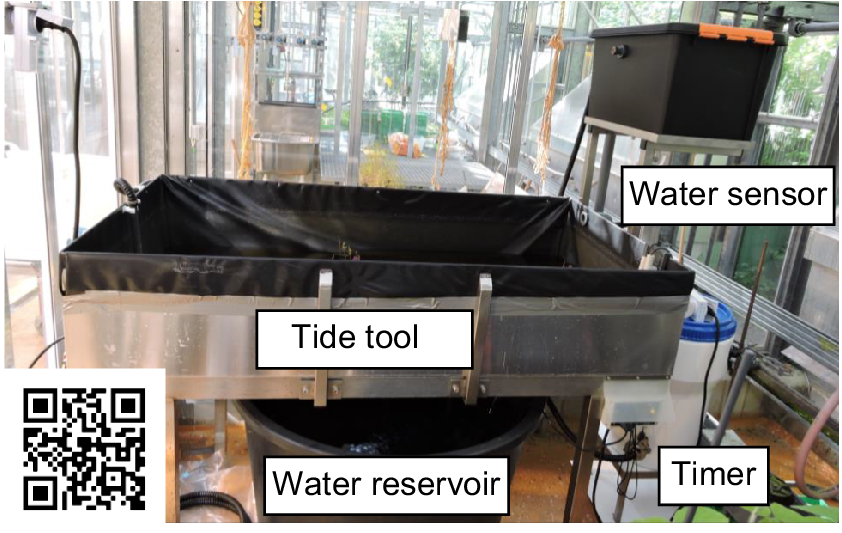
A saltwater tidal system (salinity 0.5 M NaCl) and a freshwater tidal system (tap water) were constructed for tidal flooding experiments (Fig. 1 and Fig. S2a). Both systems were located in a greenhouse with a light intensity of approximately 95 μmol photons m−2 s−1 and 22°C. The systems allow for a tidal cycle of 3 h of high tide (according to the calculated flooding frequencies; Fig. 2b and Fig. S2) starting at 11:00 hours, followed by 21 h of low tide. Six-week-old seedlings were placed in the tidal systems. After 2 weeks of acclimatisation, the shoots were harvested for gene expression analysis 3 h before high tide (08:00 hours), at 3 h of high tide (14:00 hours) and 3 h after high tide (17:00 hours). For growth analysis, growth parameters of the plants (shoot length, number of internodes, number of branches) were measured every other week.
Set up of the laboratory tidal system. During low tide, the water is stored in the water reservoir. A timer controls the start of the high tide at 11:00 hours. The water is then pumped into the tide pool, where plants expire an artificial high tide. During 3 h of high tide, the water level is controlled by sensors, these sensors ensure a constant flow of water in the system. Scan the QR-code for a time-lapse video of a tidal cycle.
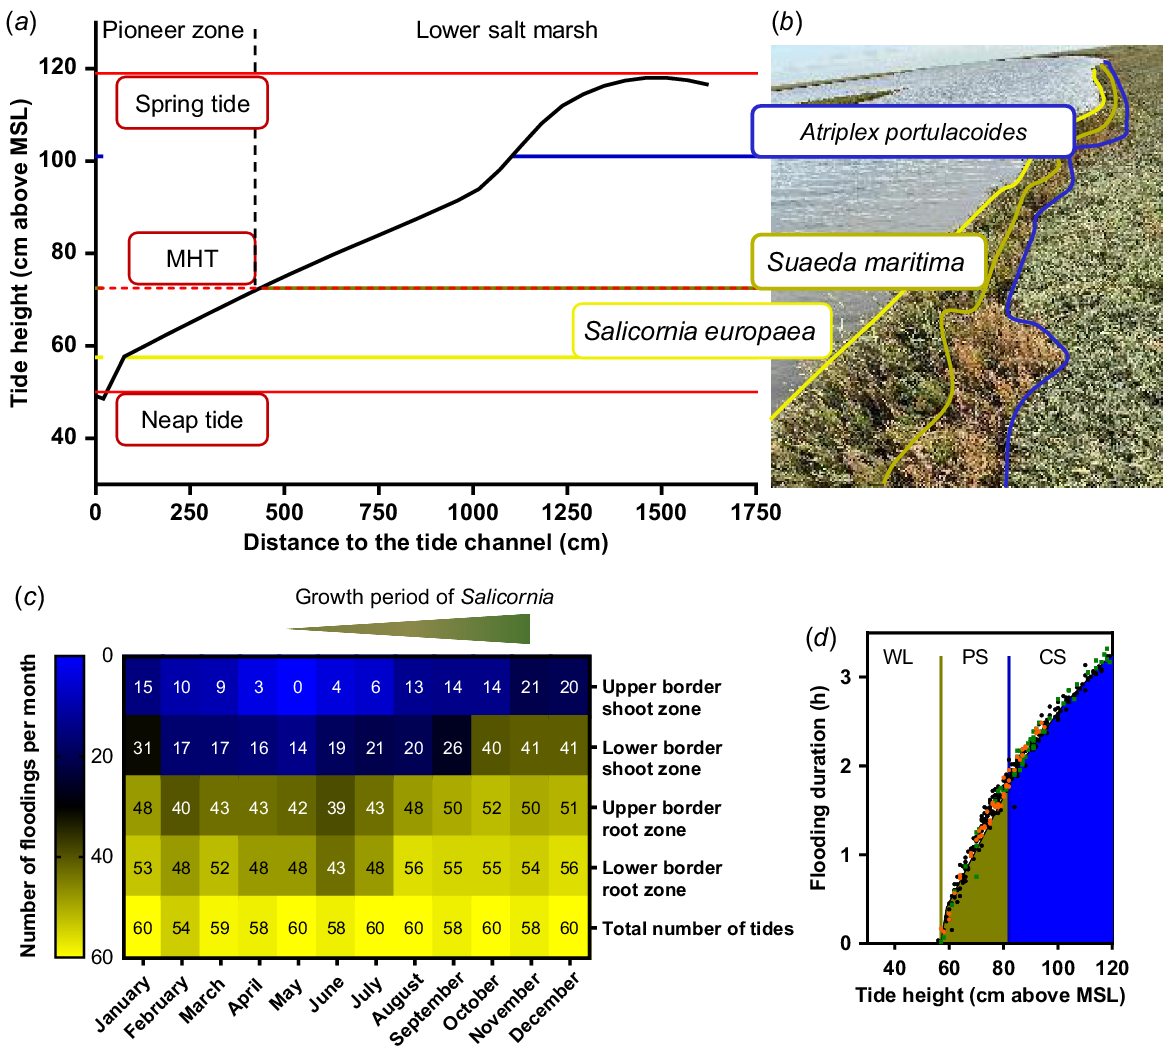
Characteristics of a natural environment of Salicornia europaea. (a) Relief of a tide channel at the saltmarsh of Terschelling (53.4056611N, 5.4424244E) including minimum and maximum high tide levels (red lines). (b) Lower borders of the root growth zones of typical species of the saltmarsh vegetation from the tide channel to the lower saltmarsh are marked with coloured horizontal lines (yellow, green, blue) and the respective species names. (c) Annual frequency of natural flooding events of S. europaea in the saltmarsh. Upper, lower root and shoot zone were calculated from the measured heights of the growth zone above mean sea level (MSL). Floods above the respective zones were summed per month and are shown in the heatmap. (d) Flooding duration (h) calculated on the tide heights. Green and blue lines mark the lower and upper root zone of S. europaea, respectively. Tide heights below the lower root zone were marked as waterlogging (WL) of the roots. The green filling indicated partial submergence (PS) of the shoot while the blue filling indicated complete submergence (CS) of S. europaea. Representative for the growth period of S. europaea (May–October): orange, May; green, October; black, June–September. Tide data was extracted from the Dutch Ministerie van Infrastructuur en Waterstaat (https://getij.rws.nl). MHT, mean high tide.
For prolonged flooding experiments (Fig. S2b), 6-week-old seedlings were flooded completely in a black tank with 0.5 M saltwater. The tank was located in a growth chamber under controlled conditions at 22°C with 16 h light (95 μmol photons m−2 s−1).
Salt experiments (Fig. S2b) were conducted on 6-week-old seedlings. Salt pre-treated and not salt pre-treated plants were watered once with tap water, 0.5 M, 1.3 M and 2.5 M NaCl solution (1 L per tray). To prevent a dilution or accumulation of the NaCl in the trays, the filling level was marked and refilled with tap water for the experimental period. Every other week, fresh weight and number of branches were determined.
Six-week-old seedlings were used to perform low oxygen treatments (Fig. S2c). The whole seedlings were placed in the dark with a continuous gas flow of 99% nitrogen and 1% oxygen (mass flow meters and controller, Brooks Instrument GmbH). Control seedlings were placed in the dark under normoxic conditions (21% oxygen). After 1, 2 and 4 h of treatment, the shoots were harvested, immediately frozen in liquid nitrogen, and stored at −80°C.
Real time quantitative PCR (qPCR) analysis
For RNA extraction, a protocol from Voegele and Schmid (2011) was modified. Ground plant material was suspended in 800 μL cell lysis buffer (2% (w/v) SDS, 68 mM (tri)-sodium-citrate, 132 mM citric acid and 10 mM EDTA), and 300 μL precipitation buffer (4 M NaCl, 17 mM (tri)-sodium-citrate, 33 mM citric acid) was added to separate proteins from the RNA. After centrifugation, the RNA was precipitated from the supernatant with isopropanol, washed in 70% ethanol and dissolved in ultra-pure water. DNA residues were digested with DNase I (EN0521, Thermo Fisher Scientific Inc., Germany), subsequently the reaction was heat inactivated. For cDNA synthesis Revert Aid First Strand cDNA Synthesis Kit (K1621, Thermo Fisher Scientific Inc., Germany) was used to reverse transcribe 1–2 μg RNA into cDNA.
In order to design primer for quantitative real time qPCR, a reference transcriptome for S. europaea was created. Therefore, RNA-Seq data from four different datasets (NCBI: SRR822929, SRR823398, SRR944677, SRR944676) were used to obtain a comprehensive transcriptome. For every data set a quality control of the raw reads was performed with FastQC (Andrews 2010), adapter fragments and low-quality reads were removed (Trimmomatic; Bolger et al. 2014). The de novo assembler Trinity (Grabherr et al. 2011) was used to obtain assembled transcripts. A gene to transcript identifier was generated by blasting the assembled transcript against the NCBI data base (22 January 2018) (Megablast; Huang and Madan 1999). With the generated transcript identifier, open reading frames (ORFs) were determined in the assembled transcripts to generate a reference transcriptome and subsequently proteome (TransDecoder) (Haas et al. 2013). After removing duplicate sequences, the reference transcriptome was used to find genes of S. europaea that are homologue to known stress responsive genes in Arabidopsis thaliana L. by blasting. The resulting homologue gene sequences of S. europaea were used to generate primers (using Clone Manager Pro 9.51 software) for qPCR analysis. All generated primers are listed in Fig. S3.
Real time qPCR was performed on a LightCycler 480 II (Roche Deutschland Holding GmbH) in a reaction volume of 5 μL. Each reaction included 20 ng cDNA, 200 nM primer (Fig. S3) and 2.5 μL PowerUp SYBR Green Master Mix (Applied Biosystems, Thermo Fisher Scientific Inc., Germany). First, a UDG activation at 50°C was performed for 120 s, and after 180 s of pre-incubation at 95°C, cDNA was amplified in 45 cycles of 10 s at 95°C, 20 s at 60°C and 20 s at 72°C. Finally, a melting curve analysis was carried out from 65 to 95°C, to detect the product specificity of each PCR reaction. Quantitative evaluation was performed according to 2(−ΔΔCt) method (Livak and Schmittgen 2001).
Pulse-Amplitude-Modulation (PAM) fluorometry analysis
Saturation pulse analyses were conducted with a Junior-PAM (Heinz Walz GmbH, Germany) on dark-acclimated plants. The magnetic leave clip was prepared with a thick fleece to prevent damaging the succulent S. europaea stems. PAM parameters like maximum quantum yield (Fv/Fm), quantum yield at the PSII (Y(II)) and non-photochemical quenching (Y(NPQ) and Y(NO)) were calculated with the WinControl-3 software using the standard settings. Fluorescence induction curve measurement was terminated when Y(II) was constant.
Oxygen measurements
During laboratory experiments and field studies, the oxygen concentration in water, at the rhizosphere of S. europaea and soil without S. europaea roots was measured using the portable fibre optic oxygen meter Microx 4 (PreSens Precision Sensing GmbH, Germany). A dipping probe sensor type PSt7 (detection limit 15 ppb) and a temperature sensor were connected to the device to ensure an accurate oxygen measurement. Additionally, the oxygen content of soil mixtures (100% greenhouse soil, 100% saltmarsh soil and 40/60% greenhouse/saltmarsh soil) was measured in the laboratory saltwater tide system.
Determination of soil respiration
Soil respiration was determined based on carbon dioxide emission (Isermeyer 1952) with modifications described in Jäggi (1976). For each condition, the soil respiration of 20 g soil was determined. During 48 h incubation at 20°C, the formed carbon dioxide was captured in 20 mL sodium hydroxide (0.1 M). After addition of 2 mL barium chloride (0.5 M), carbon dioxide precipitates as barium carbonate. The remaining sodium hydrochloride is than back-titrated with hydrochloric acid (0.1 M) using phenolphthalein as indicator. Respiration rate was calculated as described in Alef (1991).
Results
S. europaea is naturally exposed to constantly changing environmental conditions
Salt marshes are intertidal zones where plants are constantly challenged with saline and flooding conditions (van Regteren et al. 2020). To determine the natural duration of flooding of S. europaea, we measured the height of the saltmarsh sections above the MSL and created a cross-section of the salt marsh (Fig. 2a). Depending on the heights above MSL, we found characteristic saltmarsh plants (Fig. 2b) that were also described previously (Redelstein et al. 2018). In the lower salt marsh starting at 100 cm above MSL, Atriplex portulacoides was one of the dominating species. At the transition from lower saltmarsh to the pioneer zone (73–100 cm above MSL), Suaeda maritima was located, while the pioneer zone was dominated by S. europaea at 57–73 cm above MSL. The red lines indicate minimum and maximum high tides correlating with neap tides where not even the pioneer zone was flooded and springtides where also the lower saltmarsh was flooded (Fig. 2a; Proetel 1921). S. europaea is growing closest to the MSL with the highest flooding occurrence.
Together with publicly available tide data (Rijkwaterstaat 2021), we calculated the frequency of tide events that affect root or shoot zone of S. europaea (Fig. 2c). The heatmap displays all hightide events in 2021 for each month. Root zones were calculated from the soil cross section while the shoot zone additionally included the average growth height of a S. europaea plant of 30 cm. The division into root and shoot zone with respective lower and upper border allows the division into waterlogging (WL), partial submergence (PS) and complete submergence (CS) of the plants. A high tide of 60 cm or lower led to waterlogging; between 60 and 80 cm, the plants were partially submerged; and high tides above 80 cm were expected to submerge the plants completely (Fig. 2d). During the growing period of S. europaea (Ungar et al. 1979), the flooding events at the lower shoot border increased from 16 floods in May to 40 floods in October. At the upper shoot border the flooding events increased from 3 to 14 floods from May to October. The subdivision also enables detailed insights about the root and shoot flooding frequency. Comparing the flooding frequency of the root border with the total number of tides revealed that almost every high tide leads to waterlogging of the roots. The comparison of total number of tides with the number of tides that reach the lower shoot border showed that a shoot submergence occurred only once a day for maximum 3 h. But the mean high tide reaches only the upper root zone of S. europaea. Our results demonstrate the high variability of tidal flooding events during the natural growth period of S. europaea.
To determine how the flooding frequency affects the flooding duration of S. europaea, we calculated the duration of every individual flooding event (Fig. 2d). For this calculation, a linear water rise during high tide was assumed. Accordingly, the longest submergence of 3 h occurred at springtides of 120 cm above MSL. Tides higher than 80 cm above MSL (blue filled area) flooded the entire plant while tides of 60–80 cm above MSL only partially submerged the plants (yellow-blue dashed area). If the tide height was lower than 60 cm, only the roots were flooded. The orange and green dots in Fig. 2d indicate flooding events in May and October, respectively. It is noticeable that at the end of the growth period, the maximum high tides (120 cm above MSL) are 20 cm higher than at the start of the growth period. Consequently, the maximum flooding duration at the end of the growth period is 45 min longer (Fig. 2c, d). The flooding duration of S. europaea depends on the individual high tide level which changes during the whole year for every high tide.
Our results demonstrate that S. europaea is a plant that is naturally exposed to ever changing environmental conditions. Its natural location at the edge of the tidal zone is the most fluctuating site at the salt marsh. At this location, the highest variability in flooding frequency and flooding duration occurs.
S. europaea is highly adapted to tidal flooding events and high salinities
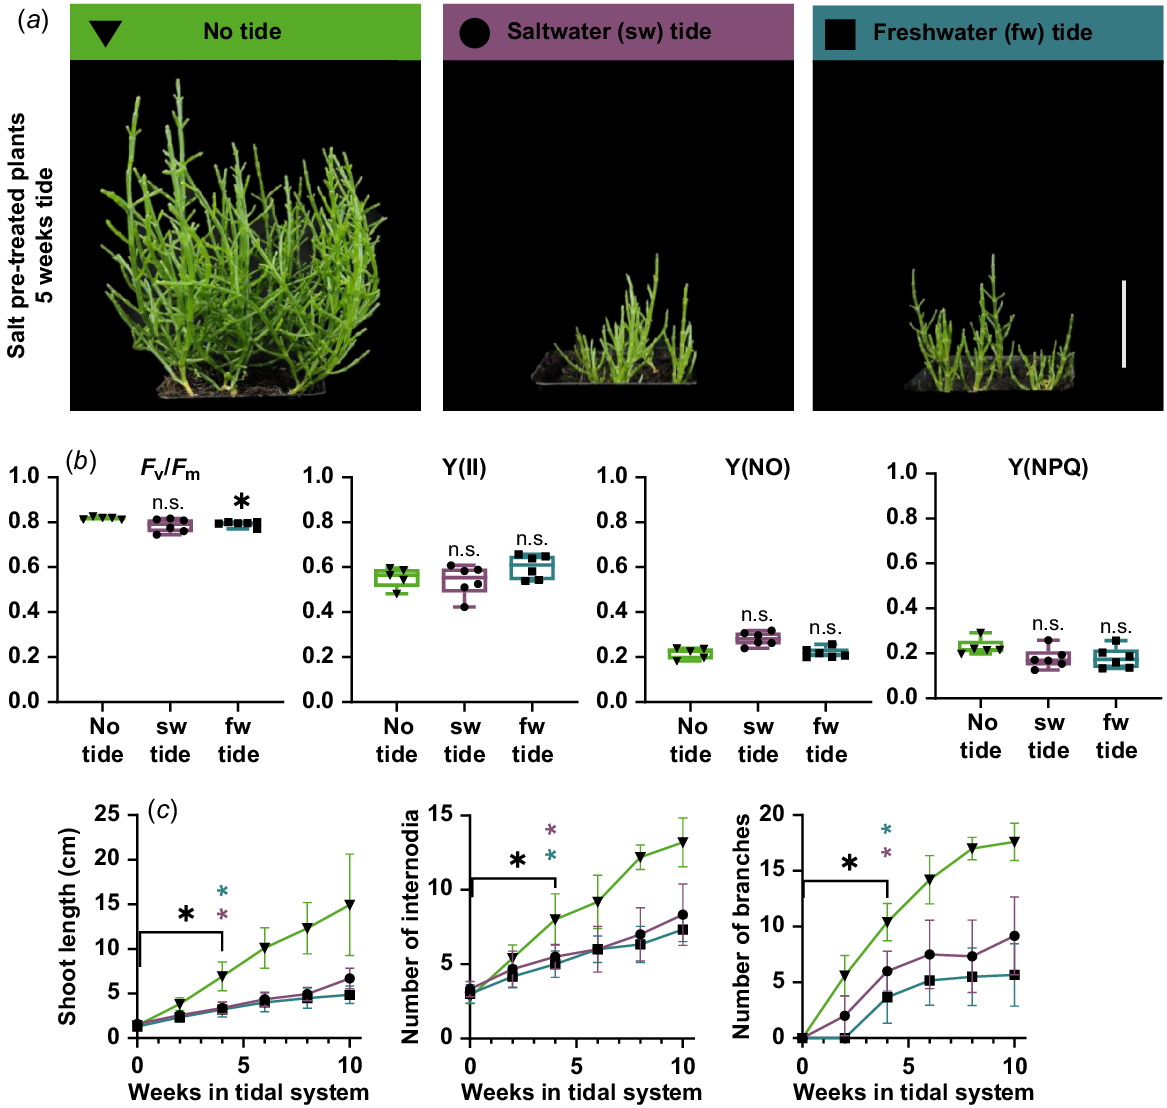
Laboratory tide systems were built to investigate the growth behaviour of S. europaea under simulated natural tidal flooding conditions. Six-week-old plants were exposed to 3 h of artificial high tide once a day, which corresponds to daily springtide. Control plants that were not subjected to tidal flooding were more than twice as large as the plants that were exposed to tidal flooding (Fig. 3a). A chlorophyll fluorescence measurement showed no significant difference between ‘no tide’ plants and tide plants in the parameters Y(II), Y(NO), Y(NPQ) (Fig. 3b). Although the Fv/Fm value of ‘no tide’ plants is significantly higher (0.818) than in freshwater tide plants (0.792), the value of freshwater tide plants is still in the range reported for healthy plants from other species (0.79–0.84; Maxwell and Johnson 2000). A detailed look into specific growth parameters revealed that the plants continued growing in both laboratory tidal systems (Fig. 3c). Shoot length, number of internodia as well as number of branches significantly increased during 10 weeks of tidal submergence. These morphological observations are independent from the type of tide (salt- or freshwater). The maintained chlorophyll fluorescence and the continued growth under these conditions demonstrate the high resilience of S. europaea to tidal flooding events.
Growth characteristics of Salicornia europaea in tidal model system. (a) Six-week-old salt pre-treated plants after 5 weeks of freshwater (fw), saltwater (sw) or no tidal system. The systems were located in the green house with long day (16 h light) conditions (scale bar = 5 cm). (b) Fluorescence measurements after 5 weeks in the tidal systems. Depicted are maximum quantum yield (Fv/Fm), quantum yield at the PSII (Y(II)) and non-photochemical quenching (Y(NPQ) and Y(NO)). Asterisks indicate a significant difference compared to no tide plants (Welch’s ANOVA Dunnett multiple comparison; *P < 0.05; n = 6). (c) Shoot length (cm), number of internodia and number of branches were measured weekly after the transfer into the systems. Black asterisks indicate point of significant differences compared to 0 weeks in tidal system (Welch’s ANOVA; Dunnett’s multiple comparison; *P < 0.05; n = 6). Violet and petrol asterisks indicate point of significant difference between no tide and saltwater or freshwater tide, respectively (multiple t-test; Holm-Sidak multiple comparison; *P < 0.05; n = 6). Green triangle, no tide; violet circle, saltwater tide; petrol rectangle, freshwater tide. n.s., not significant.
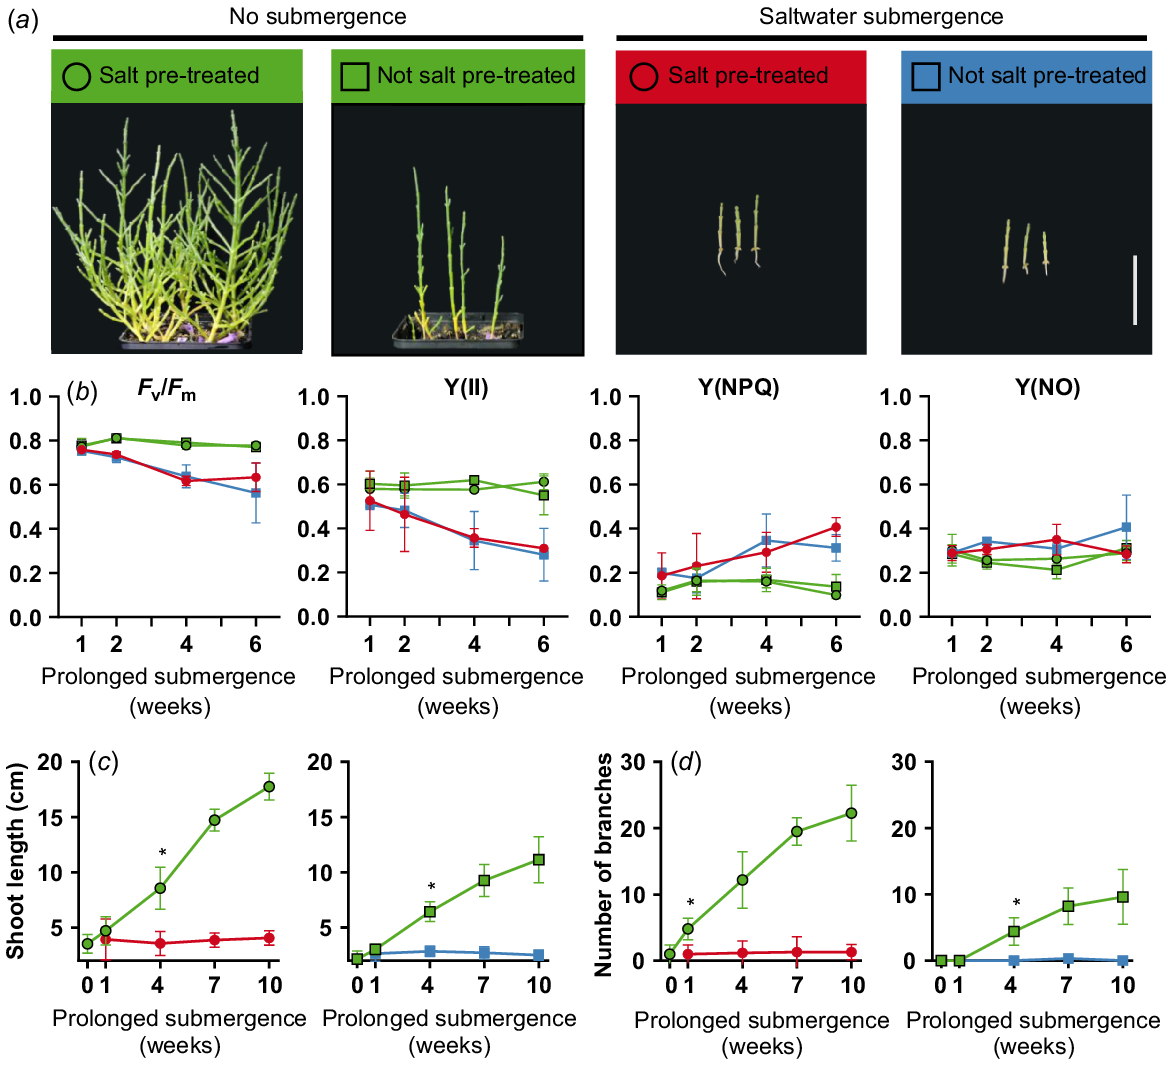
In order to characterise the growth behaviour of S. europaea under extreme flooding conditions, a prolonged flooding experiment was conducted. Six-week-old plants that were either pre-treated and not pre-treated with salt were submerged in saltwater or freshwater. Salt pre-treated plants that were not submerged grow healthy and bushy. In contrast, plants that were not pre-treated with salt were slightly smaller and not bushy. However, saltwater submerged plants were considerably smaller than not submerged plants independent of the pre-treatment (Fig. 4a). In contrast, only 10 days of freshwater submergence led to loss of structural integrity and dead plants (data not shown). However, a chlorophyll fluorescence measurement showed decreasing Fv/Fm and Y(II) and increased Y(NPQ) values after 4–6 weeks of prolonged saltwater submergence (Fig. 4b). When comparing the shoot lengths of salt pre-treated and not salt pre-treated plants, a significant difference (***P < 0.001) after 7 weeks of treatment (total age of 14 weeks) was measurable. A significant difference between salt pre-treated and not salt pre-treated could also be seen in the number of branches but already after only 1 week (total age of 7 weeks; *P < 0.05). After 4 weeks of prolonged flooding, shoot length and number of branches were significantly smaller compared to not flooded plants (Fig. 4c, d). Furthermore, there is no discernible increase in shoot length or in the number of branches. Under prolonged saltwater flooding, S. europaea is able to survive but the growth is halted completely.
Growth characteristics of Salicornia europaea during prolonged flooding. Six-week-old salt pre-treated or not salt pre-treated plants were submerged up to 10 weeks in 0.5 M saltwater under long day (16 h light) conditions. (a) S. europaea plants after 9 weeks of prolonged submergence (scale bar = 5 cm). (b) Florescence measurements during 6 weeks of prolonged submergence. Depicted are maximum quantum yield (Fv/Fm), quantum yield at the PSII (Y(II)) and non-photochemical quenching (Y(NPQ) and Y(NO)). (c) Shoot length (cm) and (d) number of branches during 10 weeks of saltwater submergence. Asterisks indicate point of significant difference between not submerged and submerged plants (multiple t-test; Holm-Sidak multiple comparison; *P < 0.05). Green, no submergence; red and blue, saltwater submergence; circle, salt pre-treated; rectangle, not salt pre-treated plants. n = 5.
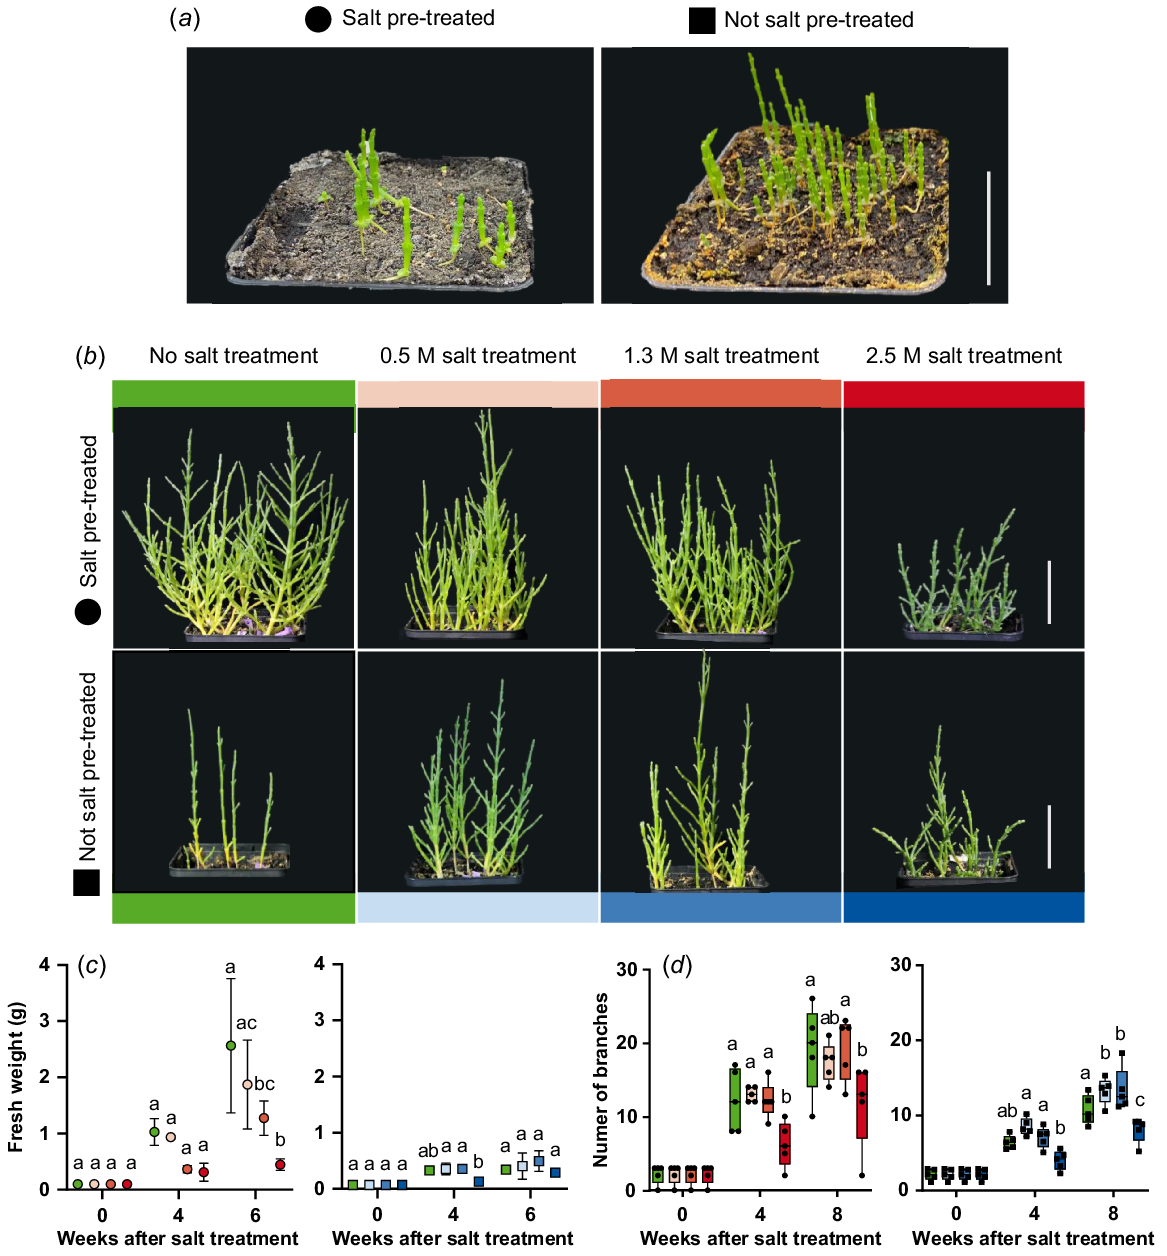
Salt stress experiments were conducted to characterise the growth behaviour under extreme salt concentrations. Salt pre-treatment result in thicker plants after 6 weeks compared to no salt pre-treatment (Fig. 5a). Six-week-old plants were watered with tap water, 0.5 M NaCl, 1.3 M NaCl and 2.5 M NaCl solution. Salt pre-treated plants watered with 0.5 M and 1.3 M NaCl solution showed healthy and bushy growth like not salt treated plants (Fig. 5b). Plants that were not pre-treated were bushier after watering with 0.5 M and 1.3 M NaCl solution compared to not salt treated plants. The treatment with 2.5 M NaCl solution led to smaller but bushy plants for both, pre-treated and not pre-treated plants. When comparing the number of branches of salt pre-treated and not salt pre-treated plants, significantly fewer branches were measured after 4 weeks of 2.5 M NaCl treatment (total age of 10 weeks) (Fig. 5d). For not pre-treated plants, significantly more branches were measured after 8 weeks of 0.5 M and 1.3 M NaCl treatment. The same tendencies could also be seen in the fresh weight of the plants (Fig. 5c). The addition of 0.5 M and 1.3 M NaCl solutions stimulated growth in not salt pre-treated plants, while 2.5 M NaCl led to comparably smaller plants that were still able to continue growth.
Growth characteristics of Salicornia europaea during salt stress. (a) Six-week-old salt pre-treated or not salt pre-treated plants were treated once with 0.5 M, 1.3 M and 2.5 M NaCl solution. (b) S. europaea plants 9 weeks after salt treatment (scale bar = 5 cm). (c) Fresh weight (g) and (d) number of branches during salt treatment. Different letters indicate significant differences for each timepoint within salt pre-treated or not salt pre-treated plants (one-way ANOVA with Tukey’s multiple comparison; P < 0.05). Green, no salt treatment; circle, salt pre-treated; rectangle, not salt pre-treated plants. n = 3–5.
These results show, that any deviation from natural growth conditions; e.g. due to the absence of salt, high salinities or prolonged flooding resulted in restricted growth or plants death. The exposure to daily springtides also negatively affected plant growth but the plants continued growing without other stress indications.
Oxygen availability during tidal submergence is influenced by the soil composition
To further characterise the growth conditions of the tidal systems, we measured the oxygen concentrations during the tidal cycle in the water and at the rhizosphere of S. europaea. (Fig. 6a). In the soil of the freshwater system, the oxygen concentration was constant at 1% (v/v) during low and high tide. In the saltwater system, the soil oxygen concentration during low tide was at 20% (v/v). During high tide, a median oxygen concentration of 14% (v/v) with a great dispersion was measured. The oxygen concentration in the water increased during high tide from 17% (v/v) to 20% (v/v) oxygen in both tide systems. Neither the saltwater system nor the freshwater system had hypoxic conditions in the water that flooded the S. europaea shoots.
Natural and laboratory oxygen availability for S. europaea during tidal cycle. (a) Oxygen content in water and the rhizosphere of S. europaea in the laboratory tide systems. For water oxygen content, the oxygen sensors were placed in the water reservoir, soil oxygen content was measured at the rhizosphere of S. europaea (rhizo). Different letters above boxplots indicate a significant difference (one-way ANOVA Tukey’s post hoc test; P < 0.05; n = 100). (b) Aerobic soil respiration of saltwater tide soil and freshwater tide soil. Asterisks indicate a significant difference (Student’s t-test, ***P < 0.001, n = 3). (c) Oxygen content in the natural habitat during low tide and high tide. For water oxygen content, the oxygen sensors were placed in the tide channel, soil oxygen content was measured at the rhizosphere of S. europaea (rhizo) and in the soil without S. europaea roots (soil). Different letters above boxplots indicate a significant difference (one-way ANOVA Tukey’s post hoc test; P < 0.05; n = 100). (d) Naturally oxidised rhizosphere of S. europaea during low tide, sampled on Terschelling. (e) Oxygen content of greenhouse, saltmarsh and mixed (40% greenhouse, 0% saltmarsh) in the laboratory saltwater tide systems. Different letters above boxplots indicate a significant difference (one-way ANOVA Tukey’s post hoc test; P < 0.05; n = 5).
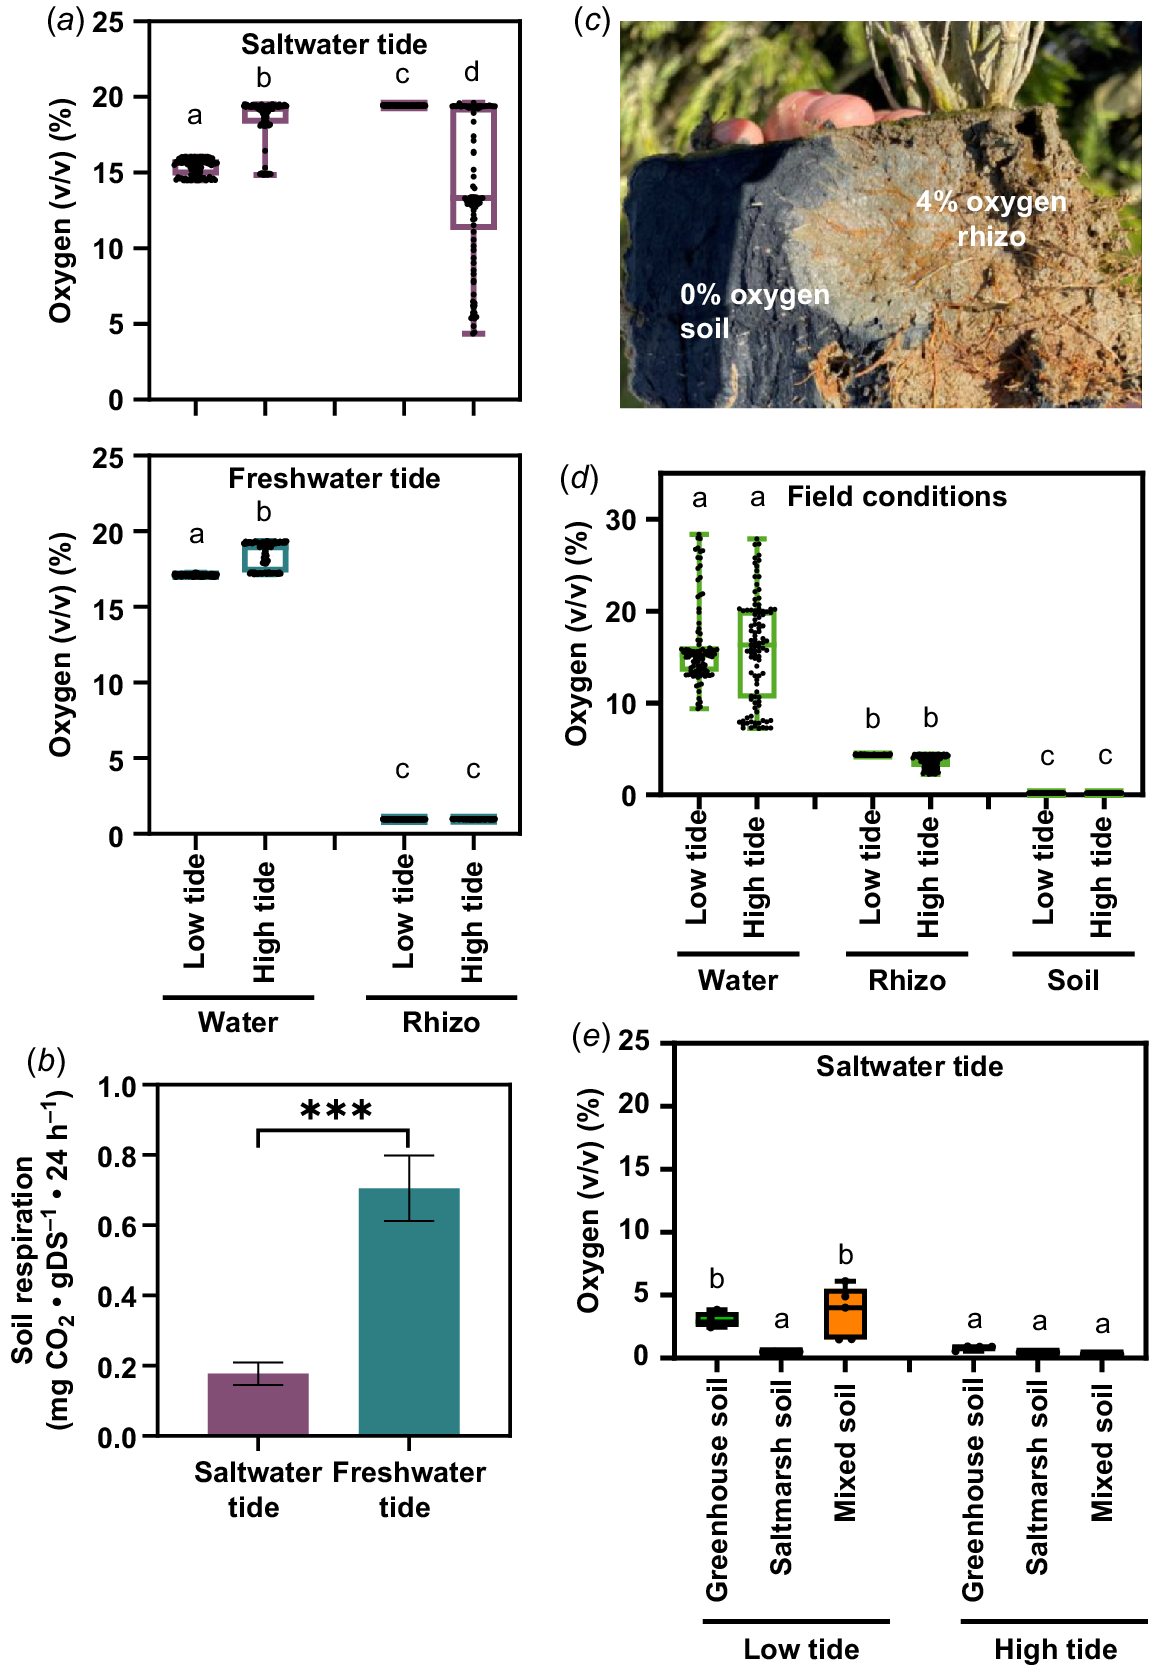
Soil respiration from the soil of the freshwater and saltwater system was measured as possible explanation for the different oxygen concentrations in the soil (Fig. 6b). The produced carbon dioxide in the soil of the freshwater system was four times higher compared to the carbon dioxide amount of the saltwater system. With the soil respiration being a measure for the presence of microorganisms, this result showed that the soil from the saltwater tide system contained less microorganisms or microorganisms that are not able to live in saline conditions.
To establish a system to equal natural conditions, soil oxygen content was measured in a saltmarsh. In the presence of the natural microorganisms of the saltmarsh, the oxygen content of the S. europaea rhizosphere was 4%, while 0% oxygen was measured in the non-rooted soil of the saltmarsh (Fig. 6c). Furthermore, the oxygen was measured in the water of the tide channel, in the non-rooted soil of the saltmarsh and at the rhizosphere of S. europaea during low and high tide (Fig. 6d). The oxygen concentration in the water and soil had the same median (15% and 4%, respectively) during low and high tide, but with a higher variability during high tide. The oxygen content in the non-rooted soil was anoxic (0% O2) during high and low tide, which is significantly lower than at the rhizosphere of S. europaea. To introduce the natural microorganisms into our tide system, we mixed our greenhouse soil (40%) with saltmarsh soil (60%) and measured the oxygen content without plants (Fig. 6e). During high tide, the oxygen concentration in all soil compositions was anoxic (0% O2). The oxygen concentration was significantly higher in greenhouse soil (4% O2) and mixed soil (5% O2) during low tide in comparison to the saltmarsh soil (0% O2). The comparable soil oxygen concentrations in our saltwater tide system (Fig. 6e) and under natural conditions (Fig. 6d) showed that without plants the soil composition of the saltmarsh soil led to lower oxygen concentrations. The presence of S. europaea itself led to higher oxygen concentrations in the greenhouse soil of the saltwater system (Fig. 6a) as well as in the natural environment (Fig. 6d).
Tidal flooding does not induce hypoxic-stress related gene expression
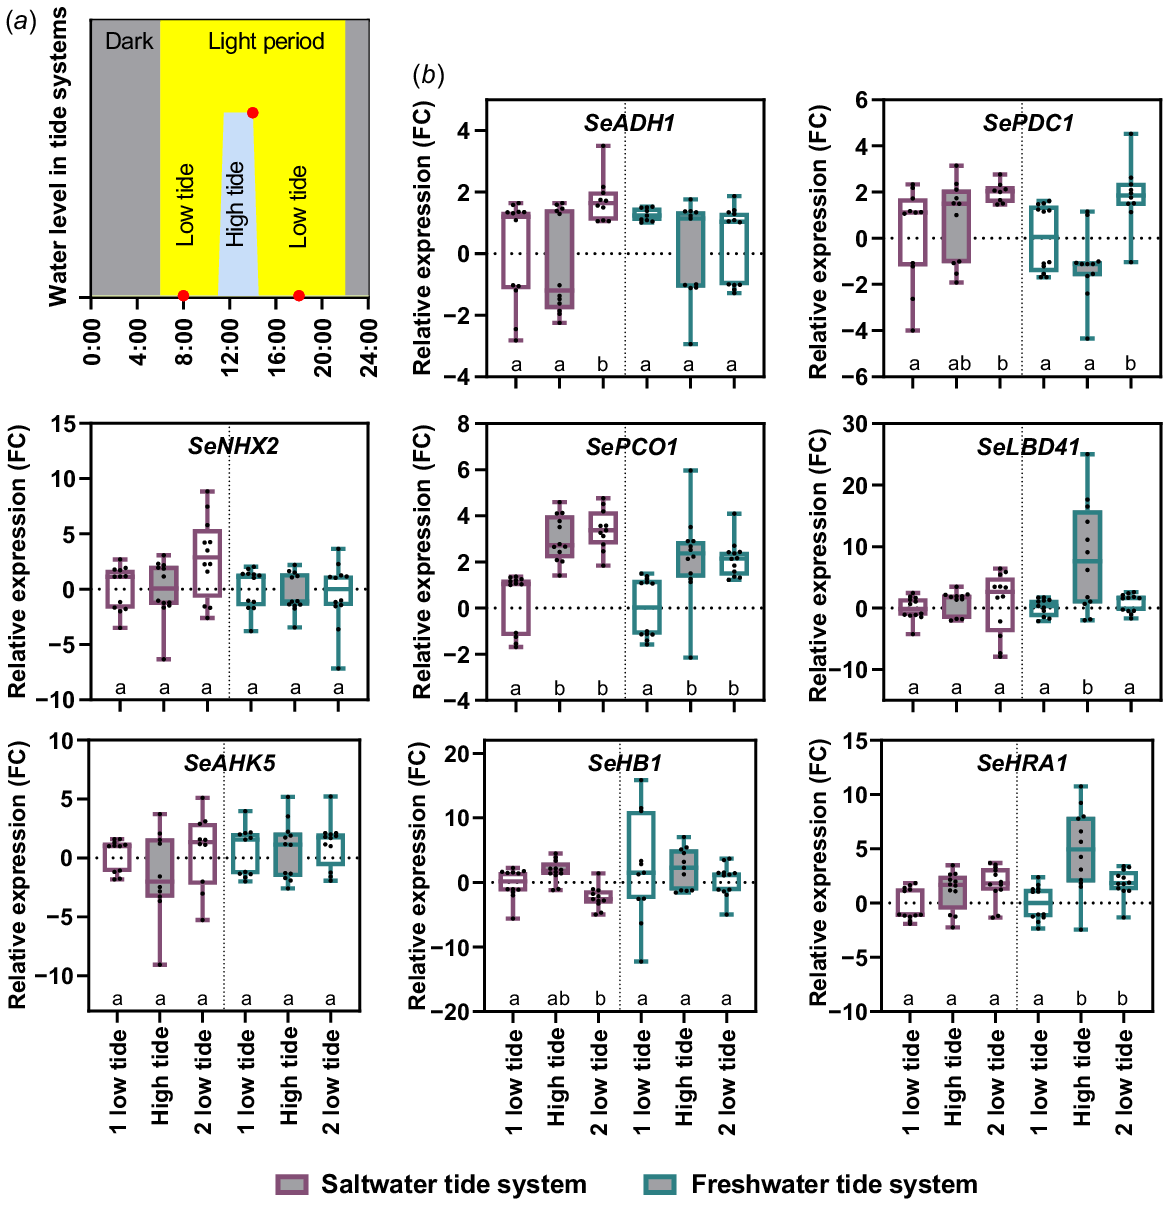
To investigate whether the tidal submergence led a molecular stress reaction, we performed a gene expression analysis. We selected known hypoxia and salt induced genes from A. thaliana (ADH1 – At1g77120, LBD41 – At3g02550, HRA1 – At3g10040, PCO1 – At5g15120, PDC1 – At4g33070, HB1 – At2g16060, NHX2 – At3g05030, AHK5 – At5g10720) and searched for homologue genes in S. europaea. Real time qPCR was then used to determine the expression profile of these genes over a tide cycle (Fig. 7). The gene expression of SePCO1 significantly increased during saltwater and freshwater high tide but remains high at the second low tide. The same was true for SeHRA1 but only under freshwater conditions, saltwater high tide did not lead to an induction. The only gene with a significant increase during high tide was SeLBD41 in the freshwater system. However, SeLBD41 was not induced under saltwater conditions. The remaining hypoxia related genes SeADH1, SeHB1 and SePDC1 were also not induced upon high tide. Salt responsive genes SeNHX2 and SeAHK5 were also not induced upon tidal saltwater or freshwater submergence. This gene expression analysis showed that the majority of hypoxia responsive genes and all tested salt responsive genes were not induced upon tidal submergence, which correlates to the oxygen concentrations measured in the water of both tidal systems.
Expression profile of hypoxia and salt related genes in S. europaea during tidal cycle. Six-week-old salt pre-treated plants were placed for 2 weeks in a saltwater (violet) or freshwater (petrol) tide system. (a) The systems were located in the green house with long day (16 h light, yellow) conditions. S. europaea shoot samples were harvested 3 h before high tide (08:00 hours), at 3 h of high tide (14:00 hours) and 3 h after high tide (18:00 hours, red dots). (b) Relative expression levels are shown as fold change values normalised to the first harvesting timepoint. Different letters below the boxplot indicate a significant difference (Welch’s ANOVA; Dunnett’s multiple comparison; P-value < 0.05; n = 3 × 4). Violet boxplots, saltwater tide system; petrol boxplots, freshwater tide system.
Salt affects the expression of hypoxia related genes under hypoxic conditions
As tidal flooding did not induce hypoxia related genes, we verified whether hypoxia related genes can be induced in S. europaea shoots in a laboratory hypoxia experiment. S. europaea seedlings were treated with 1% (v/v, hypoxia) oxygen over a time course of 4 h in the dark, control plants were equally placed in the dark at 21% (v/v, normoxia) oxygen. All investigated genes (SeADH1, SeLBD41, SeHRA1, SePCO1, SePDC1 and SeHB1) were induced by hypoxia in the time course of 4 h (Fig. 8).
Variation of hypoxia related genes in salt treated and not salt treated plants during hypoxia. Six-week-old salt pre-treated (red) and not salt pre-treated plants (blue) were exposed to hypoxia in the dark (1% O2 v/v). The mRNA level was measured during a 4-h time course by real time qPCR. Relative expression levels are shown as fold change (FC) values calculated depending on control plants (21% O2 v/v, dark). Different letters below the boxplot indicate a significant difference according to Welch’s ANOVA followed by Dunnett’s multiple comparison (P-value < 0.05, n = 4).
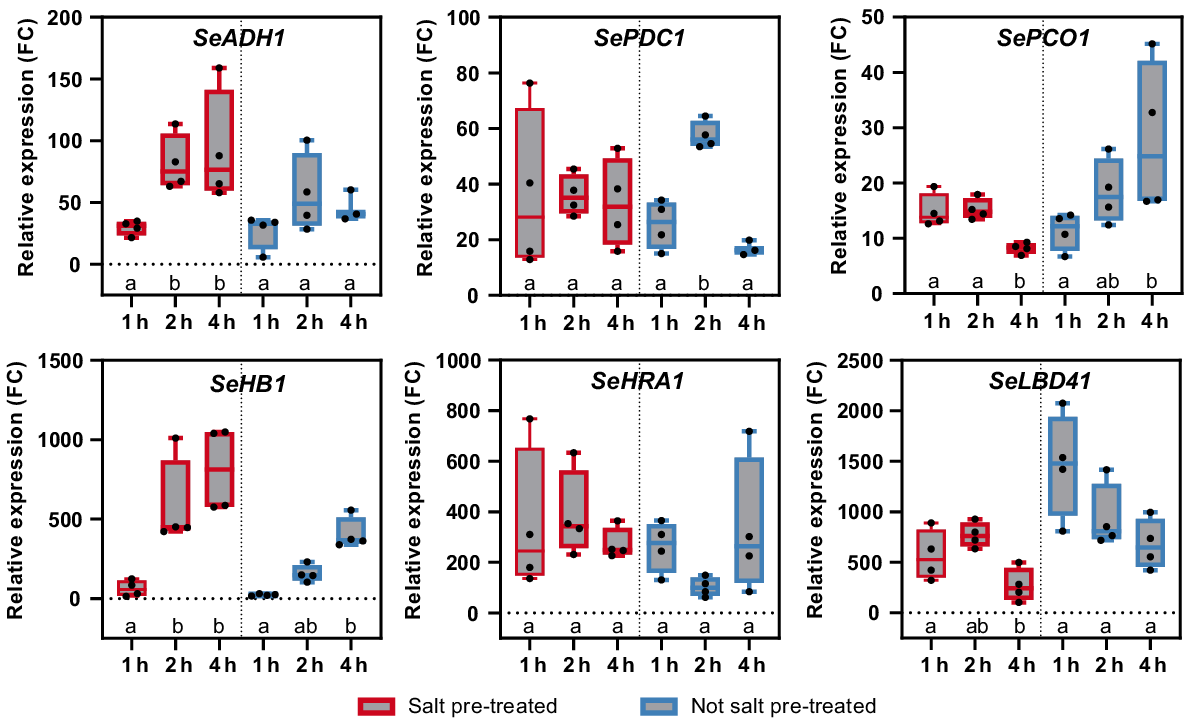
In salt pre-treated plants, SeHRA1 had a 250-fold changing expression during the entire time course. SePCD1 was also stably expressed in salt pre-treated plants during the time course, but only at a 30-fold change level. In not salt pre-treated plants SeHRA1 expression decreases, while SePDC1 is induced after 2 h. However, the expression of SeADH1 and SeHB1 increased after 2 and 4 h in salt pre-treated plants. In plants not pre-treated with salt, the same expression pattern is visible, but the expression is lower compared to salt pre-treated plants. In contrast, the expression of SePCO1 and SeLBD41 in not salt pre-treated plants is stronger induced compared to salt pre-treated plants. In general, salt altered the gene expression of all investigated hypoxia related genes of S. europaea.
This gene expression analysis showed that hypoxia related genes can be induced in S. europaea and that the sequential salt and hypoxia treatment led to differentially expression of these genes compared to only hypoxia.
Discussion
As sessile organisms, plant must react to a multitude of changing environmental conditions. In particular reactions to salinity or oxygen deficiency caused by flooding or hypoxia are well studied and largely understood in sensitive plants (van Dongen and Licausi 2015; Liang et al. 2018; Loreti and Striker 2020). However, the combination of both conditions has only been studied to a small extent and even less in tolerant plants. For different salt and flooding conditions the response of tolerant and intolerant rice (Oryza sativa) cultivars has been reviewed. Tolerant rice cultivars showed a higher pigment content, chloroplast integrity and improved oxygen transport (Sarkar et al. 2019). In this paper, we describe how S. europaea responds to these stresses and present the experimental laboratory conditions to investigate such responses.
Effects of natural tidal floods on S. europaea
S. europaea is colonising the pioneer zone of salt marshes (Fig. 2). In this saltmarsh zone, S. europaea is exposed to the highest variability of flooding frequency and duration. Moreover, it has been reported that the salinity of the sea water is fluctuating during the year and seasons (25–33 mS cm−2, which correlates to 0.25–0.35 M of a NaCl solution) (van Aken 2008). Indeed, also the soil salinity in which S. europaea is growing changes during the seasons (29–109 mS cm−2, which is equivalent to a 0.3–1 M NaCl solution) (McGraw and Ungar 1981). Hence, S. europaea is able to withstand the most fluctuating environmental conditions of a salt marsh. Due to this high natural tolerance to fluctuating floods and salt concentrations S. europaea is our choice to study the reaction to combined salt and flooding conditions.
Adaptations of S. europaea to tidal flooding events
In the natural habitat of S. europaea, a mean high tide reaches only the upper root zone of S. europaea (Fig. 2c); this is the end of the pioneer zone, (Redelstein et al. 2018) which means that a submergence of the entire plant only occurs at springtides. In a laboratory tide system, we examined morphological responses of S. europaea to 3 h of tidal flooding, which is equivalent to daily springtide. Morphological analysis revealed restricted growth in both tidal systems (Fig. 3a, c), which may represent a stress response. Flooding stress responses of S. europaea were therefore characterised in a prolonged submergence experiment. In a natural environment, S. europaea experiences a maximum of 3 h submergence (Fig. 2d). After 10 weeks of saltwater submergence, a condition that is quite different from the natural environment, the growth stopped completely (Fig. 4a, c) demonstrating that the restricted growth during tidal saltwater flooding was a stress reaction of S. europaea, but the plants did not die. Prolonged freshwater submergence led to plants death, indicating that salt is a prerequisite to survive flooding. In halophytes, non-structural carbohydrates have been shown to mediate the response to flooding and salinity (Pellegrini et al. 2020). Non-structural carbohydrates are also an energy supply to plants and are produced via photosynthesis. Consequently, the amount of non-structural carbohydrates relates to chlorophyll fluorescence. Chlorophyll fluorescence measurements have been used to monitor the performance of plants under abiotic stress conditions. An impaired performance can be determined by photochemical and non-photochemical quenching (Maxwell and Johnson 2000; Kalaji et al. 2016). Quantum yield at the PSII (Y(II)) does not differ between tidal flooding and not flooded plants (Fig. 3b), suggesting that tidal flooding, regardless of the type of tidal flooding (0 mM and 510 mM NaCl), is no stress for S. europaea. After 4 weeks of prolonged saltwater submergence, the Fv/Fm and quantum yield at the PSII (Y(II)) decreased while non-photochemical quenching (Y(NPQ)) increased, indicating a photoinhibition (Fig. 4b). Therefore, chlorophyll fluorescence can be used as a measure for flooding stress response in S. europaea. Hence it is even more interesting that 5 weeks of tidal freshwater or saltwater flooding did not affect the chlorophyll fluorescence (Fig. 3b). Given that growth in tidal systems was limited, yet chlorophyll fluorescence remained unaffected, it can be concluded that simulated daily spring tides represent a stress factor for S. europaea.
The death of the plants after 10 days of prolonged freshwater flooding (data not shown) and the fact that the plants continue to grow under freshwater tidal conditions demonstrates the high adaptation of S. europaea to tidal floods and the severe stress that continuous freshwater flooding causes to this salt-tolerant species. Comparing the reactions of S. europaea to prolonged saltwater and prolonged freshwater submergence demonstrate the high resilience of the plant in the presence of salt. The close relative of S. europaea, Sarcocornia fruticosa (syn. S. fruticosa, Arthrocnemum fruticosum) translocates oxygen to its roots when partially submerged, but not when completely submerged (Pellegrini et al. 2017). There is a possibility that annual species belonging to the Salicornia genus demonstrate similar behaviour due to the presence of a well-connected aerenchyma (de Fraine 1913; Moatabarniya et al. 2022). Furthermore, the fact that S. europaea maintains constant chlorophyll fluorescence in both tidal systems, despite the high difference in soil oxygen concentration, demonstrates the high adaptation to tidal flooding with saltwater.
Prolonged submergence has been investigated in various plant species (Manzur et al. 2009; Hattori et al. 2011; Bailey-Serres et al. 2012). Collectively, two main strategies to survive prolonged submergence were described: (1) quiescence; and (2) escape strategy. In the quiescence strategy, plant growth and metabolism are shut down, while plants with the escape strategy stimulate the elongation growth in order to reach the air contact (Bailey-Serres and Voesenek 2008). However, it is also possible for a plant to switch between both strategies depending on the depth of submergence (Manzur et al. 2009). The growth inhibition under prolonged submergence and the restricted but continued growth under tidal conditions are indicators for a possible quiescence strategy in S. europaea. Nonetheless, based on the experiments conducted, a switch between both strategies cannot be excluded.
Adaptation of S. europaea to high salinities
Even without submergence, the development of not salt pre-treated plants is drastically reduced compared to salt pre-treated plants (Fig. 4a). This effect cannot be reversed by later salt treatment (Fig. 5b), hinting towards the requirement of salt during the early developmental stage for adequate growth. Morphological evaluations to high salt concentrations (1.3–2.5 M), revealed that S. europaea is able to grow even at the highest salt concentration (Fig. 5). A comparison of the morphological changes between salt and tidal flooding conditions showed that restricted branching is a reaction to both tidal flooding and high salt concentrations. A clear separation of salt and flooding responses depending on the morphology is not possible, which is why we also investigated stress reactions on a molecular level (Figs 7 and 8).
Influence of S. europaea on the oxygen content
Further characterisation of the growth conditions in our tidal system included the oxygen measurement of the water (Fig. 6a). In both systems the water oxygen concentration was constant at 20% (v/v) during high tide. The fact that hypoxia related genes are not induced in the tidal systems (Fig. 7) may therefore be explained by the normal oxygen concentration in the water of both systems.
However, soil oxygen content varied strongly between saltwater (20% v/v) and freshwater tide system (1% v/v; Fig. 6a) and neither of them matched the natural conditions (4% v/v; Fig. 6b). Even though hypoxic conditions are present in the soil of the freshwater tide system, it is not sufficient to induce hypoxia related gene expression in the shoot (Fig. 7). In the saltwater system, the high oxygen concentration of the soil may be contributed by an aeration of the rhizosphere by S. europaea (Fig. 4a). Shoot oxygenation was detected during submergence in S. fruticosa, a close relative of S. europaea (Kadereit et al. 2007; Pellegrini et al. 2017). Similarly, the oxygenation of the roots of S. fruticosa during submergence was detected, which possibly correlates to our observations on S. europaea rhizosphere in the salt marsh (Fig. 6c). Soil oxygenation can arise due to the absence of an apoplastic root barrier via radial oxygen loss (ROL) (Armstrong et al. 1990). However, this soil oxygenation has been shown to be beneficial for the microbial communities especially in wetlands (Prihatini and Soemarno 2023). Indeed, a low oxygen concentration was measured in the saltwater tide exposed greenhouse soil without plants (Fig. 6e). In combination with the high oxygen concentrations of the saltwater tide exposed greenhouse soil with plants (Fig. 6a), it is likely that S. europaea transports oxygen to its rhizosphere.
Influence of the soil composition on the oxygen availability for S. europaea
Salt marsh soils of lower intertidal zones (e.g. pioneer zone) are known for the coexistence of oxic and anoxic conditions (Zedler et al. 2008). Microbial soil activity of both tidal systems was determined due to the great oxygen difference in the soil (Fig. 6b). The measured soil activity was four times higher in freshwater tide conditions compared to saltwater tide conditions. Since the same soil (greenhouse soil) was used for all tidal experiments, it can be assumed that also the same microbiome was introduced into the systems. Soil activity was previously used to investigate the reaction of soil microbiome to saline conditions, a salinity as low as 8 mS cm−2 result in a smaller microbiome (Saviozzi et al. 2011). The low soil respiration in the saltwater tide system might therefore be explained by an affected microbiome due to high salinity (0.5 M). It has also been shown that the composition of microbial communities changes with increasing salinity (Mazhar et al. 2022). Therefore, when the salt stress is imposed to non-acclimated soil microbial communities, soil respiration as well as microbial composition are altered. The apparent higher oxygen consumption in the saltmarsh soil, compared to the greenhouse soil, could be related to the acclimated community toward oxygen fluctuations expected in the saltmarsh environment, which allow the concomitant presence of aerobic and anaerobic microorganisms. Halophytic microorganisms might therefore be introduced into the greenhouse soil by mixing it with saltmarsh soil (Fig. 6e).
In the natural habitat, bacterial and fungal communities of the rhizosphere of S. europaea have been investigated (Furtado et al. 2019; Razzaghi Komaresofla et al. 2019), and various salt-tolerant (halophytic) bacteria and fungi have been identified. The absence of such a halophytic microbiome result in an oxygenation of the soil by the plant due to the lack of soil respiration, as we observe it in the saltwater tide system. Therefore, we suggest that the interplay of S. europaea and halophytic microbiome has a major impact on the soil oxygenation.
Gene expression in S. europaea after sequential salt and flooding
The unchanged gene expression during tidal conditions (Fig. 7) could not only be based on the water oxygen concentration it could also be a result of the high adaption of S. europaea to oxygen deficiency caused by tidal floods, for example. Investigations of the same genes under laboratory hypoxia (1% (v/v)) showed a 10–fold higher gene expression compared to tidal flooding. These results confirm that these hypoxia related genes can be induced and that the plants do not experience hypoxia during tidal flooding. Interestingly, the same genes were differentially expressed under sequential salt and hypoxia treatment (Fig. 8). Thereby, sequential salt treatment led to both higher expression (SeADH1 and SeHB1) and lower expression (SePCO1 and SeLBD41) of hypoxia related genes under hypoxia. This points towards an interplay of gene regulation between genes responsible for the adaptation to salt and oxygen concentrations. The transcriptome of Porteresia coarctata has been analysed under salt and waterlogging conditions. Here, 30.5% of the expressed genes respond to more than one stress condition (Garg et al. 2014; Martins et al. 2024). These findings support the theory of a regulatory interplay.
Conclusion
Our study presents the extremophile S. europaea as suitable organism to study simultaneous salt and flooding tolerance responses. S. europaea appears to be able to shape its environment in regard to soil oxygenation. This allows the interaction of the plant with a specific root microbiome, that may positively influence the plant’s tolerance. Further experiments are required to characterise the impact of the root microbiome on the tolerance of S. europaea. Morphological and photosynthetic measurements after daily spring tide demonstrate the high adaptation of S. europaea to tidal floods. Sequential application of salt and hypoxia alters the gene expression of hypoxia related genes under low oxygen. These results demonstrate the importance of investigating the response of plants to multiple sequential conditions, as tolerance mechanisms influence each other. Further analysis on simultaneous salt and low oxygen conditions could break down the interplay of both tolerance mechanisms.
Data availability
The data that support this study will be shared upon reasonable request to the corresponding author.
Conflicts of interest
Joost T. van Dongen is an Editor of Functional Plant Biology and was blinded from the peer review process for this paper. The authors declare no other conflicts of interest.
Author contributions
A.J., L.F. and J.T.v.D. designed the experiments, evaluated the data and wrote the manuscript. A.J., J.R., L.G. and B.E. performed experiments and data evaluation.
References
Acosta-Motos JR, Ortuño MF, Bernal-Vicente A, Diaz-Vivancos P, Sanchez-Blanco MJ, Hernandez JA (2017) Plant responses to salt stress: adaptive mechanisms. Agronomy 7, 18.
| Crossref | Google Scholar |
Andrews S (2010) FastQC: A Quality Control tool for High Throughput Sequence Data. Available at https://www.bioinformatics.babraham.ac.uk/projects/fastqc/
Bailey-Serres J, Voesenek LACJ (2008) Flooding stress: acclimations and genetic diversity. Annual Review of Plant Biology 59, 313-339.
| Crossref | Google Scholar | PubMed |
Bailey-Serres J, Lee SC, Brinton E (2012) Waterproofing crops: effective flooding survival strategies. Plant Physiology 160, 1698-1709.
| Crossref | Google Scholar | PubMed |
Baker NR (2008) Chlorophyll fluorescence: a probe of photosynthesis in vivo. Annual Review of Plant Biology 59, 89-113.
| Crossref | Google Scholar | PubMed |
Billings WD, Mooney HA (1968) The ecology of arctic and alpine plants. Biological Reviews 43, 481-529.
| Crossref | Google Scholar |
Biswal B, Joshi PN, Raval MK, Biswal UC (2011) Photosynthesis, a global sensor of environmental stress in green plants: stress signalling and adaptation. Current Science 101, 47-56.
| Google Scholar |
Bliss LC (1971) Arctic and alpine plant life cycles. Annual Review of Ecology and Systematics 2, 405-438.
| Crossref | Google Scholar |
Bolger AM, Lohse M, Usadel B (2014) Trimmomatic: a flexible trimmer for Illumina sequence data. Bioinformatics 30, 2114-2120.
| Crossref | Google Scholar | PubMed |
Cooper A (1982) The effects of salinity and waterlogging on the growth and cation uptake of salt marsh plants. New Phytologist 90, 263-275.
| Crossref | Google Scholar |
de Fraine E (1913) The anatomy of the genus Salicornia. Botanical Journal of the Linnean Society 41, 317-348.
| Crossref | Google Scholar |
Fan P, Nie L, Jiang P, Feng J, Lv S, Chen X, Bao H, Guo J, Tai F, Wang J, Jia W, Li Y (2013) Transcriptome analysis of Salicornia europaea under saline conditions revealed the adaptive primary metabolic pathways as early events to facilitate salt adaptation. PLoS ONE 8, e80595.
| Crossref | Google Scholar |
Furtado BU, Gołębiewski M, Skorupa M, Hulisz P, Hrynkiewicz K (2019) Bacterial and fungal endophytic microbiomes of Salicornia europaea. Applied and Environmental Microbiology 85, e00305-19.
| Crossref | Google Scholar |
Garg R, Verma M, Agrawal S, Shankar R, Majee M, Jain M (2014) Deep transcriptome sequencing of wild halophyte rice, Porteresia coarctata, provides novel insights into the salinity and submergence tolerance factors. DNA Research 21, 69-84.
| Crossref | Google Scholar | PubMed |
Grabherr MG, Haas BJ, Yassour M, Levin JZ, Thompson DA, Amit I, Adiconis X, Fan L, Raychowdhury R, Zeng Q (2011) Full-Length transcriptome assembly from RNA-Seq data without a reference genome. Nature biotechnology 29, 644-652.
| Crossref | Google Scholar |
Haas BJ, Papanicolaou A, Yassour M, Grabherr M, Blood PD, Bowden J, Couger MB, Eccles D, Li B, Lieber M, MacManes MD, Ott M, Orvis J, Pochet N, Strozzi F, Weeks N, Westerman R, William T, Dewey CN, Henschel R, LeDuc RD, Friedman N, Regev A (2013) De novo transcript sequence reconstruction from RNA-seq using the Trinity platform for reference generation and analysis. Nature Protocols 8, 1494-1512.
| Crossref | Google Scholar | PubMed |
Hattori Y, Nagai K, Ashikari M (2011) Rice growth adapting to deepwater. Current Opinion in Plant Biology 14, 100-105.
| Crossref | Google Scholar | PubMed |
Hirabayashi Y, Mahendran R, Koirala S, Konoshima L, Yamazaki D, Watanabe S, Kim H, Kanae S (2013) Global flood risk under climate change. Nature Climate Change 3, 816-821.
| Crossref | Google Scholar |
Holt RD (2009) Bringing the Hutchinsonian niche into the 21st century: ecological and evolutionary perspectives. Proceedings of the National Academy of Sciences 106, 19659-19665.
| Crossref | Google Scholar |
Huang X, Madan A (1999) CAP3: a DNA sequence assembly program. Genome Research 9, 868-877.
| Crossref | Google Scholar | PubMed |
Isermeyer H (1952) Eine einfache Methode zur Bestimmung der Bodenatmung und der Karbonate im Boden. Zeitschrift für Pflanzenernährung, Düngung, Bodenkunde 56, 26-38 [In German].
| Crossref | Google Scholar |
Jacoby RP, Taylor NL, Millar AH (2011) The role of mitochondrial respiration in salinity tolerance. Trends in Plant Science 16, 614-623.
| Crossref | Google Scholar | PubMed |
Jäggi W (1976) Die Bestimmung der CO2-Bildung als Maß der bodenbiologischen Aktivität. Schweizer Landwirtschaftliche Forschung 15, 371-380 [In German].
| Google Scholar |
Kadereit G, Ball P, Beer S, Mucina L, Sokoloff D, Teege P, Yaprak AE, Freitag H (2007) A taxonomic nightmare comes true: phylogeny and biogeography of glassworts (Salicornia L., Chenopodiaceae). Taxon 56, 1143-1170.
| Crossref | Google Scholar |
Kalaji HM, Jajoo A, Oukarroum A, Brestic M, Zivcak M, Samborska IA, Cetner MD, Łukasik I, Goltsev V, Ladle RJ (2016) Chlorophyll a fluorescence as a tool to monitor physiological status of plants under abiotic stress conditions. Acta Physiologiae Plantarum 38, 102.
| Crossref | Google Scholar |
Keiffer CH, McCarthy BC, Ungar IA (1994) Effect of salinity and waterlogging on growth and survival of Salicornia europaea L., and inland halophyte. Ohio Journal of Science 94, 70-73.
| Google Scholar |
Kenrick P, Crane PR (1997) The origin and early evolution of plants on land. Nature 389, 33-39.
| Crossref | Google Scholar |
Lamichhane S, Alpuerto JB, Han A, Fukao T (2020) The central negative regulator of flooding tolerance, the PROTEOLYSIS 6 branch of the N-degron pathway, adversely modulates salinity tolerance in Arabidopsis. Plants 9, 1415.
| Crossref | Google Scholar |
Liang W, Ma X, Wan P, Liu L (2018) Plant salt-tolerance mechanism: a review. Biochemical and Biophysical Research Communications 495, 286-291.
| Crossref | Google Scholar | PubMed |
Licausi F, Kosmacz M, Weits DA, Giuntoli B, Giorgi FM, Voesenek LACJ, Perata P, van Dongen JT (2011) Oxygen sensing in plants is mediated by an N-end rule pathway for protein destabilization. Nature 479, 419-422.
| Crossref | Google Scholar | PubMed |
Livak KJ, Schmittgen TD (2001) Analysis of relative gene expression data using real-time quantitative PCR and the 2−ΔΔCT method. Methods 25, 402-408.
| Crossref | Google Scholar | PubMed |
Loreti E, Perata P (2020) The many facets of hypoxia in plants. Plants 9, 745.
| Crossref | Google Scholar | PubMed |
Loreti E, Striker GG (2020) Plant responses to hypoxia: signaling and adaptation. Plants 9, 1704.
| Crossref | Google Scholar | PubMed |
Lv S, Jiang P, Chen X, Fan P, Wang X, Li Y (2012) Multiple compartmentalization of sodium conferred salt tolerance in Salicornia europaea. Plant Physiology and Biochemistry 51, 47-52.
| Crossref | Google Scholar | PubMed |
Ma J, Zhang M, Xiao X, You J, Wang J, Wang T, Yao Y, Tian C (2013) Global transcriptome profiling of Salicornia europaea L. shoots under NaCl treatment. PLoS ONE 8, e65877.
| Crossref | Google Scholar | PubMed |
Manzur ME, Grimoldi AA, Insausti P, Striker GG (2009) Escape from water or remain quiescent? Lotus tenuis changes its strategy depending on depth of submergence. Annals of Botany 104, 1163-1169.
| Crossref | Google Scholar | PubMed |
Martins TS, Da-Silva CJ, Shabala S, Striker GG, Carvalho IR, de Oliveira ACB, do Amarante L (2024) Understanding plant responses to saline waterlogging: insights from halophytes and implications for crop tolerance. Planta 259, 24.
| Crossref | Google Scholar |
Maxwell K, Johnson GN (2000) Chlorophyll fluorescence – a practical guide. Journal of Experimental Botany 51, 659-668.
| Crossref | Google Scholar | PubMed |
Mazhar S, Pellegrini E, Contin M, Bravo C, De Nobili M (2022) Impacts of salinization caused by sea level rise on the biological processes of coastal soils – a review. Frontiers in Environmental Science 10, 909415.
| Crossref | Google Scholar |
McGraw DC, Ungar IA (1981) Growth and survival of the halophyte Salicornia europaera L. under saline field conditions. The Ohio Journal of Science 81, 109-113.
| Google Scholar |
Mishra A, Tanna B (2017) Halophytes: potential resources for salt stress tolerance genes and promoters. Frontiers in Plant Science 8, 829.
| Crossref | Google Scholar | PubMed |
Moatabarniya S, Chehregani Rad A, Khoshkholgh Sima NA, Askari H, Zeinalabedini M, Hesarkhani Z, Ghaffari MR (2022) Morphological and anatomical changes of Salicornia roots are associated with different salinity and nutrients conditions in contrasting genotypes. Rhizosphere 24, 100629.
| Crossref | Google Scholar |
Mommer L, Pons TL, Wolters-Arts M, Venema JH, Visser EJW (2005) Submergence-induced morphological, anatomical, and biochemical responses in a terrestrial species affect gas diffusion resistance and photosynthetic performance. Plant Physiology 139, 497-508.
| Crossref | Google Scholar | PubMed |
Nagai K, Hattori Y, Ashikari M (2010) Stunt or elongate? Two opposite strategies by which rice adapts to floods. Journal of Plant Research 123, 303-309.
| Crossref | Google Scholar | PubMed |
Patel MK, Kumar M, Li W, Luo Y, Burritt DJ, Alkan N, Tran L-SP (2020) Enhancing salt tolerance of plants: from metabolic reprogramming to exogenous chemical treatments and molecular approaches. Cells 9, 2492.
| Crossref | Google Scholar | PubMed |
Pellegrini E, Konnerup D, Winkel A, Casolo V, Pedersen O (2017) Contrasting oxygen dynamics in Limonium narbonense and Sarcocornia fruticosa during partial and complete submergence. Functional Plant Biology 44, 867-876.
| Crossref | Google Scholar | PubMed |
Pellegrini E, Forlani G, Boscutti F, Casolo V (2020) Evidence of non-structural carbohydrates-mediated response to flooding and salinity in Limonium narbonense and Salicornia fruticosa. Aquatic Botany 166, 103265.
| Crossref | Google Scholar |
Razzaghi Komaresofla B, Alikhani HA, Etesami H, Khoshkholgh-Sima NA (2019) Improved growth and salinity tolerance of the halophyte Salicornia sp. by co–inoculation with endophytic and rhizosphere bacteria. Applied Soil Ecology 138, 160-170.
| Crossref | Google Scholar |
Redelstein R, Zotz G, Balke T (2018) Seedling stability in waterlogged sediments: an experiment with saltmarsh plants. Marine Ecology Progress Series 590, 95-108.
| Crossref | Google Scholar |
Rengasamy P, Olsson KA (1993) Irrigation and sodicity. Australian Journal of Soil Research 31, 821-837.
| Crossref | Google Scholar |
Rijkwaterstaat (2021) Terschelling Noordzee, Hoog- en laagwaterstanden en -tijdstippen. Ministerie van Infrastructur en Waterstaat, Netherlands. Available at https://getij.rws.nl/ [In Dutch]
Rizhsky L, Liang H, Shuman J, Shulaev V, Davletova S, Mittler R (2004) When defense pathways collide. The response of Arabidopsis to a combination of drought and heat stress. Plant Physiology 134, 1683-1696.
| Crossref | Google Scholar | PubMed |
Salazar OR, Chen K, Melino VJ, Reddy MP, Hřibová E, Čížková J, Beránková D, Aranda M, Jaremko L, Jaremko M, Fedoroff NV, Tester M, Schmöckel SM (2023) Learning from the expert: studying Salicornia to understand salinity tolerance [Preprint]. BioRxiv 2023–2004. doi:10.1101/2023.04.21.537482
Sarkar RK, Chakraborty K, Chattopadhyay K, Ray S, Panda D, Ismail AM (2019) Responses of rice to individual and combined stresses of flooding and salinity. In ‘Advances in rice research for abiotic stress tolerance’. (Eds M Hasanuzzaman, M Fujita, K Nahar, JK Biswas) pp. 281–297. (Woodhead Publishing)
Saviozzi A, Cardelli R, Di Puccio R (2011) Impact of salinity on soil biological activities: a laboratory experiment. Communications in Soil Science and Plant Analysis 42, 358-367.
| Crossref | Google Scholar |
Steffen S, Ball P, Mucina L, Kadereit G (2015) Phylogeny, biogeography and ecological diversification of Sarcocornia (Salicornioideae, Amaranthaceae). Annals of Botany 115, 353-368.
| Crossref | Google Scholar | PubMed |
Turnbull LA, Isbell F, Purves DW, Loreau M, Hector A (2016) Understanding the value of plant diversity for ecosystem functioning through niche theory. Proceedings of the Royal Society B: Biological Sciences 283, 20160536.
| Crossref | Google Scholar |
Ungar IA, Benner DK, McGraw DC (1979) The distribution and growth of Salicornia europaea on an inland salt pan. Ecology 60, 329-336.
| Crossref | Google Scholar |
van Aken HM (2008) Variability of the salinity in the western Wadden Sea on tidal to centennial time scales. Journal of Sea Research 59, 121-132.
| Crossref | Google Scholar |
van Dongen JT, Licausi F (2015) Oxygen sensing and signaling. Annual Review of Plant Biology 66, 345-367.
| Crossref | Google Scholar | PubMed |
van Regteren M, Amptmeijer D, de Groot AV, Baptist MJ, Elschot K (2020) Where does the salt marsh start? Field-based evidence for the lack of a transitional area between a gradually sloping intertidal flat and salt marsh. Estuarine, Coastal and Shelf Science 243, 106909.
| Crossref | Google Scholar |
Voegele RT, Schmid A (2011) RT real-time PCR-based quantification of Uromyces fabae in planta. FEMS Microbiology Letters 322, 131-137.
| Crossref | Google Scholar | PubMed |
Waters ER (2003) Molecular adaptation and the origin of land plants. Molecular Phylogenetics and Evolution 29, 456-463.
| Crossref | Google Scholar | PubMed |
Yang Y, Guo Y (2018) Elucidating the molecular mechanisms mediating plant salt-stress responses. New Phytologist 217, 523-539.
| Crossref | Google Scholar | PubMed |
Zabalza A, van Dongen JT, Froehlich A, Oliver SN, Faix B, Gupta KJ, Schmalzlin E, Igal M, Orcaray L, Royuela M, Geigenberger P (2009) Regulation of respiration and fermentation to control the plant internal oxygen concentration. Plant Physiology 149, 1087-1098.
| Crossref | Google Scholar | PubMed |