More fertile florets and grains per spike can be achieved at higher temperature in wheat lines with high spike biomass and sugar content at booting
M. Fernanda Dreccer A G , Kimberley B. Wockner A , Jairo A. Palta B , C. Lynne McIntyre C , M. Gabriela Borgognone D , Maryse Bourgault C , Matthew Reynolds E and Daniel J. Miralles FA CSIRO Plant Industry, Cooper Laboratory, PO Box 863, University of Queensland, Warrego Highway, Gatton, Qld 4343, Australia.
B CSIRO Plant Industry, Wembley, WA 6913, Australia.
C CSIRO Plant Industry, Queensland Bioscience Precinct, 306 Carmody Road, St Lucia, Qld 4067, Australia.
D Queensland Department of Agriculture, Fisheries and Forestry, Leslie Research Facility, 13 Holberton Street, Toowoomba, Qld 4350, Australia.
E CIMMYT, Int. Apdo. Postal 6-641, 06600 Mexico, DF, Mexico.
F Facultad de Agronomia, Universidad de Buenos Aires, CONICET and IFEVA, Av. San Martin 4453, (C 1417 DSE) Buenos Aires, Argentina.
G Corresponding author. Email: fernanda.dreccer@csiro.au
Functional Plant Biology 41(5) 482-495 https://doi.org/10.1071/FP13232
Submitted: 2 August 2013 Accepted: 30 November 2013 Published: 6 January 2014
Journal Compilation © CSIRO Publishing 2014 Open Access CC BY-NC-ND
Abstract
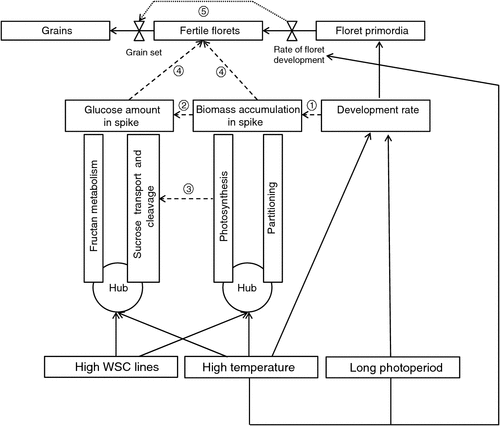
An understanding of processes regulating wheat floret and grain number at higher temperatures is required to better exploit genetic variation. In this study we tested the hypothesis that at higher temperatures, a reduction in floret fertility is associated with a decrease in soluble sugars and this response is exacerbated in genotypes low in water soluble carbohydrates (WSC). Four recombinant inbred lines contrasting for stem WSC were grown at 20/10°C and 11 h photoperiod until terminal spikelet, and then continued in a factorial combination of 20/10°C or 28/14°C with 11 h or 16 h photoperiod until anthesis. Across environments, High WSC lines had more grains per spike associated with more florets per spike. The number of fertile florets was associated with spike biomass at booting and, by extension, with glucose amount, both higher in High WSC lines. At booting, High WSC lines had higher fixed 13C and higher levels of expression of genes involved in photosynthesis and sucrose transport and lower in sucrose degradation compared with Low WSC lines. At higher temperature, the intrinsic rate of floret development rate before booting was slower in High WSC lines. Grain set declined with the intrinsic rate of floret development before booting, with an advantage for High WSC lines at 28/14°C and 16 h. Genotypic and environmental action on floret fertility and grain set was summarised in a model.
Additional keywords: floret, grain number, photoperiod, water soluble carbohydrates.
Introduction
Raising wheat yield potential, i.e. yield only limited by solar radiation, temperature, photoperiod and cultivar maturity, is a viable strategy to lift production. This approach has also demonstrated spill-over effects under moderate abiotic stress (e.g. Fischer and Edmeades 2010). Present genetic gains in yield potential are 0.3–0.6% per year in active breeding programs (Fischer and Edmeades 2010), falling behind the rate needed to keep up with food demand (Reynolds et al. 2008). Compounding the slow breeding progress, projected temperature increase for 2050 (1−3°C), together with rainfall changes, will negatively impact agricultural production in low latitude agricultural systems, most vulnerable to food security (IPCC 2007; Rosenzweig 2012). As an example, in Australia, warmer winters are predicted to shorten the wheat growing season by up to 6 weeks, particularly during pre-flowering (Zheng et al. 2012), exerting direct negative effects on resource capture and processes underpinning growth and yield (Dreccer et al. 2012). Since variation in wheat yield is mainly associated with grain number per unit area (Fischer 1985), largely defined before flowering, an understanding of the regulation of floret fertility and the passage of florets to grains in response to temperature seems topical in light of the potential shortening of the critical period for grain number formation.
A wheat spike sets about a third of the potential number of grains based on the number of floret primordia (Kirby 1974). Comparing the effects of long vs short photoperiod during the spike growing period (i.e. from terminal spikelet to anthesis, when the majority of floret development takes place), wheat floret fertility has been positively associated to (i) their developmental and anatomical status at the beginning of the period of rapid biomass accumulation of the spike (González et al. 2005) and (ii) increased sugar concentration in the growing spike (Ghiglione et al. 2008) or spike weight at anthesis (Miralles et al. 2000; Gonzalez et al. 2011). The idea that floret death is a process triggered by the stage of development of the most advanced floret in the spike has also been proposed (Bancal 2008, 2009). Long days after terminal spikelet accelerated the rate of floret development, brought forward the maximum growth rate of the spike and resulted in a reduced number of fertile florets per spikelet at anthesis (González et al. 2005). Ghiglione et al. (2008) proposed that the acceleration of spike growth under long days led to depletion of the spike carbohydrate pool and floral programmed cell death by autophagy. Dougherty et al. (1975) and Fischer and Stockman (1980) have shown that increased levels of water soluble carbohydrates (WSC) in the spike were concurrent with higher grain number per spikelet and per spike in crops responding to shading, thinning, irrigation and fertilisation. Subsequently, Fischer (1985) captured the response of grain number m–2 to resource availability during the period of rapid spike growth in the photothermal quotient, the ratio between daily photosynthetically active radiation (PAR) and average temperature. Essentially, a higher amount of radiation absorbed during that period was positively related to grain number, whereas higher temperatures had the antagonistic effect of shortening the period, leading to a lower spike biomass and grain number per unit area (Fischer 1985). Temperature effects on floret fertility at the spike level have not yet been explored to the depth that photoperiod effects have, except for the shortening of the spike growth period and its indirect impact on spike biomass.
It is likely that genotypic factors related to sugar metabolism influence the final number of fertile florets. Under drought, carbohydrate metabolism enzymes play a crucial role in grain set in tolerant maize germplasm (Boyer and McLaughlin 2007) and pollen viability in wheat (Ji et al. 2010). In maize under water stress, functional reversion analysis by sucrose feeding (see Boyer and McLaughlin 2007) confirmed the role of glucose in floral abortion and identified a cell wall and a soluble invertase among the few genes controlling sugar uptake by the ovary. In wheat, Ji et al. (2010) observed a difference in storage carbohydrate accumulation in drought-sensitive and drought tolerant wheat. Interestingly, genotypic variation for WSC accumulation in the stem, mainly fructans, is well established in wheat (Rebetzke et al. 2008; Dreccer et al. 2009) and consistent with different levels of expression in fructan metabolism enzymes (Xue et al. 2008). It is unclear whether a higher level of WSC in stems also extends to more simple sugars in the spike, such as glucose, which have been related with floret fertility, nor what the associated gene expression profile may be. Furthermore, the interaction between genotypes accumulating contrasting WSC and temperature has not been investigated.
This study tested the hypothesis that at higher temperatures, a reduction in floret fertility is associated with a decrease in soluble sugars and this response is exacerbated in genotypes known to have low WSC. Recombinant inbred lines differing in WSC accumulation in the stems (Dreccer et al. 2009) were grown under different photoperiod and temperature from terminal spikelet to anthesis and diverse techniques, from 13C labelling to gene expression, were utilised to test the hypothesis.
Materials and methods
Treatments and experimental design
A glasshouse experiment was conducted at The University of Queensland, Gatton (27°34′S, 152°20′E). Four recombinant inbred lines, here also called genotypes, from the Seri/Babax population (Olivares-Villegas et al. 2007) were chosen due to contrasting water soluble carbohydrate concentration (WSCc, mg WSC g–1 DW) in the stem + sheaths at anthesis while fairly similar in height and phenology (Dreccer et al. 2009; Rattey et al. 2009). The genotypes SB003 and SB165 were ‘low’, and SB062 and SB169 were ‘high’ in stem WSCc at anthesis (e.g. ~100 mg g–1 vs 200 mg g–1, Dreccer et al. (2013)). Genetic map and quantitative trait loci (QTL) information (Mathews et al. 2008; McIntyre et al. 2010) was used to select the lines such that they contained as many High and Low WSCc QTL as possible and were as genetically diverse as possible for all marker loci (CL McIntyre, pers. comm.). The objective was to try to sample different combinations of genes leading to either low or high WSC accumulation, i.e. not to select genetically ‘similar’ lines. The lines had the same genotype for vernalisation (VRN-A1, VRN-B1, VRN-D1) and one photoperiod gene (PPD-D1), and were classified as ‘spring wheats’ (B Trevaskis, pers. comm.).
The genotypes were sown in four glasshouse compartments, at 20/10°C (day/night) and 11 h photoperiod (0600–1700 h) until terminal spikelet, then continued at 20/10°C or 28/14°C combined with 11 or 16 h photoperiod until anthesis. After anthesis, all cabinets were switched to 16 h, continuing at the same previous temperature regime. Photoperiod was extended using a mixture of incandescent and fluorescent lamps of low intensity. Radiation blockage curtains were closed at 11 h photoperiod in all compartments, to standardise the amount of daily PAR. Temperature and photoperiod treatments were imposed from terminal spikelet to avoid any impact on the total number of spikelets per spike. The experiment was fully irrigated, fertilised weekly with a full strength nutrient solution and kept pest and disease free. Plant density was 98 plants m−2.
The nature of the photoperiod and temperature treatments prevented them from being randomised to different experimental units (groups of 24 pots of the same genotype) within the glasshouse. Therefore, a variant of the split-plot design where a systematic arrangement of the photoperiod and temperature treatments is applied to the experimental units was chosen (Cochran and Cox 1992). The experimental units were arranged according to a randomised complete block design with three replicates for each of the photoperiod by temperature combinations.
Phenology and harvests
Phenological stages using the decimal code (DC) by Zadoks et al. (1974) and leaf appearance using the Haun index (Haun 1973) were recorded twice a week until anthesis. Thermal time accumulation was calculated using Tbase = 0°C. Plant apices were dissected regularly until terminal spikelet. Plants were harvested at the start of the treatment, during stem elongation (52 days after emergence, DAE), booting (DC45), anthesis (DC65) and maturity. On each occasion, two to four pots with two plants each were harvested, organs counted (stems and spikes) and separated. Green leaf area was measured, and organs dried at 70°C for 3 days and weighed. At maturity, main shoot and tiller spikes were threshed separately. The number of fertile and sterile spikelets was recorded as well as the number of grains per spikelet in main shoot spikes. Harvest index was calculated on a DW basis at maturity.
Gas exchange
Gas exchange measurements were taken with a LI-6400 (Li-Cor Biosciences, Lincoln, NE, USA) on the flag leaf at anthesis, between 1000 and 1500 hours. Flow rate was 500 µmol s–1, light intensity (LED red-blue light source) was 800 µmol m–2 s–1, and CO2 concentration 400 μL L–1.
Floret development and grain set
Two main shoot spikes per treatment and replicate were collected at 52 DAE, booting and anthesis, kept in 70% ethanol at 4.0°C until observation under a stereomicroscope (SZ61 Olympus, Notting Hill, Vic., Australia). Floret development in the Waddington scale (Waddington et al. 1983) was recorded at 52 DAE and booting, in three pairs of spikelets per spike, central (middle of the spike), apical (third and fourth spikelet from the top), and basal (second and third fertile spikelets from the base). At anthesis, all fertile florets in each spikelet were scored.
The relative floret development rate (day–1) between stem elongation (52 DAE) and booting was calculated as:

where w2 and w1 were the floret score in the Waddington scale at booting and 52 DAE, respectively; and T2 and T1 days from emergence to booting and 52 DAE respectively.
Grain set was calculated as the ratio between the grain number at maturity and fertile florets at anthesis in main shoot spikes.
Sugars
In plants growing at both temperatures and 11 h photoperiod, samples from flag leaf and spike at booting and anthesis, with the addition of peduncle at anthesis were frozen and kept at −20°C until freeze-dried for sugar analysis and gene expression. A subsample was extracted in 10 mL of water at 95°C for 10 min to inactivate microbial contamination and hydrolysing enzymes. This step was followed by two incubations overnight at 70°C, with the supernatant from the first extraction stored at −20°C. Sucrose, glucose, and fructose were measured by HPLC using the method by Bonnett et al. (2001).
WSC in stems plus sheaths (referred to as ‘stems’ throughout the text) at anthesis were determined by sequential extraction of ground tissue in 80% ethanol and water (van Herwaarden et al. 1998) followed by determination using anthrone (Yemm and Willis 1954) with fructose as the standard.
Gene expression
RNA was extracted and cDNA synthesised following the method by Xue et al. (2008). The samples taken for sugar analysis were also analysed for gene expression, with the addition of the internode below the peduncle and the omission of spike at booting due to insufficient sample. Real-time PCR was performed using TaRP15 (RNA polymerase I, II and III, 15 kDa subunit) as an internal reference gene and seven selected wheat genes (see Table S1, available as Supplementary Material to this paper) (Xue et al. 2008). For each of the four genotypes and corresponding treatment, each gene was analysed separately in two replicates (each replicate comprising two plants), each of these was then sub-sampled three times after extraction. The expression level of each gene was calculated relative to the expression of the internal reference gene (Shaw et al. 2009); the internal reference is known to be stably expressed in different tissues and genotypes (Xue et al. 2008). This approach was adopted to provide an approximate estimation of relative expression levels among various wheat genes as absolute quantification of mRNA levels for this number of genes and tissue samples using cRNA or cDNA calibration curves was not possible. The genes were chosen for their role in photosynthesis (TaRbcS, ribulose-1,5-biphosphate carboxylase oxygenase, small subunit), sucrose transport (TaSuT, sucrose transporter), sucrose degradation (TaSuSy, sucrose synthase; TaSAInv, soluble acid invertase; TaCWInv, vacuolar invertase) and fructan synthesis (Ta1-SST, sucrose:sucrose 1 fructosyltransferase; Ta6-SFT, sucrose:fructan 6-fructosyltransferase) (Table S1).
13C labelling
Plants were labelled with 13CO2 at booting and anthesis at 20/10°C and 28/14°C under 11 h (Palta et al. 1994; Palta and Gregory 1997). A Mylar film (Dow Co., Melbourne, Vic., Australia) chamber was placed over the plants and sealed with masking tape to the ground sheet of polyethylene films beneath the pots. Air inside the chamber was stirred with a 20 cm diameter fan. Canopy labelling of 13CO2 was conducted between 1000 and 1500 hours on clear sky days. 13CO2 (99% atom) was injected until air CO2 concentration reached 800–900 μL L–1. Total CO2 concentration in the chamber was monitored with a LI-6251 CO2 infrared gas analyser (Li-Cor Biosciences). Forty-eight hours after 13CO2 feeding, spike, flag leaf and penultimate leaf and stem of the main shoot, and green leaves and spike and stems from tillers were sampled to measure the allocation of fixed 13C (Palta 2001). Unlabelled plants were simultaneously sampled for natural 13C abundance. Samples were dried at 70°C for 3 days and weighed, ground with a ball mill, and analysed for C content and 13C atom% by an automated nitrogen carbon analyser–mass spectrometer, consisting of a 20/20 mass spectrometer connected to an ANCA–SL preparation system (Europa Scientific Ltd, Crewe, UK).
Statistical analysis
Under the variant of the split-plot design used, it is only possible to test for the significance of the interaction between photoperiod, temperature and their interaction with genotype and calculate least significance differences (l.s.d.) for multiple comparisons. The linear model fitted to each of the traits comprises a blocking structure including the effect of replicate within each of the photoperiod by temperature combinations, and a treatment structure. The treatment structure includes the main effects of WSC level and genotype within WSC level, as well as their interactions with photoperiod and temperature. The sugar, gene expression and 13C traits were measured only for the 11 h photoperiod. The linear model fitted to these traits includes main effects of WSC and temperature and their interaction.
All statistical analyses were performed using the analysis of variance procedure in Genstat, 14th edn (VSN International, Hemel Hempstead, UK). Residual diagnostics were performed to check the validity of the model assumptions (normality and constant variance) as well as to detect outliers.
Results
Genotypes ranged from flowering on the same date to up to 4 days earlier depending on the environment (Table 1). Increased temperature reduced the emergence-anthesis period up to 3 days under 11 h and 9 days under 16 h. Extended photoperiod only reduced the emergence-anthesis period at 28/14°C. The genotypes grouped per WSC level consistently differed (P = 0.006) in stem WSCc at anthesis (High WSC = 96.1, Low WSC = 78.7 mg WSC g–1), the interaction with temperature or photoperiod was not significant.

|
Yield and components
As plants were grown in pots, only differences in yield components also shown in the field (Dreccer et al. 2009) or relevant to the hypotheses were highlighted. Yield was 9% lower at 28/14°C compared with 20/10°C and 7% lower at 11 h compared with 16 h photoperiod. The 28/14°C temperature regime reduced individual grain weight by 8% and grain number per plant by 7% with respect to 20/10°C (Table 1). Grain number per plant was 14% lower when plants were grown under 16 h compared with 11 h photoperiod; hence, the grain yield advantage at 16 h was due to a more than proportional increase in grain weight (~25%).
Differences between genotypes dominated the results (Table 1). High WSC lines yielded 24% more than low WSC ones (P < 0.001) on average across environments, associated with a higher harvest index (14%, P < 0.001) and heavier grains (21%, P < 0.001), but did not differ in grain number per plant. There was no treatment effect on the final number of spikes per plant; the average for the experiment was 5.3 spikes plant–1. However, High WSC lines had on average 10% higher grain number per spike (High WSC = 35.9, Low WSC = 32.5, P < 0.05).
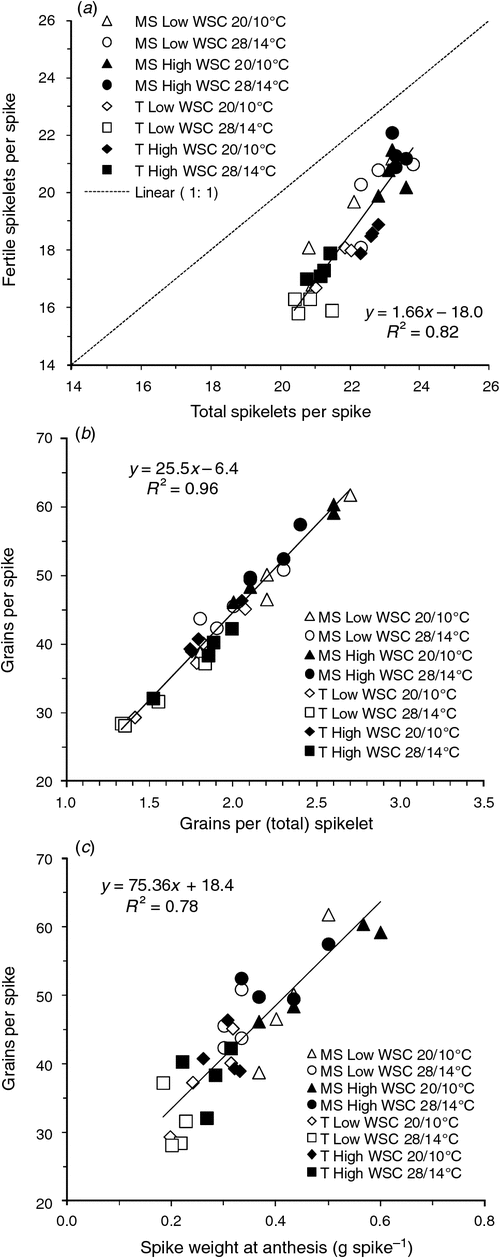
Differences in grains per spike were analysed for main shoot and tillers (Fig. 1). Differences in spikelet number between WSC levels within an environment and stem cohort were in the order of 0.5 spikelets, consistent with environmental treatments starting at terminal spikelet (Fig. 1a). Variations in grains per spike were explained by changes in the number of grains per spikelet (Fig. 1b) and associated to the spike weight at anthesis across stem cohorts (Fig. 1c).
|
Floret development in main shoot
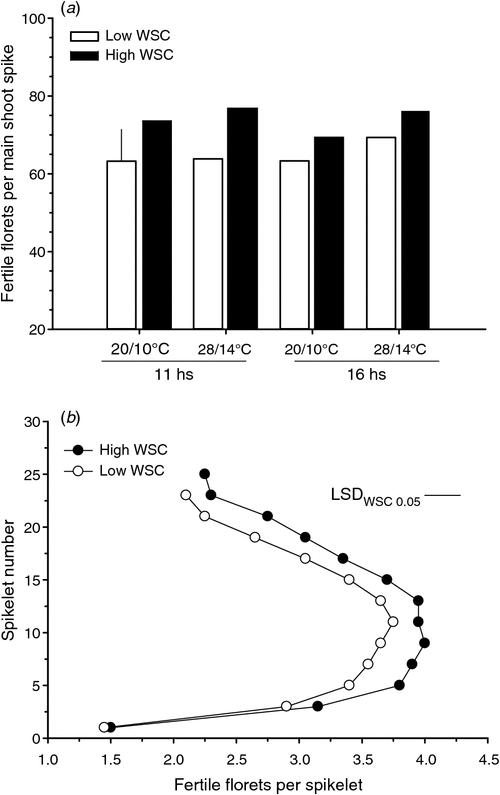
High WSC lines had ~10 fertile florets more per main shoot spike at anthesis than Low WSC lines, on average across environments (P < 0.001) (Fig. 2a), with genotypic differences based on the number of fertile florets per spikelet (High WSC = 3.2, Low WSC = 2.9 florets per spikelet, P = 0.008, l.s.d. = 0.2) (Fig. 2b). High WSC lines had 18% more fertile florets at 11 h, compared with 9% across temperature levels at 16 h, but the interaction of genotype × temperature × photoperiod was not significant.
|
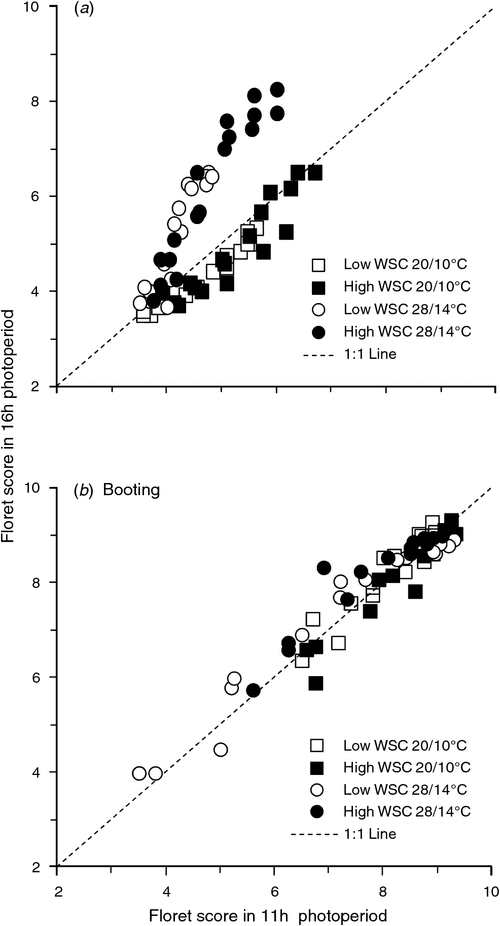
At 52 DAE, floret development scores in the Waddington scale were more advanced at 28/14°C and 16 h photoperiod, particularly in High WSC lines (Fig. 3a). However, externally, High and Low WSC lines were similar in terms of leaf appearance (Haun scores, data not shown). At booting, genotypic differences were only observed at 28/14°C (Fig. 3b), with Low WSC lines scoring 9% less developed compared with High WSC lines.
|
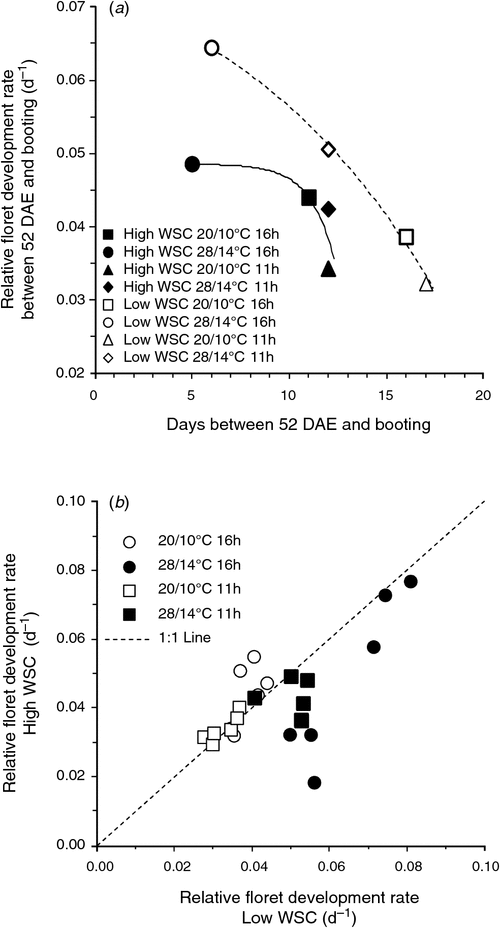
The relative floret development rate between 52 DAE and booting was calculated to derive the intrinsic developmental progress, independent from the initial floret score. It declined with the duration of the period between 52 DAE and booting (Fig. 4a). High WSC lines had a lower relative floret development rate compared with Low WSC lines at 28/14°C at both photoperiods, whereas the duration of the period was similar between genotype categories (Fig. 4a, b). In contrast at 20/10°C, High WSC lines had only a slightly higher relative floret development rate, but a substantially shorter duration of the phase (Fig. 4a, b).
|
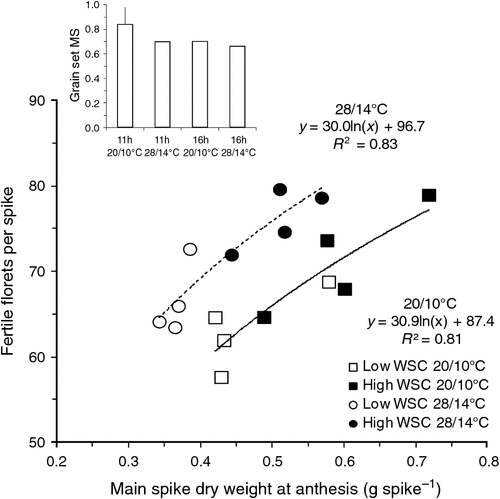
The number of fertile florets per spike was associated with the spike weight at anthesis (Fig. 5). Differently to the grain number per spike (Fig. 1c), the number of fertile florets at a given spike weight was higher at the higher temperature. This difference did not translate into a proportionally higher grain number per spike at 28/14°C or 16 h photoperiod because the grain set was lower (see inset in Fig. 5).
|
13C fixation at booting and anthesis
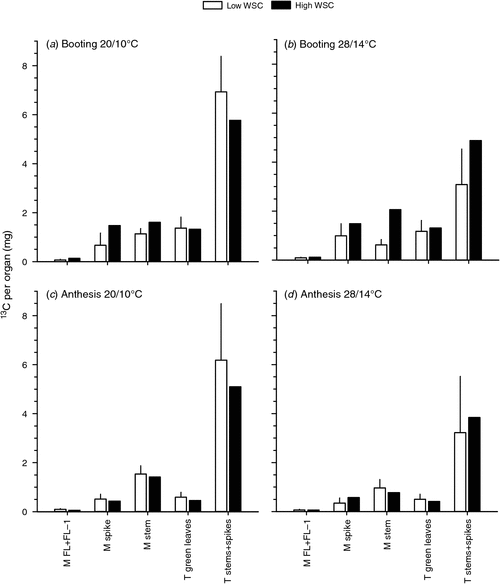
The allocation of recently fixed C was evaluated with exposure to 13CO2 at both temperatures under 11 h at booting and anthesis. The interaction between WSC level and temperature was significant (P < 0.01) for the total amount of 13C fixed per plant at booting. While at 20/10°C, 9.2 vs 8.9 mg 13C were fixed by High vs Low WSC lines respectively, at 28/14°C High WSC lines fixed a significantly higher amount compared with Low WSC lines, 11.0 vs 7.1 mg 13C respectively (l.s.d.TxWSC-0.05 = 1.8). At booting, main shoot spikes and stems tended to have a higher amount of 13C in High WSC lines (Fig. 6a, b). The total amount of 13C in main shoots increased in high and decreased in Low WSC lines, respectively, at 28/14°C compared with 20/10°C (Fig. 6b). At anthesis, the net 13C assimilation per plant decreased with higher temperature (7.8 vs 5.6 mg 13C per plant at 20/10 vs 28/14°C), the interaction between temperature and genotype was not significant (Fig. 6c, d). No differences in flag leaf photosynthesis rate were detected at anthesis, the average of treatments was 12.4 µmol m–2 s–1 (s.e.T×WSC = 0.574).
|
The excess 13C, equivalent to a concentration of 13C above normal abundance levels, was markedly higher at booting compared with anthesis (see Fig. S1, available as Supplementary Material to this paper). Data on relative allocation of 13C excess between organs are available in Fig. S2.
Sugars per organ at booting and anthesis
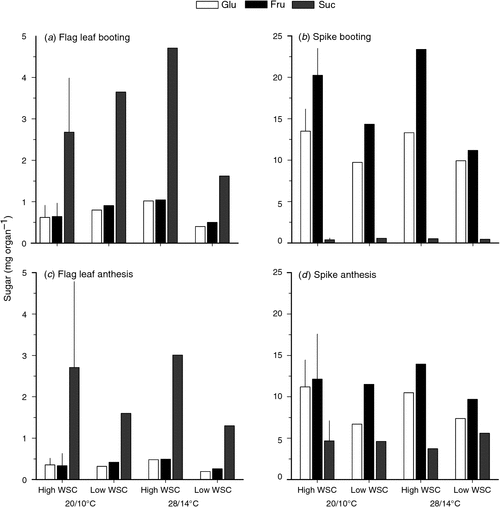
The flag leaf sucrose amount (Fig. 7a, c) and concentration (Fig. S3) declined from booting to anthesis. At booting, the interaction WSC level × temperature was significant for sucrose and glucose amount (Fig. 7a, c) and concentration (Fig. S3a, c) (P < 0.001) in the flag leaf, with similar values at 20/10°C, but higher at 28/14°C in High WSC vs Low WSC lines. A similar interaction was observed for fructose concentration (P = 0.009) and amount (P = 0.002) in the flag leaf at booting.
|
Spike glucose and fructose amounts and concentrations were higher at booting than anthesis, whereas the reverse was true for sucrose; consistent with the spike having high metabolic activity but no photosynthetic capacity at booting (Fig. 7b, d and S3). High WSC lines had a higher amount of glucose (P < 0.002) and fructose (P < 0.001) in the spike at booting than the Low WSC lines (Fig. 7), but similar concentrations (Fig. S3). At booting, spikes from Low WSC lines had higher sucrose concentration (P < 0.001) across temperatures compared with High WSC lines; although this was true only at 28/14°C at anthesis (PT×WSC = 0.03). There were no significant differences in the amount of sucrose in the spike at booting or anthesis between contrasting WSC lines (Fig. 7).
Sugars were also analysed in the peduncle at anthesis, but the organ was not weighed separately, hence concentrations rather than amounts are reported (Fig. S4). The glucose (P = 0.003) and fructose (P = 0.0035) in the peduncle at anthesis were higher in the high than the Low WSC lines; sucrose concentration was higher in low than the High WSC lines (P = 0.036).
Sugar related gene expression profiles at booting and anthesis
The mRNA transcript levels of genes with roles in photosynthesis, sugar transport and metabolism were measured in the flag leaf at booting, and flag leaf, spike, peduncle and internode at anthesis (Table 2). In the flag leaf at booting, the High WSC lines had higher levels of expression of enzymes involved in photosynthesis (TaRbcS) and sugar transport (TaSuT) than the Low WSC lines at both temperatures. The interaction between temperature and WSC level was significant for the expression of the two invertases, TaSAInv and TaCWInv, and a fructosyltransferase (Ta1-SST). Ta1-SST had significantly higher levels of expression in High vs Low WSC lines at 20/10°C but no significant difference at 28/14°C. TaSAInv was more highly expressed in High vs Low WSC lines at 20/10°C but the reverse was observed at 28/14°C. Lower expression of TaCWInv was also observed in the High vs Low WSC lines at 28/14°C but there was no difference at 20/10°C.
In the flag leaf at anthesis, High WSC lines had higher level of expression of the sucrose degrading enzyme TaSuSy than Low WSC lines. The interaction between temperature and WSC level was significant also on the expression of TaSAInv (P = 0.012) with a strong decrease in the expression levels in both High and Low WSC lines at 28/14°C. In spike tissue collected at anthesis, High WSC lines had significantly lower levels of expression of TaRbcS, TaSuT, TaSuSy, and TaCWInv than the Low WSC lines at both temperatures. The interaction between temperature and WSC level was significant for TaSAinv and Ta1-SST with an increase in expression in High WSC lines at 20/10°C. In the peduncle at anthesis, High WSC lines had lower levels of expression of TaRbcS, TaCWInv, and Ta6-SFT than Low WSC lines across temperature levels. In the internode below the peduncle at anthesis, High WSC lines had a higher level of expression of TaRbcS than Low WSC lines at both temperatures. There was an interaction with temperature for both TaSAInv and Ta6-SFT with higher levels of expression of Ta6-SFT and lower levels of expression of TaSAInv in High vs Low WSC lines at 20/10° but the reverse at 28/14°C.
Relations between reproductive organs, biomass, sugars and development
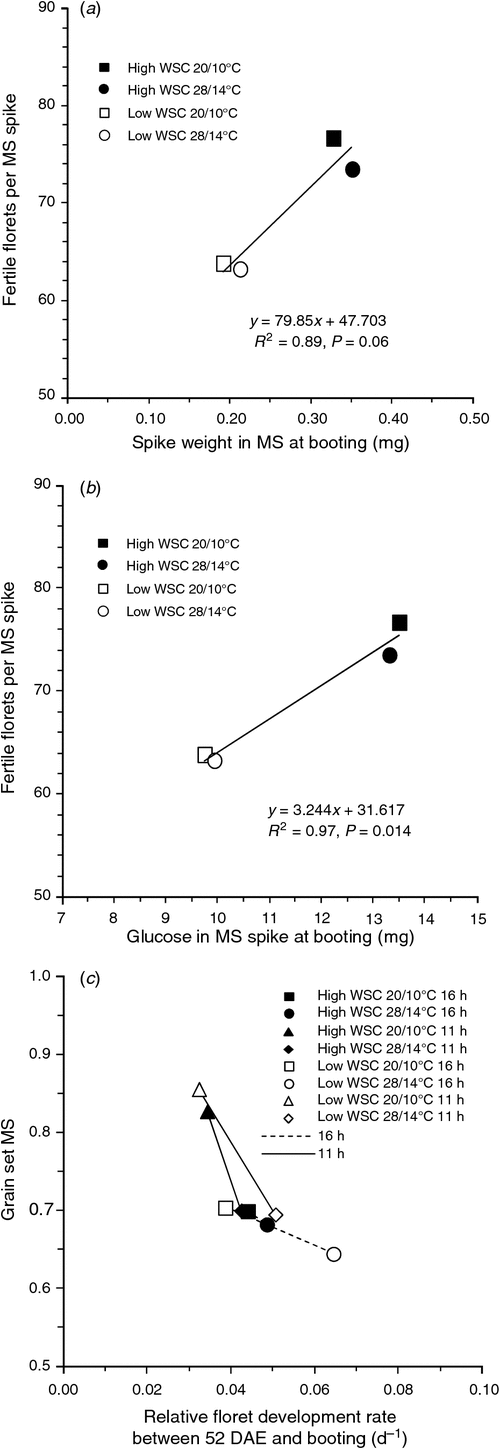
The number of fertile florets in the main shoot spike changed in the same direction as the amount of glucose in the spike at booting stage (Fig. 8b), driven by the differences in spike weight (Fig. 8a) as concentrations did not differ between WSC levels (Fig. S3). Each point in Fig. 8a, b is the average of 12 observations (two genotypes per WSC category, three replicates and two plants per replicate). There was a trend for grain set to decline with the relative floret development rate before booting (Fig. 8c), more pronouncedly with higher temperature under long photoperiod. There was no clear relation between the floret relative development rate before booting and the number of fertile florets at anthesis. Grain set was not directly related to any of the growth variables or sugar pools measured or derived variables, across genotypes, temperature and photoperiod.
|
Figure 9 outlines the main processes influencing floret fertility and grain set in this study. The type of diagram and terminology follow Tardieu et al. (2011). Three basic processes (development rate, biomass accumulation in the spike and sugar metabolism) are affected directly by temperature, photoperiod and/or genotype, with some feedbacks. Their products influence floret fertility or grain set. Circles are ‘hubs’ of coordination of processes, e.g. photosynthate production and partitioning leading to biomass accumulation per organ belong in the same hub. Solid arrows indicate a direct functional effect, e.g. high temperatures accelerating development rate. Dashed or dotted arrows are feedbacks, strong (dashed) or weak/suggested (dotted). In correspondence with the numbers in the diagram: (i) faster development rate due to inductive conditions (high temperature, long photoperiod) shortens the time available for photosynthesis, photosynthate partitioning to the spike starts earlier but generally results in lower spike biomass (compared with low temperature, short photoperiod); (ii) higher biomass in the spike, e.g. by higher partitioning or C fixation in High WSC lines, contributes to a higher amount of glucose in the spike; (iii) higher sucrose production in High WSC lines at booting affects the amount of sucrose available for transport to the spike; (iv) the higher the biomass and glucose in the spike, e.g. in High WSC lines, the higher the number of fertile florets; (v) the faster the relative floret development rate before booting, the lower the proportion of fertile florets that transition to grains (grain set), e.g. Low WSC lines at high temperature and long photoperiod.
|
Discussion
Fertile florets and grain number per spike were affected differently by high temperature and longer photoperiod
Spike biomass at anthesis was a good predictor for grain number per spike in response to genotypic and environmental variables (Fischer 1984). The grain number per spike can be described as the product of the number of fertile florets multiplied by the grain set, i.e. the proportion of fertile florets that form a grain. Focusing on the interaction among genotype, temperature and photoperiod, while grain number per spike (both at the plant and main shoot level) was reduced by higher temperature and longer photoperiod, its precursor, the number of fertile florets per spike (observed at main shoot level) was not. Indeed, although floret production in the main shoot was 6% higher under 28/14°C (Fig. 2a), the corresponding spike weight was ~20% lower in comparison to 20/10°C (Fig. 1c). In other words, spikes from the higher temperature treatment had more fertile florets for a comparable spike weight.
The number of fertile florets per spike was associated primarily with spike biomass and, by extension, with the amount of spike glucose at booting. Spike biomass and glucose levels are not completely independent and can be described as the result of loosely coordinated processes with feedback (Tardieu et al. 2011) (Fig. 9). In the range of temperature explored, both biomass and glucose amount in the spike at booting were maintained at high temperature, within each WSC type. This response is different to that observed for long photoperiods in sensitive lines, where accelerated growth and sugar depletion are the suggested cause for autophagy (e.g. Ghiglione et al. 2008). However, it fits the description of a quantitative response to temperature with an optimum. It is possible that at temperatures beyond the tested range, homeostasis of sugars in the spike cannot be maintained and floret fertility declines.
Both floret and grain number per spike had a strong genotypic component. High WSC lines had higher spike biomass, fixed 13C and glucose amount at booting, florets and grains per spike across environments. In previous field experiments, not only differences in spike WSC content but also WSCc between High and Low WSC lines had been observed (Dreccer et al. 2009). High WSC lines also had a slower relative rate of floret development leading up to booting and a more advanced floret development score during stem elongation (52 DAE) under extended photoperiod and higher temperature even when external phenology in both WSC types was similar. Since major effects of VRN and PPD genes have been ruled out, this suggests that High WSC lines were able to advance floret development further than Low WSC lines, on top of the effect of environmental factors. This study was conducted with very well characterised but few contrasting recombinant inbred lines for the trait of interest, further work is needed to corroborate these findings on a larger number of genotypes.
Grain set decreased as a function of accelerated floral development between stem elongation and booting (Fig. 8c), with higher temperature and longer photoperiod. This suggests that florets diagnosed as completely developed and morphologically fertile lacked either the minimum size or metabolic capacity to transition into actively dividing grains compared with those from 20/10°C and 11 h. The process deserves to be explored further as results suggests that an event occurring post fertilisation, involving active cell division and volume gain, may be influenced by prior events, i.e. earlier than booting (when floret competency is being defined). Pollen was observed on fertile florets, but its germination capacity was not tested. Although it can’t be strictly ruled out from influencing grain set, reduced pollen viability was only expected beyond 34°C (KB Wockner, data not shown).
In this study, the corollary of genotypic and environmental action on floret fertility and grain set was reduced grain number per spike at higher temperature and longer photoperiod, but remaining higher in High WSC lines across environments. This highlights the potential of this phenotype to maintain grain number per spike in warmer climates.
Links between genotypic variation in floret fertility, sugar levels and C metabolism genes
The expression levels of a small number of genes involved in photosynthesis, sugar transport, fructan synthesis and sucrose hydrolysis were studied in different organs in High and Low WSC lines to investigate the effect of high temperatures on floret fertility. Collectively, these data suggest that, especially under low temperature conditions (20/10°C), High vs Low WSC lines produce more sucrose at booting via increased levels of TaRbcS which is available for hydrolysis for growth (increased levels of TaSAInv) or transport to storage or sink tissues (increased levels of TaSuT and Ta1-SST and lower or similar levels of TaSuSy and TaCWInv) (Koch 2004; Xue et al. 2013). This is consistent with the observed amounts of sugars and 13C assimilation at booting, in total and particularly by the main shoot spikes, probably contributing to the homeostasis mentioned before. In contrast, by anthesis, High WSC lines had no advantage in sucrose production (TaRbcS), as corroborated by lack of differences in photosynthesis rates, or sucrose transport. Interestingly, the capacity for sucrose degradation at anthesis differed between organs and between genes. It was lower in spike and peduncle of High WSC lines, but tended to be higher in their flag leaves and internodes (TaSuSy and TaCWInv); whereas TaSAInv tended to be higher in the spike and flag leaf at the lower temperature, but similar or lower at the higher temperature. This difference is consistent with the different roles played by the two invertases in growth and expansion or source–sink balance (Koch 2004), the relative levels of expression of mRNA of these genes previously observed in High and Low WSC lines (Xue et al. 2008) and may explain the observed levels of sucrose in the flag leaf and spike at anthesis, as discussed by Xue et al. (2013). At 28/14°C, the High WSC lines had the abovementioned generally lower (not always significant) levels of expression of sucrose hydrolysis and fructosyl transferases, which may have assisted in the movement of sucrose to the spike. Effectively, the genotypic avenue leading to higher growth, soluble sugars in reproductive organs and floret number seems to differ from previous models, where heightened invertase expression in ovaries are behind increased glucose levels and seed set (Boyer and McLaughlin 2007; Ruan et al. 2012). It should be noted that in addition to studying a small number of genes involved in sucrose production, transport and utilisation, this study has only assessed mRNA expression levels and not enzyme activity per se. Therefore, there may be alternative explanations for the patterns of gene expression and sugar levels including enzyme activity not regulated at the mRNA level, factors other than the levels of gene expression regulating the flux of metabolites such as sucrose or, that the control of sugar levels lies with different enzymes.
A role for simple sugars indirectly regulating lateral meristem progress (Long et al. 2006; Turnbull 2011) or participating in floret expansion (Vergauwen et al. 2000) has been discussed. Thus, early carbon availability per se influencing floret initiation and meristem expansion (Dosio et al. 2011) or contributing to the regulation of tissue turgor (Patrick et al. 1995; Vergauwen et al. 2000) could be a key genotypic component contributing to higher fertile floret number per spike in High WSC lines across environments.
Conclusions
This study highlighted the link between the success of wheat reproductive structures in response to temperature utilising genotypic variation in water soluble carbohydrate metabolism, going beyond the evidence obtained by shading/light addition (Stockman et al. 1983) and daylength manipulation and sucrose feeding (Ghiglione et al. 2008). The corollary of the differential spike biomass, lower relative floret development rate till booting, together with the coordination of sucrose production, transport and cleavage was a higher number of fertile florets per spike under higher temperature and longer photoperiod for the High WSC lines.
There are indications that when temperature and photoperiod are the main environmental variables (i) there may be differences in the factors controlling floral progression from primordia to fully fertile florets from those ensuring a fertile floret becomes a viable grain, and (ii) grain set seemed more related to floral development than C availability, deserving further investigation. Further, as the genotype by environment response of floret and grain number was quantitative and functional with respect to biomass, sugars and/or development rates at different stages (Fig. 9), it can be used in simulation models to predict possible outcomes for alternative allelic variation in future climates.
Acknowledgements
We are very thankful for the skilful and committed contributions of CSIRO staff Christianne Ludwig in the 13C labelling training, Donna Glassop in HPLC and Janneke Drenth in gene expression analysis, Laura Barnes and Mary-Anne Awasi on glasshouse related work. Ben Trevaskis conducted the VRN and PPD genotyping. This research was funded by and DM held a fellowship from the Climate Adaptation Flagship (Commonwealth Science and Industrial Research Organisation, Australia).
References
Bancal P (2008) Positive contribution of stem growth to grain number per spike in wheat. Field Crops Research 105, 27–39.| Positive contribution of stem growth to grain number per spike in wheat.Crossref | GoogleScholarGoogle Scholar |
Bancal P (2009) Early development and enlargement of wheat floret primordia suggest a role of partitioning within spike to grain set. Field Crops Research 110, 44–53.
| Early development and enlargement of wheat floret primordia suggest a role of partitioning within spike to grain set.Crossref | GoogleScholarGoogle Scholar |
Bonnett GD, Salter B, Albertson PL (2001) Biology of suckers: late-formed shoots in sugarcane. Annals of Applied Biology 138, 17–26.
| Biology of suckers: late-formed shoots in sugarcane.Crossref | GoogleScholarGoogle Scholar |
Boyer JS, McLaughlin JE (2007) Functional reversion to identify controlling genes in multigenic responses: analysis of floral abortion. Journal of Experimental Botany 58, 267–277.
| Functional reversion to identify controlling genes in multigenic responses: analysis of floral abortion.Crossref | GoogleScholarGoogle Scholar | 1:CAS:528:DC%2BD2sXhtlOlt7o%3D&md5=3150d4ffaa7999780f9d15191f5fa0d2CAS | 17105969PubMed |
Cochran WG, Cox GM (1992) ‘Experimental designs.’ (John Wiley & Sons: New York)
Dosio GAA, Tardieu F, Turc O (2011) Floret initiation, tissue expansion and carbon availability at the meristem of the sunflower capitulum as affected by water or light deficits. New Phytologist 189, 94–105.
| Floret initiation, tissue expansion and carbon availability at the meristem of the sunflower capitulum as affected by water or light deficits.Crossref | GoogleScholarGoogle Scholar | 1:CAS:528:DC%2BC3MXltlGgsg%3D%3D&md5=dbcda4a8ee24a41cade6256e9371f3c6CAS |
Dougherty CT, Rooney KR, Scott WR, Langer RHM (1975) Levels of water soluble carbohydrate in pre-anthesis ear of wheat, and grain set per spikelet. New Zealand Journal of Agricultural Research 18, 351–356.
| Levels of water soluble carbohydrate in pre-anthesis ear of wheat, and grain set per spikelet.Crossref | GoogleScholarGoogle Scholar |
Dreccer MF, van Herwaarden AF, Chapman SC (2009) Grain number and grain weight in wheat lines contrasting for stem water soluble carbohydrate concentration. Field Crops Research 112, 43–54.
| Grain number and grain weight in wheat lines contrasting for stem water soluble carbohydrate concentration.Crossref | GoogleScholarGoogle Scholar |
Dreccer MF, Bonnett D, Lafarge T (2012) Plant breeding under a changing climate. In ‘Encyclopedia of sustainability science and technology. Vol. 11’. (Ed. RA Meyers) pp. 8013–8024. (Springer-Verlag: Berlin)
Dreccer MF, Chapman SC, Rattey AR, Neal J, Song Y, Christopher JT, Reynolds M (2013) Developmental and growth controls of tillering and water-soluble carbohydrate accumulation in contrasting wheat (Triticum aestivum L.) genotypes: can we dissect them? Journal of Experimental Botany 64, 143–160.
| Developmental and growth controls of tillering and water-soluble carbohydrate accumulation in contrasting wheat (Triticum aestivum L.) genotypes: can we dissect them?Crossref | GoogleScholarGoogle Scholar | 1:CAS:528:DC%2BC38XhvV2gsbvO&md5=8fbcab4526181ce554a62e0ae3ca888cCAS | 23213136PubMed |
Fischer RA (1984) Growth and yield of wheat. In ‘Potential productivity of field crops under different environments’. pp. 129–154. (International Rice Research Institute: Los Baños, Philippines)
Fischer RA (1985) Number of kernels in wheat crops and the influence of solar radiation and temperature. Journal of Agricultural Science 105, 447–461.
| Number of kernels in wheat crops and the influence of solar radiation and temperature.Crossref | GoogleScholarGoogle Scholar |
Fischer RAT, Edmeades GO (2010) Breeding and cereal yield progress. Crop Science 50, S85–S98.
| Breeding and cereal yield progress.Crossref | GoogleScholarGoogle Scholar |
Fischer RA, Stockman YM (1980) Kernel number per spike in wheat (Triticum eastivum L) – responses to pre-anthesis shading. Australian Journal of Plant Physiology 7, 169–180.
| Kernel number per spike in wheat (Triticum eastivum L) – responses to pre-anthesis shading.Crossref | GoogleScholarGoogle Scholar | 1:CAS:528:DyaL3cXktVCjs7s%3D&md5=87aeef2f7d0488b7086fad541dda66afCAS |
Ghiglione HO, Gonzalez FG, Serrago R, Maldonado SB, Chilcott C, Cura JA, Miralles DJ, Zhu T, Casal JJ (2008) Autophagy regulated by day length determines the number of fertile florets in wheat. The Plant Journal 55, 1010–1024.
| Autophagy regulated by day length determines the number of fertile florets in wheat.Crossref | GoogleScholarGoogle Scholar | 1:CAS:528:DC%2BD1cXht1Srs77J&md5=47924fbda31d0185cf19eb756ed52584CAS | 18547393PubMed |
González FG, Slafer GA, Miralles DJ (2005) Photoperiod during stem elongation in wheat: is its impact on fertile floret and grain number determination similar to that of radiation? Functional Plant Biology 32, 181–188.
| Photoperiod during stem elongation in wheat: is its impact on fertile floret and grain number determination similar to that of radiation?Crossref | GoogleScholarGoogle Scholar |
Gonzalez FG, Miralles DJ, Slafer GA (2011) Wheat floret survival as related to pre-anthesis spike growth. Journal of Experimental Botany 62, 4889–4901.
| Wheat floret survival as related to pre-anthesis spike growth.Crossref | GoogleScholarGoogle Scholar | 1:CAS:528:DC%2BC3MXhtlejsrbL&md5=2cdec470ed6967314e6fc9ef7711b82eCAS | 21705386PubMed |
Haun JR (1973) Visual Quantification of Wheat Development. Agronomy Journal 65, 116–119.
| Visual Quantification of Wheat Development.Crossref | GoogleScholarGoogle Scholar |
IPCC (2007) ‘Climate Change 2007: impacts, adaptation, and vulnerability. Contribution of Working Group II to the Fourth Assessment Report of the Intergovernmental Panel on Climate Change.’ (Cambridge University Press: Cambridge, UK)
Ji XM, Shiran B, Wan JL, Lewis DC, Jenkins CLD, Condon AG, Richards RA, Dolferus R (2010) Importance of pre-anthesis anther sink strength for maintenance of grain number during reproductive stage water stress in wheat. Plant, Cell & Environment 33, 926–942.
| Importance of pre-anthesis anther sink strength for maintenance of grain number during reproductive stage water stress in wheat.Crossref | GoogleScholarGoogle Scholar | 1:CAS:528:DC%2BC3cXnvVagsb4%3D&md5=9db4045e0ab055f4927239638fbc76eaCAS |
Kirby EJM (1974) Ear development in spring wheat. Journal of Agricultural Science 82, 437–447.
| Ear development in spring wheat.Crossref | GoogleScholarGoogle Scholar |
Koch K (2004) Sucrose metabolism: regulatory mechanisms and pivotal roles in sugar sensing and plant development. Current Opinion in Plant Biology 7, 235–246.
| Sucrose metabolism: regulatory mechanisms and pivotal roles in sugar sensing and plant development.Crossref | GoogleScholarGoogle Scholar | 1:CAS:528:DC%2BD2cXjvVams7s%3D&md5=6be1b89985c16720b0fbc20130ef947aCAS | 15134743PubMed |
Long SP, Ainsworth EA, Leakey ADB, Nosberger J, Ort DR (2006) Food for thought: lower-than-expected crop yield stimulation with rising CO2 concentrations. Science 312, 1918–1921.
| Food for thought: lower-than-expected crop yield stimulation with rising CO2 concentrations.Crossref | GoogleScholarGoogle Scholar | 1:CAS:528:DC%2BD28XmsVagsr4%3D&md5=270b6cf51453b6d878a71d1d6281963fCAS | 16809532PubMed |
Mathews KL, Malosetti M, Chapman S, McIntyre L, Reynolds M, Shorter R, van Eeuwijk F (2008) Multi-environment QTL mixed models for drought stress adaptation in wheat. TAG Theoretical and Applied Genetics 117, 1077–1091.
| Multi-environment QTL mixed models for drought stress adaptation in wheat.Crossref | GoogleScholarGoogle Scholar |
McIntyre CL, Mathews KL, Rattey A, Chapman SC, Drenth J, Ghaderi M, Reynolds M, Shorter R (2010) Molecular detection of genomic regions associated with grain yield and yield-related components in an elite bread wheat cross evaluated under irrigated and rainfed conditions. Theoretical and Applied Genetics 120, 527–541.
| Molecular detection of genomic regions associated with grain yield and yield-related components in an elite bread wheat cross evaluated under irrigated and rainfed conditions.Crossref | GoogleScholarGoogle Scholar | 1:CAS:528:DC%2BC3cXotV2iug%3D%3D&md5=e53328b62da8cb84410faf60bdf3b87fCAS | 19865806PubMed |
Miralles DJ, Richards RA, Slafer GA (2000) Duration of the stem elongation period influences the number of fertile florets in wheat and barley. Australian Journal of Plant Physiology 27, 931–940.
Olivares-Villegas JJ, Reynolds MP, McDonald GK (2007) Drought-adaptive attributes in the Seri/Babax hexaploid wheat population. Functional Plant Biology 34, 189–203.
| Drought-adaptive attributes in the Seri/Babax hexaploid wheat population.Crossref | GoogleScholarGoogle Scholar |
Palta JA (2001) Source/sink interactions in crop plants: application of 13CO2 and urea-15N techniques in the quantitative analysis. In ‘Stable isotope techniques in the study of biological processes and functioning of ecosystems’: M. Unkovich, AM McNeill, DJ Gibbs) pp. 145–165. (Kluwer Academic Publishers: Dordrecht, The Netherlands)
Palta JA, Gregory PJ (1997) Drought affects the fluxes of carbon to roots and soil in C-13 pulse-labelled plants of wheat. Soil Biology & Biochemistry 29, 1395–1403.
| Drought affects the fluxes of carbon to roots and soil in C-13 pulse-labelled plants of wheat.Crossref | GoogleScholarGoogle Scholar | 1:CAS:528:DyaK2sXmtVCgt7k%3D&md5=f3643edcc081902e4ca10db0c525735aCAS |
Palta JA, Kobata T, Turner NC, Fillery IR (1994) Remobilisation of carbon and nitrogen in wheat as influence by post-anthesis water deficits. Crop Science 34, 118–124.
| Remobilisation of carbon and nitrogen in wheat as influence by post-anthesis water deficits.Crossref | GoogleScholarGoogle Scholar |
Patrick JW, Offler CE, Wang XD (1995) Cellular pathway of photosynthate transport in coats of developing seed of Vicia faba L. and Phaseolus vulgaris L. 1. Extent of transport through the coat symplast. Journal of Experimental Botany 46, 35–47.
| Cellular pathway of photosynthate transport in coats of developing seed of Vicia faba L. and Phaseolus vulgaris L. 1. Extent of transport through the coat symplast.Crossref | GoogleScholarGoogle Scholar | 1:CAS:528:DyaK2MXjslKiu74%3D&md5=6369d78c8ab5ec8e5bd9f137df6a936eCAS |
Rattey A, Shorter R, Chapman S, Dreccer F, van Herwaarden A (2009) Variation for and relationships among biomass and grain yield component traits conferring improved yield and grain weight in an elite wheat population grown in variable yield environments. Crop and Pasture Science 60, 717–729.
| Variation for and relationships among biomass and grain yield component traits conferring improved yield and grain weight in an elite wheat population grown in variable yield environments.Crossref | GoogleScholarGoogle Scholar |
Rebetzke GJ, van Herwaarden AF, Jenkins C, Weiss M, Lewis D, Ruuska S, Tabe L, Fettell NA, Richards RA (2008) Quantitative trait loci for water-soluble carbohydrates and associations with agronomic traits in wheat. Australian Journal of Agricultural Research 59, 891–905.
| Quantitative trait loci for water-soluble carbohydrates and associations with agronomic traits in wheat.Crossref | GoogleScholarGoogle Scholar | 1:CAS:528:DC%2BD1cXhtFaisrfE&md5=722c2406b2447aa8daa15aff0e5844acCAS |
Reynolds M, Foulkes MJ, Slafer GA, Berry P, Parry MAJ, Snape JW, Angus WJ (2008) ‘Raising yield potential in wheat.’ (Oxford University Press: Nottingham, England)
Rosenzweig C (2012) Climate change and agriculture. In ‘Encyclopedia of complexity and systems science’. (Ed. RA Meyers) (Springer-Verlag: Berlin)
Ruan Y-L, Patrick JW, Bouzayen M, Osorio S, Fernie AR (2012) Molecular regulation of seed and fruit set. Trends in Plant Science 17, 656–665.
| Molecular regulation of seed and fruit set.Crossref | GoogleScholarGoogle Scholar | 1:CAS:528:DC%2BC38XpvFGmt74%3D&md5=3f8b68aa27de1bc7cacbea45c6ddfb6dCAS | 22776090PubMed |
Shaw LM, McIntyre CL, Gresshoff PM, Xue GP (2009) Members of the Dof transcription factor family in Triticum aestivum are associated with light-mediated gene regulation. Functional & Integrative Genomics 9, 485–498.
| Members of the Dof transcription factor family in Triticum aestivum are associated with light-mediated gene regulation.Crossref | GoogleScholarGoogle Scholar | 1:CAS:528:DC%2BD1MXht1CmtrzJ&md5=1a6135ceb5e1232aac220f0e2ba64d20CAS |
Stockman YM, Fischer RA, Brittain EG (1983) Assimilate supply and floret development within the spike of wheat (Triticum aestivum L.). Australian Journal of Plant Physiology 10, 585–594.
| Assimilate supply and floret development within the spike of wheat (Triticum aestivum L.).Crossref | GoogleScholarGoogle Scholar |
Tardieu F, Granier C, Muller B (2011) Water deficit and growth. Co-ordinating processes without an orchestrator? Current Opinion in Plant Biology 14, 283–289.
| Water deficit and growth. Co-ordinating processes without an orchestrator?Crossref | GoogleScholarGoogle Scholar | 21388861PubMed |
Turnbull C (2011) Long-distance regulation of flowering time. Journal of Experimental Botany 62, 4399–4413.
| Long-distance regulation of flowering time.Crossref | GoogleScholarGoogle Scholar | 1:CAS:528:DC%2BC3MXhtFKisbrE&md5=f5273b7ab317f8b54ea5ee905b5083e4CAS | 21778182PubMed |
van Herwaarden AF, Angus JF, Richards RA, Farquhar GD (1998) ‘Haying-off’, the negative grain yield response of dryland wheat to nitrogen fertiliser – II. Carbohydrate and protein dynamics. Australian Journal of Agricultural Research 49, 1083–1093.
| ‘Haying-off’, the negative grain yield response of dryland wheat to nitrogen fertiliser – II. Carbohydrate and protein dynamics.Crossref | GoogleScholarGoogle Scholar |
Vergauwen R, Van den Ende W, Van Laere A (2000) The role of fructan in flowering of Campanula rapunculoides. Journal of Experimental Botany 51, 1261–1266.
| The role of fructan in flowering of Campanula rapunculoides.Crossref | GoogleScholarGoogle Scholar | 1:CAS:528:DC%2BD3cXlsVyjtb4%3D&md5=e14f2e99071cf9057c1672b9ac0671dfCAS | 10937702PubMed |
Waddington SR, Cartwright PM, Wall PC (1983) A quantitative scale of spike initial and pistil development in barley and wheat. Annals of Botany 51, 119–130.
Xue G, McIntyre CL, Jenkins CLD, Glassop D, van Herwaarden AF, Shorter R (2008) Molecular dissection of variation in carbohydrate metabolism related to water-soluble carbohydrate accumulation in stems of wheat. Plant Physiology 146, 441–454.
| Molecular dissection of variation in carbohydrate metabolism related to water-soluble carbohydrate accumulation in stems of wheat.Crossref | GoogleScholarGoogle Scholar | 1:CAS:528:DC%2BD1cXjtFCmtrc%3D&md5=523cb106506fddedd28f90d1578b46d7CAS | 18083795PubMed |
Xue GP, Drenth J, Glassop D, Kooiker M, McIntyre CL (2013) Dissecting the molecular basis of the contribution of source strength to high fructan accumulation in wheat. Plant Molecular Biology 81, 71–92.
| Dissecting the molecular basis of the contribution of source strength to high fructan accumulation in wheat.Crossref | GoogleScholarGoogle Scholar | 1:CAS:528:DC%2BC38XhvV2ks7vM&md5=fbb6b2802c420a9ebf367da59cd9572fCAS | 23114999PubMed |
Yemm EW, Willis AJ (1954) The estimation of carbohydrates in plant extracts by anthrone. Biochemical Journal 57, 508–514.
Zadoks JC, Chang TT, Konzak CF (1974) Decimal code for growth stages of cereals. Weed Research 14, 415–421.
| Decimal code for growth stages of cereals.Crossref | GoogleScholarGoogle Scholar |
Zheng BY, Chenu K, Dreccer MF, Chapman SC (2012) Breeding for the future: what are the potential impacts of future frost and heat events on sowing and flowering time requirements for Australian bread wheat (Triticum aestivium) varieties? Global Change Biology 18, 2899–2914.
| Breeding for the future: what are the potential impacts of future frost and heat events on sowing and flowering time requirements for Australian bread wheat (Triticum aestivium) varieties?Crossref | GoogleScholarGoogle Scholar |


