

Measuring residual transpiration in plants: a comparative analysis of different methods
Md. Hasanuzzaman A B , Koushik Chakraborty A C , Meixue Zhou A and Sergey Shabala A D E *
A
B
C
D
E
Abstract
Residual transpiration (RT) is defined as a loss of water through the leaf cuticle while stomata are closed. Reduced RT might be a potentially valuable trait for improving plant performance under water deficit conditions imposed by either drought or salinity. Due to the presence of stomata on the leaf surface, it is technically challenging to measure RT. RT has been estimated by the water loss through either astomatous leaf surface or isolated astomatous cuticular layers. This approach is not suitable for all species (e.g. not applicable to grasses) and is difficult and too time consuming for large-scale screening in breeding programs. Several alternative methods may be used to quantify the extent of RT; each of them comes with its own advantages and limitations. In this study, we have undertaken a comparative assessment of eight various methods of assessing RT, using barley (Hordeum vulgare) plants as a model species. RT measured by water retention curves and a portable gas exchange (infrared gas analyser; IRGA) system had low resolution and were not able to differentiate between RT rates from young and old leaves. Methods based on quantification of the water loss at several time-points were found to be the easiest and least time-consuming compared to others. Of these, the ‘three time-points water loss’ method is deemed as the most suitable for the high throughput screening of plant germplasm for RT traits.
Keywords: barley, climate change, cuticle, drought, phenotyping, salinity, stomata, transpiration.
Introduction
Under favourable environmental conditions, plants typically lose between 94 and 99% of absorbed water from the leaf surface through stomatal pores in a process termed stomatal transpiration (ST) (Körner 1994). Under stress conditions, this fraction is reduced, and a water loss through the leaf cuticle may account for ~2–30% of total transpiration, ranging from 10−7 to 10−4 m s−1, depending upon the species and environmental conditions (Kerstiens 1996; Boyer et al. 1997; Riederer and Schreiber 2001). When water deficit is increased enough to induce complete stomatal closure, to minimise water loss and avoid drought stress, water loss through the leaf surface to atmosphere is mediated mostly by the cuticle. Under such conditions, cuticular transpiration may comprise up to 50% of total transpiration during the daytime (David 2010). Thus, the fitness and survival capacity of plants under these conditions will depend on their ability to restrict water loss through the leaf cuticle. Also, in most species, stomata are closed under dark conditions, so cuticular water loss during the night can be substantially higher than the ST at night. It was also reported that some water can escape from the leaf via stomata even when they are fully closed (McAdam and Brodribb 2014). Because of this, the water loss through the cuticle at minimal stomatal aperture under dark conditions is not always technically correct to be termed ‘cuticular transpiration’ and is best described as a ‘residual transpiration’ (RT). When stomata are closed and ST is reduced to nearly zero under severe water stress conditions, reducing RT could be a potentially useful mechanism for improving plant performance by conserving water. Thus, genotypes having lower RT can conserve higher relative water content under water limiting conditions (Hasanuzzaman et al. 2018). In light of the above, RT has been suggested as a selection criterion in cereal breeding programs focused on dry environments (Clarke et al. 1991; Petcu 2005). However, phenotyping the stress tolerant germplasm and developing better stress adapted genotypes requires high throughput screening protocols for efficient measurement of RT to screen a large number of genotypes/accessions in a reliable and reproducible manner.
Measurement of RT is technically challenging due to the presence of adaxial or abaxial stomata on a leaf surface; stomata can contribute to the apparent cuticular transpiration due to imperfect closure (Burghardt and Riederer 2003; Boyer 2015). To investigate cuticular transpiration barrier properties, several methods have been developed during the past half century. A transpiration chamber measurement method was developed which allows a better control of environmental conditions; hence, improved reproducibility (Schönherr and Lendzian 1981; Schönherr 1982; Schreiber and Riederer 1996; Karbulková et al. 2008). However, this method can only be applied with enzymatically isolated astomatous cuticular membranes and thus the results may not reflect the cuticular transpiration property in planta. In addition, it is nearly impossible to find an astomatous leaf surface, particularly in cereals; also, the enzymatic isolation of cuticular membranes is not always possible for every plant species. In addition, the cuticle will most likely be dehydrated and undergo structural changes during an isolation process which could affect the cuticular transpiration. To overcome this limitation, an alternative method was proposed to measure cuticular transpiration by using the astomatous surface of leaf discs, where interference from stomata can be completely excluded (Hoad et al. 1996; Schreiber 2001; Burghardt and Riederer 2003; Karbulková et al. 2008). But the limitation with this method is the rare availability of plant species with an astomatous leaf surface, particularly in the monocots where stomata are distributed approximately evenly between both surfaces. Another alternative approach for estimating RT is to measure the water loss from the detached leaves of an amphistomatous plant under dark conditions by using a gravimetric method (Xu et al. 1995; Cape and Percy 1996). Here, the detached leaves are allowed to dry under dark conditions and the loss in fresh biomass is measured over time by sensitive balances. Some other detection techniques have also been developed to measure RT (Schönherr and Lendzian 1981; Schreiber 2001) but they are little used and thus not properly reviewed.
Each of above methods has some advantages and disadvantages over the other and, to the best of our knowledge, no study has provided a comparative assessment of all of these methods. This gap in the knowledge was filled in this work, aiming to find the most suitable method for large-scale measurement of RT for plant breeding programs. In addition, it has been stated that the effectiveness of controlling water loss depends on the leaf age (Jordan and Brodribb 2007). Therefore, we hypothesised that a significant difference in RT should exist between leaves of different positions (young and old leaves).
Materials and methods
Plant materials and growth conditions
Barley (Hordeum vulgare L. cv. Gairdner) plants were used in experiments. Seeds were obtained from the Australian Winter Cereal Collection and multiplied in the field at the Tasmanian Institute of Agriculture (TIA) facilities in Launceston, Australia. Seeds were surface sterilised with 10% commercial bleach, thoroughly rinsed with tap water, and sown in 2-L plastic pots using a standard potting mixture containing 70% composted pine bark, 20% coarse sand, 10% sphagnum peat, Limil at 1.8 kg m−3 and dolomite at 1.8 kg m−3. The plant nutrient balance was maintained by adding slow release Osmocote Plus™ fertiliser (at 6 kg m−3) and ferrous sulfate (at 500 g m−3). Plants were grown under controlled glasshouse conditions (day length 14 h; day/night temperatures 25/15°C; relative humidity (RH) 65%) at the University of Tasmania (Hobart, Australia) in 2015. Plants were automatically irrigated twice per day. The experiment was conducted in a complete randomised design (CRD), with five replications for each method. Plants were grown up to the five leaves stage. Three fully expanded leaves from each replication at two different positions (e.g. old and young leaves, leaves 1 and 4 on the main tiller numbering from the base of the plant) were then selected in each sampling. The procedures for measuring RT by different methods are described as follows:
Barley leaves were excised from the plant and placed into a Petri dish filled with distilled water and allowed to rehydrate for 3 h in the dark at 20°C. The leaves were submerged under water in a container covered with transparent plastic wrap. The water-submerged leaves were exposed to light (120 μmol m−2 s−1) in a growth room at 20°C and 100% RH for 30 min to promote stomatal opening. The leaves were then blot dried with a soft paper towel and the cut end of the leaves were sealed with silicone grease and weighed immediately to obtain the turgid weight (TW). The leaves were then left on a bench inside the room at 20°C with 50% RH and light intensity similar to the compensation point of photosynthesis (~20 μmol m−2 s−1), to prevent net CO2 assimilation. The rate of water loss was measured by weighing leaves on an electronic balance at 10 min intervals over 2 h periods, to obtain the fresh weight (FW) at different time points. After recording the last weight, the leaves were dried in an oven at 60°C for 48 h to obtain the dry weight (DW). The obtained data were used to calculate the relative water content (RWC) at each point by the following equation:
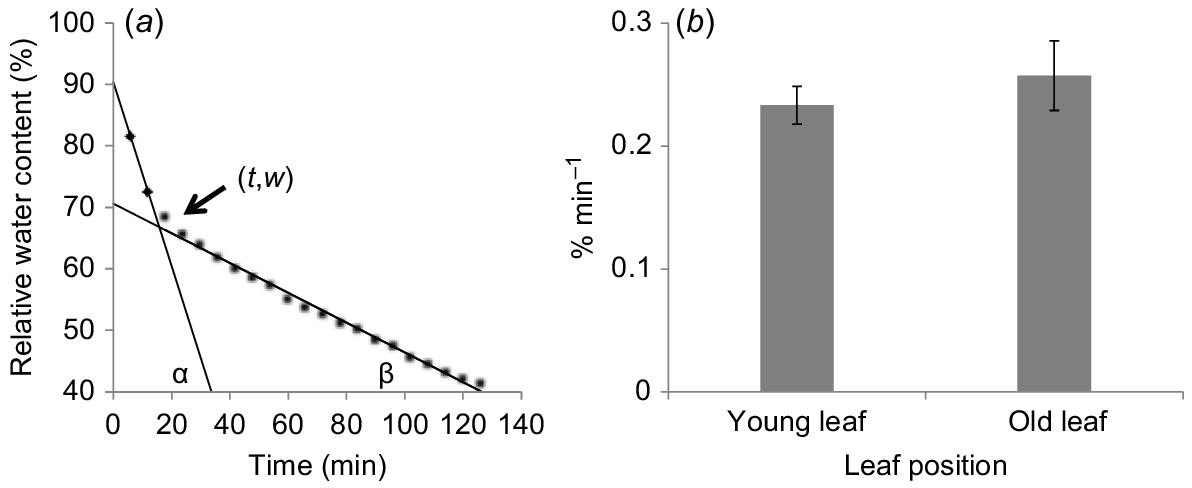
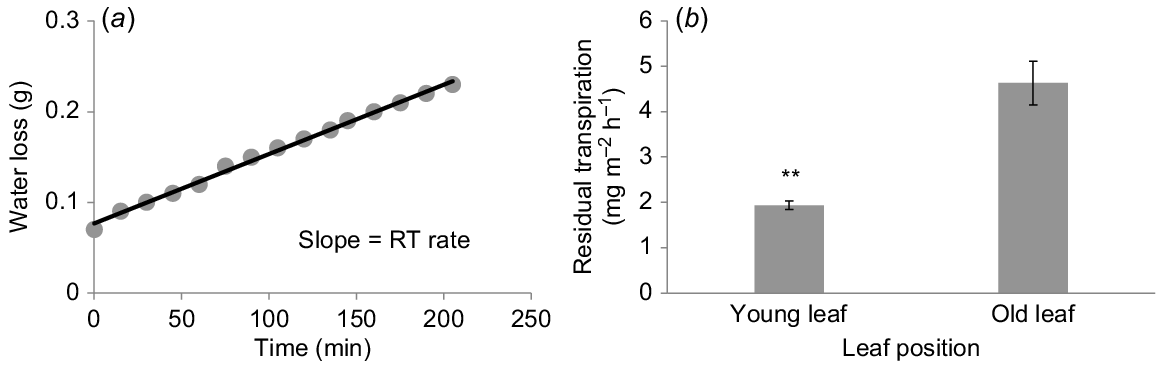
The relative water content was then plotted versus time,and the calculated slope at each time point through the linear regression analysis was defined as the transpirational water loss through the cuticle (Fig. 1a). According to Fig. 1a, the transpiration decline curve had two phases, the initial steep part and the gently sloped part. The slopes of these two phases show the declining rate of transpiration. Tangent lines of these two phases each cross with the x-axis, making angles α and β, respectively. The slope of the initial phase shown by tan α is defined as the water loss rate by ST. The slope by tan β is defined as the water loss rate by RT. The two tangent lines intersect at one point (t,w) that is defined as the mean stomatal closure point. The values of t show the time required for the stomata to close completely, and w shows the leaf relative water content at which the stomata close. ST and RT rates were calculated using the following equation: ST + RT = tanα and RT = tanβ.
(a) A typical example of a leaf water retention curve of detached barley leaves grown under control conditions. The point (t, w) is the stomatal closing point. The value of t and w show the period stomata remained open or partially open and closed, respectively. ST + RT = tan α; RT = tan β. (b) RT of barley at two different leaf positions grown under control conditions. Data are presented as mean ± s.e. (n = 5) and columns marked with no asterisks indicate non-significant differences for a two-tailed independent t-test at P > 0.05 level.
In the second method, RT was measured with a portable photosynthesis system (LI-6400XT, LI-COR) at night-time in the darkness.
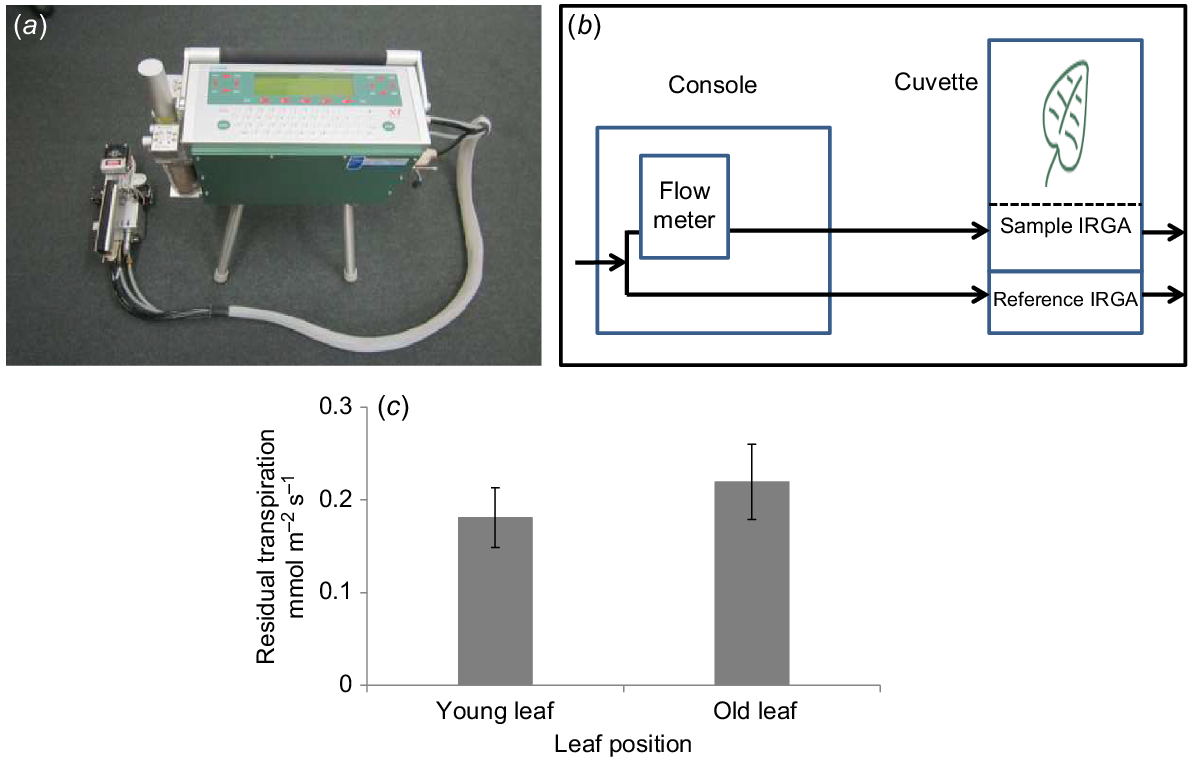
A standard IRGA leaf chamber (3 cm × 2 cm) was used (Fig. 2). The air temperature in the chamber was set to 20°C, the flow rate of air was set to 200 μmol s−1 and CO2 was supplied at 400 μmol mol−1. The chamber’s fan speed was set to high as a default. The chamber’s RH was manually manipulated to a target of 40–50% during measurement by adjusting the H2O scrub. Before measurement, the leaks of the sensor head were checked by adjusting the sensor head lid. Sample and reference infrared gas analysers (IRGAs) were matched after every two leaf measurements and then the empty chamber values were determined to monitor instrumental error. Plant measurements were logged when readings became stable (typically, within 1–2 min of clamping the leaf). Green safety headlamps with an intensity below the detection of a LI-6400XT external PAR sensor were used to avoid stomatal opening. The RT was calculated as
where F = air flow rate (μmol s−1), Ws and Wr = sample and reference water mole fractions (mmol H2O (mol air)−1) and S = leaf area (cm2).
(a) Infra red gas analyser (LI 6400XT). (b) Transpiration measurement principle (Method 2): computed from the differences in H2O between in-chamber conditions and pre-chamber conditions (picture redrawn). (c) RT of barley at two different leaf positions grown under control conditions. Data are presented as mean ± s.e. (n = 5) and columns marked with no asterisks indicate non-significant differences for a two-tailed independent t-test at P > 0.05 level.
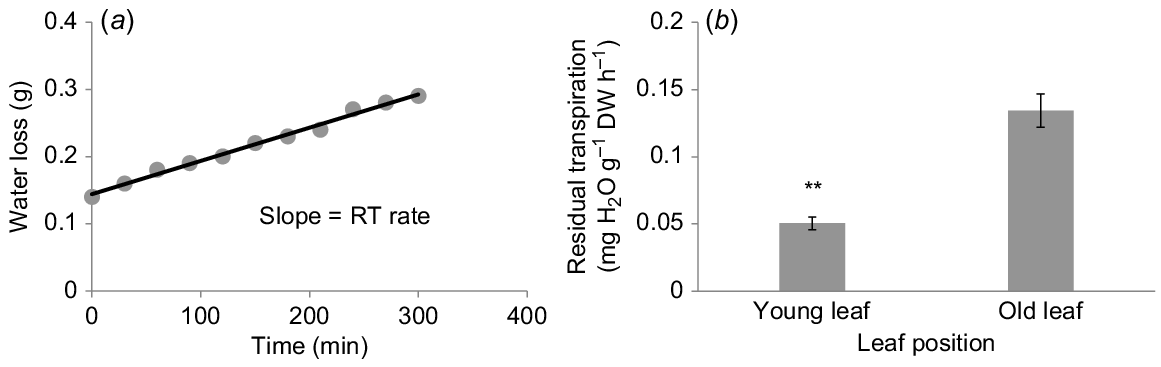
Here, RT was determined following the method of McCaig and Romagosa (1989), with some modifications. The cut surface of collected leaves was sealed with silicone grease and taken rapidly to the laboratory. The leaves were placed on previously weighed aluminium trays for fresh weight determination, immediately after sampling. The leaves were then allowed to wilt in a dark room at 20°C and 50% RH. Two hours later (when the stomata were closed) the leaves were weighed again; subsequently, the leaf weight was recorded every 30 min for up to 6 h to follow the loss of water pattern. After that, the leaves were put into an oven at 60°C for 48 h for a dry weight. RT was obtained from the slope of the linear phase of water loss versus time (Fig. 3a). The measured RT was then calculated and expressed as mg H2O g−1 dry weight h−1.
(a) A typical example of linear water loss curve under dark conditions as a method to measure RT (Method 3). (b) RT of barley at two different leaf positions grown under control conditions. RT was calculated from the slope of the curve. Data are presented as mean ± s.e. (n = 5) and columns marked with asterisks indicate significant differences for a two-tailed independent t-test at P < 0.01 level.
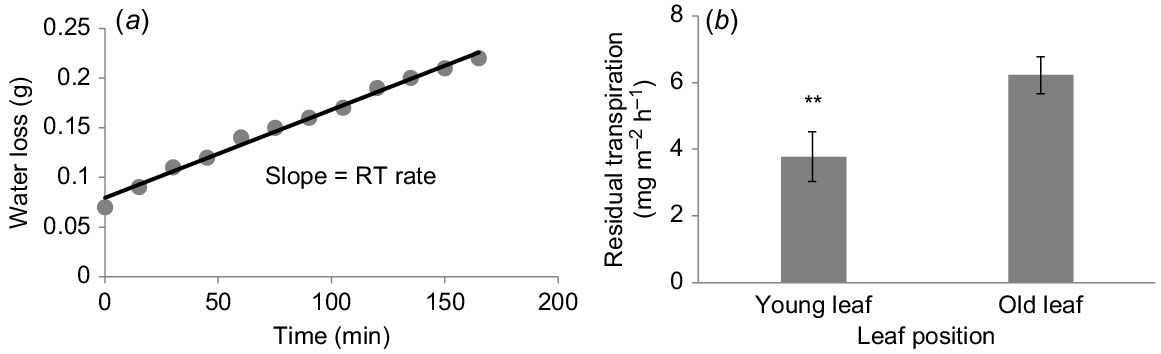
In this method, RT was determined following the method of Rawson and Clarke (1988), with some modifications. The collection and preparation of leaf samples were done as above in Method 3. Two hours later the leaves were weighed at 15 min intervals for 6 h to measure the water loss. After the initial rapid loss of water under dark conditions the stomata closed and the linear relationship of water loss versus time was used to estimate RT (Fig. 4a). The slope of the linear regression is the flow rate of RT. The RT was then calculated per projected leaf area and expressed as mg H2O m−2 h−1.
(a) A typical example of linear water loss curve under dark conditions used as a sample to measure RT (Method 4). (b) RT of barley at two different leaf positions grown under control conditions. The slope is the flow of water loss of RT. Data are presented as mean ± s.e. (n = 5) and columns marked with asterisks indicate significant differences for a two-tailed independent t-test at P < 0.01 level.
RT was determined following the method of Cape and Percy (1996), with some modifications. Leaves were excised from the plant at 19.00 h at night. The leaves were submerged under distilled water int a Petri dish covered with a lid and left in a dark-controlled room at 20°C overnight for a complete hydration. In the morning, samples were transferred to pre-weighed aluminium foil dishes and weighed after blotting with a paper towel to determine the saturated fresh weight. The leaf area was measured by a leaf scanner. Leaves were then allowed to wilt in a dark-controlled room at 20°C and 50% RH. Leaves were then weighed by electronic balance every 15 min over the next 4 h. The RT rate was measured from the slope by plotting the water loss with time for each sample (Fig. 5a). RT was calculated per projected leaf area and expressed as mg H2O m−2 h−1.
(a) A typical example of linear water loss under dark conditions of leaf used as a sample to measure RT (Method 5). (b) RT of barley at two different leaf positions grown under control conditions. RT was calculated from the slope of the curve. Data are presented as mean ± s.e. (n = 5) and columns marked with asterisks indicate significant differences for a two-tailed independent t-test at P < 0.05 level.
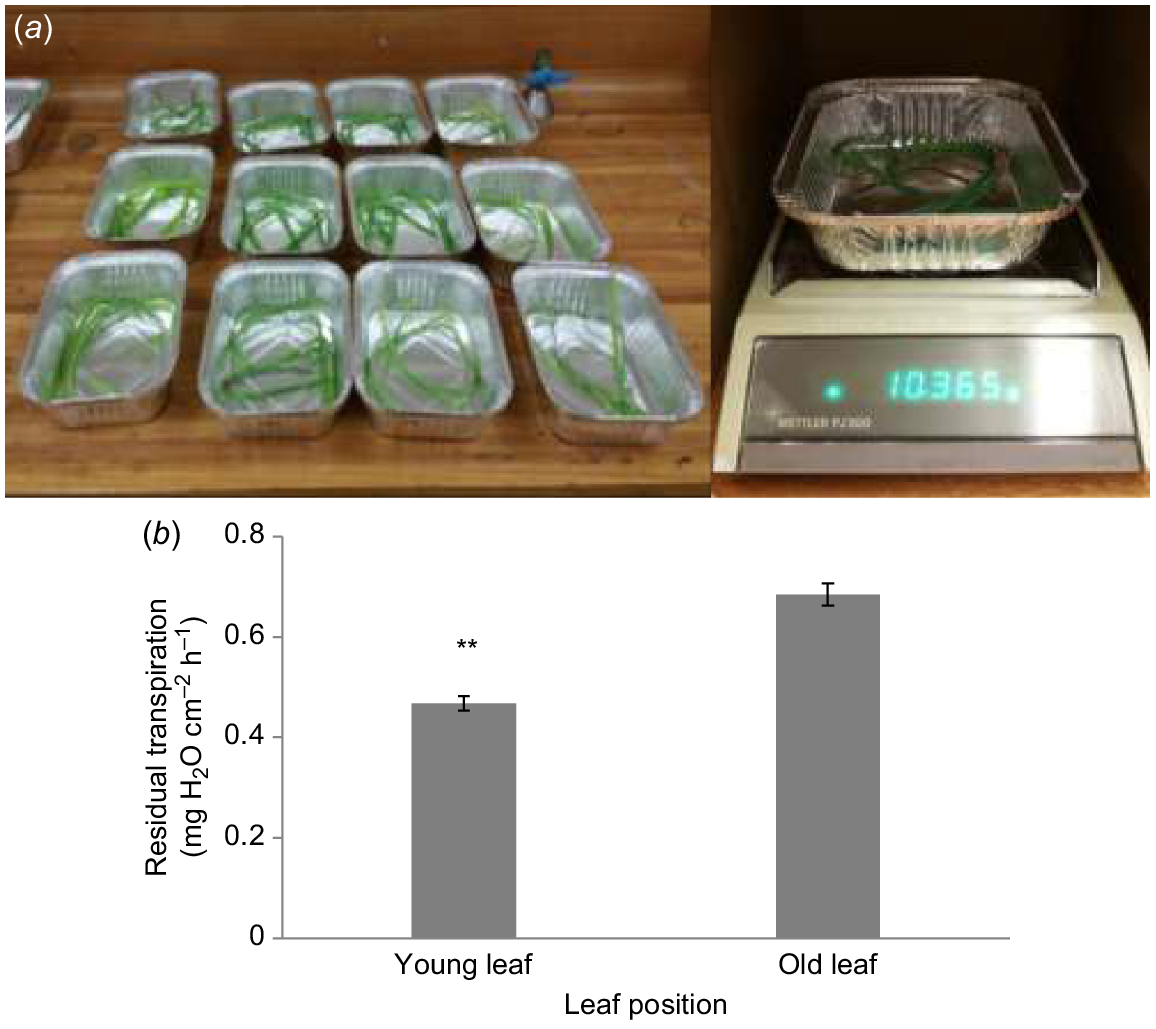
Leaves were excised and immediately sealed with silicone grease on the cut end. Leaves were then placed in a controlled dark room at 20°C and 50% RH (Fig. 6a). Leaves were weighed 5 and 24 h (W5 h and W24 h, respectively) later and then placed in a drying oven at 60°C for 48 h and re-weighed (Wd). The rate of RT was estimated by using the following formula:
where W5 h = weight after 5 h wilting at 20°C in the dark, W24 h = weight after 24 h wilting at 20°C in the dark, and Wd = dry weight at 60°C for 48 h.
(a) A typical example of a weighting system using an electronic balance to determine water loss from leaves used as a sample to measure RT. (b) RT of barley at two different leaf positions grown under control conditions by ‘two time-points water loss’ method (Method 6). Data are presented as mean ± s.e. (n = 5) and columns marked with asterisks indicate significant differences for a two-tailed independent t-test at P < 0.01 level.
The measured RT was then calculated as per projected leaf area and expressed in mg H2O cm−2 h−1.
Leaves were excised and immediately sealed with silicone grease at the cut end. Collected leaves were transported to a dark room. The initial weight of the leaves was determined immediately after sampling. The leaves were kept in the dark for stomatal closure under ambient room conditions at 20°C with 50% RH (Fig. 6a). The same leaves were re-weighed again after 24 h. Finally, the dry weight of the leaves was recorded after drying them at 60°C for 48 h. RT was determined by using the following formula:
where Wi = initial fresh weight, W24 = fresh weight after 24 h, and Wd = dry weight.
The measured RT was then calculated as per projected leaf area and expressed in mg H2O cm−2.
Excised and sealed (see above) leaves were weighed (W0) and then placed in a controlled dark room at 20°C with 50% RH (Fig. 6a). The leaves were then weighed at 2, 4 and 6 h (W2, W4 and W6, respectively) and then placed in a dry oven at 60°C for 48 h and re-weighed (Wd). Stomatal closure was immediately observed under the microscope. RT was determined by using the following formula:
where T1 – T2 = time interval between two subsequent measurements (2 h).
The measured RT was then calculated as per projected leaf area and expressed in mg H2O cm−2 h−1.
Results
As expected, there was the tendency for a higher RT in old leaves than in young leaves with all the methods used.
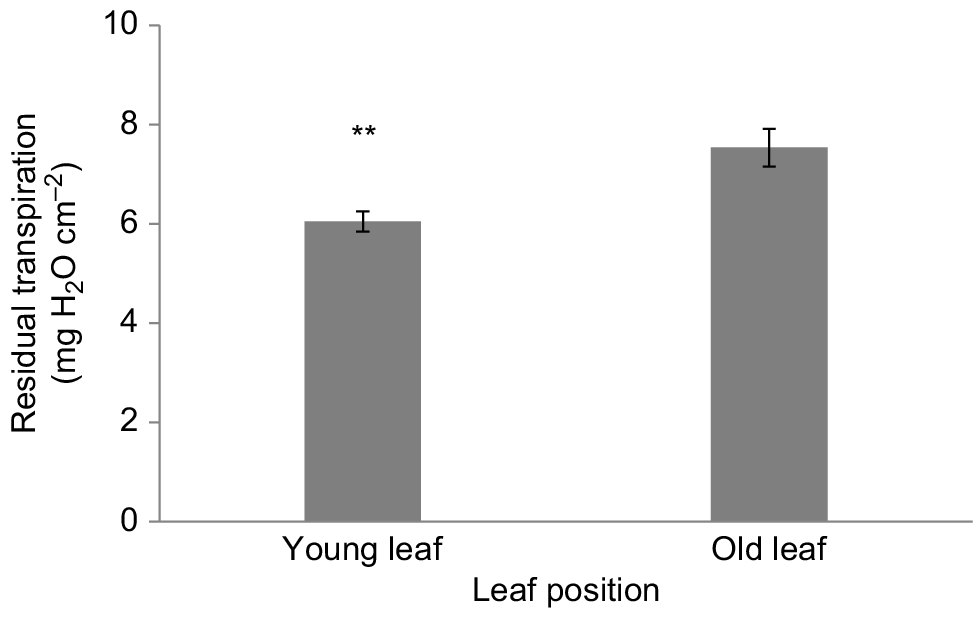
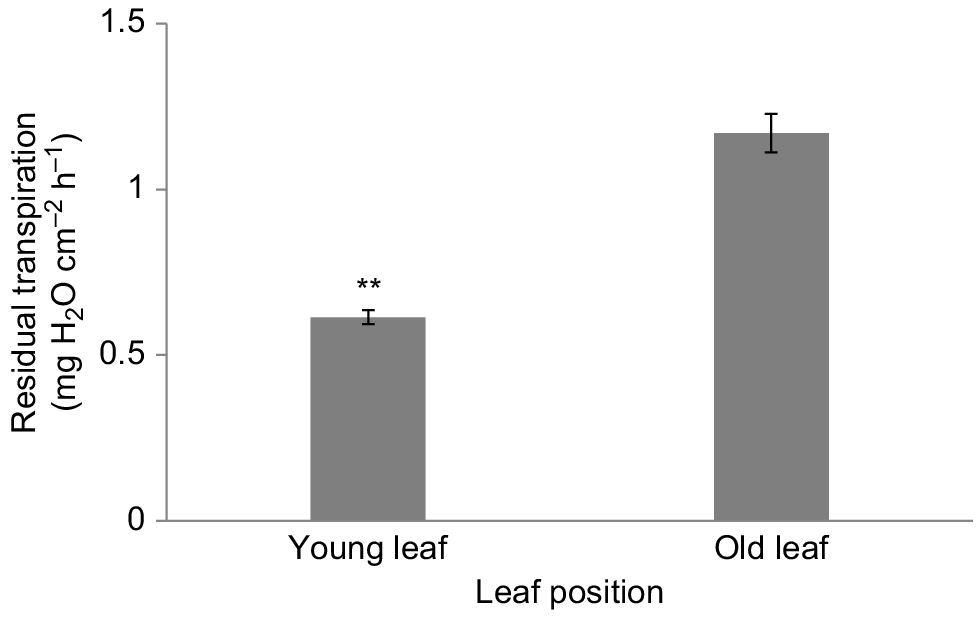
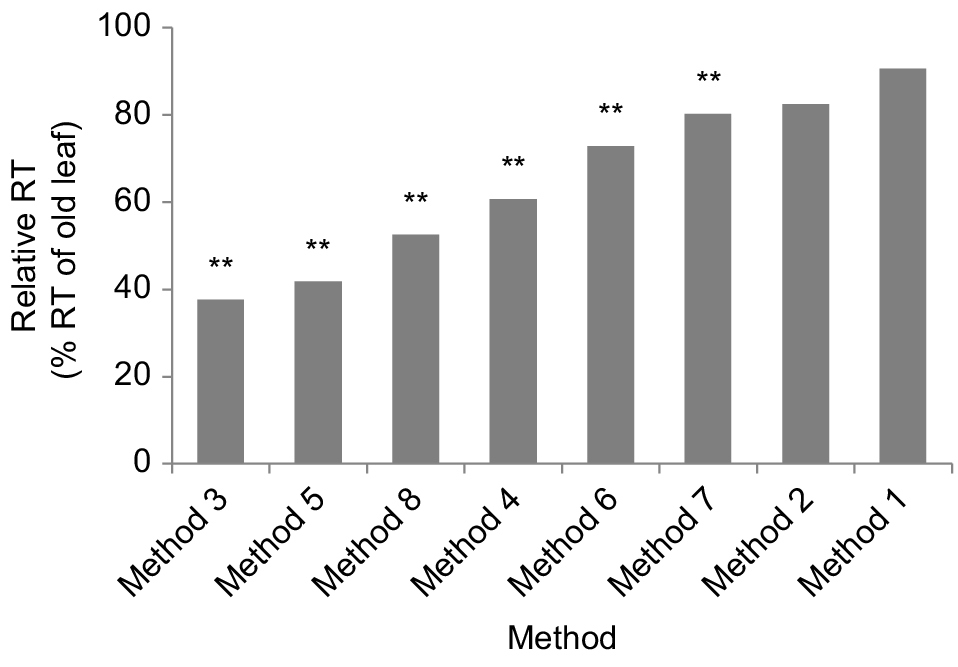
In Method 1, RT was estimated by the water retention curve, and the values did not differ significantly (P > 0.05) between old and young leaves. Old leaf (0.26 ± 0.03 RWC% min−1) transpired more than young leaf (0.23 ± 0.02 RWC% min−1) (Fig. 1b). Similarly, in Method 2, RT was measured by using a portable photosynthesis system (LI-6400XT) (Fig. 2a). Here, we found young and old leaves transpired 0.18 ± 0.03 and 0.22 ± 0.04 mmol m−2 s−1 water, respectively (Fig. 2c), but the difference of the amount of water loss wasn’t significant (P > 0.05) between the two leaf positions. In Methods 3 to 8, RT was significantly (P < 0.01) different between young and old leaves. In Method 3, old leaf showed 160% higher RT compared with young leaf (0.13 ± 0.01 and 0.05 ± 0.00 mg H2O g−1 DW h−1, respectively) (Fig. 3b). In Method 4, old leaf showed 65% higher RT compared with young leaf (6.22 ± 0.56 and 3.78 ± 0.75 mg H2O m−2 h−1, respectively) (Fig. 4b), whereas in Method 5, the old leaf showed 140% higher RT compared with young leaf (4.63 ± 0.48 and 1.93 ± 0.09 mg H2O m−2 h−1, respectively) (Fig. 5b). In Method 6, old leaf showed 60% higher RT compared with young leaf (0.68 ± 0.02 and 0.47 ± 0.01 mg H2O cm−2 h−1, respectively) (Fig. 6b). In Method 7, old leaf showed 25% higher RT compared with young leaf (7.54 ± 0.38 and 6.04 ± 0.20 mg H2O cm−2, respectively) (Fig. 7). In Method 8, old leaf showed 90% higher RT compared with young leaf (1.17 ± 0.05 and 0.61 ± 0.02 mg H2O cm−2 h−1, respectively) (Fig. 8). So, as one can see, the difference in the relative rate of RT between old and young leaves showed a great extent of variability among the different methods, ranging (in old leaves) from 38% for Method 3 (the greatest difference) followed by Method 5 (42%) to 91% for Method 1 (the lowest difference) followed by Method 2 (83%) (Fig. 9).
Measurement of RT of barley at two different leaf positions grown under control conditions by ‘one time-point water loss’ method (Method 7). Data are presented as mean ± s.e. (n = 5) and columns marked with asterisks indicate significant differences for a two-tailed independent t-test at P < 0.01 level.
Measurement of RT of barley at two different leaf positions grown under control conditions by ‘three time-points water loss’ method (Method 8). Data are presented as mean ± s.e. (n = 5) and columns marked with asterisks indicate significant differences for a two-tailed independent t-test at P < 0.01 level.
Discussion
Plant cuticle consists of a cutin polyester matrix and intracuticular and epicuticular waxes. As a major component of the cuticle, cuticular wax is the outer surface hydrophobic layer, almost solely serving as a barrier against the diffusion of non-stomatal water loss through the cuticle. Cuticular waxes consist of an organic mixture of hydrophobic very long-chain fatty acids and their derivatives including primary and secondary alcohols, alkanes, alkenes, wax esters and aldehydes (Jetter and Riederer 2006). Our previous results demonstrated that barley young leaf contained a relatively higher amount of total cuticular wax (Hasanuzzaman et al. 2018) and RT was negatively correlated with the total amount of cuticular wax and especially primary alcohols. Thus, one would expect that the rate of RT will be higher in old leaves compared with younger ones. Indeed, this was the case observed by most methods (Figs 3–9).
In Method 1, the excised leaves were allowed to rehydrate overnight and then the saturated leaves were exposed to light to induce the stomata to open. RT was measured from the slope of the water retention curve (Quisenberry et al. 1982; Xu et al. 1995; Darwish and Fahmy 1997; Santesteban et al. 2009). This method is not robust and not suitable for large-scale screening of plant genotypes to measure the RT. The critical aspect of this method of evaluating leaf drying curves, is to determine at which time point the stomata are maximally closed, as RT can only be determined after this time point. During the dehydration process, stomata close progressively and a constant value of water loss with maximum stomatal closure is needed. This calls for a need to obtain complete leaf drying curves; this is a highly labour-intensive and time-consuming process. The major limitation of this method is the need for multi-step simultaneous leaf pre-treatments. Another potential error arising from the measurement of RT from the leaf drying curves is that it doesn’t account for the changes in the driving force of water diffusing from the leaf to the atmosphere. Similarly, the transpiration data presented in Fig. 1b also did not differ significantly (P > 0.05) between old and young leaves; this may be attributed to the limitations in the multi-step pre-treatment procedure: (1) leaves were fully rehydrated to equilibrium before the experiment and (2) leaves were exposed to light to reopen the stomata (Table 1).
| Methods | Principle used | Equipment required | Sensitivity (in terms of RRT index) | Requirement of training | Cost involvement | Labour and time requirement | Suitability for large-scale screening | Major advantage/disadvantages | |
|---|---|---|---|---|---|---|---|---|---|
| Method 1 | Water retention curve | Controlled growth chamber, Petri dish, electronic balance, silicone grease | Very low (0.094) | Yes | High | Yes | No | Stomata may not always be tightly closed, so RT may include small fraction of transpiration from incompletely closed stomata | |
| Method 2 | Instrument direct measurement of transpiration rate | Infrared Gas Analyser (IRGA) with narrow-leaf chamber | Very low (0.176) | Yes | High | Yes | No | Non-destructive method. As uncontrolled water loss occurs here the method lacks precision and its accuracy is low | |
| Method 3 | Rate of water loss by dry weight basis | Silicone grease, weighing tray, electronic balance, drying oven | Very high (0.624) | No | Low | Yes | No | Easy, sensitive and accurate method; can be used for detailed studies taking lesser numbers of genotypes. | |
| Method 4 | Rate of water loss by leaf area basis | Silicone grease, electronic balance, drying, oven, weighing tray, leaf scanner | Moderate (0.393) | No | Moderate | Yes | No | Proper care should be taken as leaf area may change during dehydration | |
| Method 5 | Leaf drying curve | Silicone grease, Petri dish, blotting paper, electronic balance, leaf scanner, controlled room | Very high (0.582) | Yes | High | Yes | No | Needs attention for submersion and during leaf drying process | |
| Method 6 | One time-point water loss method | Silicone grease, electronic balance, drying oven | Low (0.271) | No | Low | No | Yes | Does not account stomatal transpiration due to closure of stomata by quick initial water loss under dark conditions | |
| Method 7 | Two time-points water loss method | Silicone grease, electronic balance, drying oven | Low (0.198) | No | Low | No | Yes | Does not account stomatal transpiration due to closure of stomata by quick initial water loss under dark conditions | |
| Method 8 | Three time-points water loss method | Silicone grease, electronic balance, drying oven | High (0.475) | No | Low | No | Yes | Does not account stomatal transpiration due to closure of stomata by quick initial water loss under dark conditions |
The relative residual transpiration (RRT) index was calculated as . The higher the RRT index values, the higher the sensitivity of the method.
In Method 2, RT was measured at night by using a portable photosynthesis system, LI-6400XT (Fig. 2a). The problem with this approach is that the difference between the reference and sample is very small during measurement. Thus, accuracy and precision become critical to distinguish between zero and non-zero rates. The RT is likely to be very small and may be beyond the limits of what an LI-6400XT can measure. The resolution of the method may be potentially improved by ensuring that: the machine is well zeroed; any leaks (including diffusional, due to the gradient inside the chamber to outside) are minimised and corrected for; and that it works at low airflow rates. One also needs to verify that the stomata are closed at night as many plant species have high rates of nocturnal transpiration. It was reported that, depending on VPD, plants may have a nocturnal transpiration rate of 5 to 30% of the rate of daytime transpirational water losses (Fricke 2019). If the stomata are closed, then what is measured is a combination of residual conductance and evaporation of any water from the leaf’s surface. Other limitations include: (1) IRGA is expensive and not suitable for a large number of samples; (2) a specific narrow chamber is required for barley leaf; and (3) it causes uncontrolled water loss (Table 1). In terms of the RRT index, this method is not sensitive (RRT index 0.176, very low) enough to measure RT (Table 1).
In Method 3 and 4, detached leaves were allowed to wilt under dark conditions for a certain time (e.g. 2 h) to ensure the stomata were closed. The loss of water was measured by weighing the leaves after the stomatal closure at constant time intervals. The RT was measured by the slope of the fitted linear regression lines (Fig. 3a) of water loss and time and calculated per unit dry biomass of leaves for Method 3 (Rawson and Clarke 1988; McCaig and Romagosa 1989; Clarke et al. 1991; González and Ayerbe 2010), while in Method 4, RT calculations were done per unit projected leaf area. These two techniques are easy to use and only differ by how the water loss is calculated (e.g. by dry weight and leaf area basis, respectively). RT estimated by the dry weight basis (Method 3) fails to account for the difference in the leaf thickness so can hardly be used for comparing leaves with different anatomical structure. However, this may not be an issue if one works with the same species and ensures that the difference in leaf thickness is not significant. In Method 4, the surface area of leaves may decrease over time, and the shrinkage of the leaf surface area may influence the RT measurement. To overcome the shrinkage of leaf area during the measurement, the excised leaves were fully hydrated first and then allowed to wilt under dark conditions at optimum environmental conditions in Method 5. This technique is easy but more time-consuming than the other methods and care should be taken that drying conditions are not so severe that rapid water loss occurs. The sensitivity (in terms of RRT index) of Method 3 (RRT 0.624) and Method 5 (RRT 0.582) are comparatively higher than other methods, whereas Method 4 is moderate (Table 1). However, all these three methods are time and labour intensive and not suitable for a large-scale screening of genotypes. In Methods 6, 7, and 8, the detached leaves were kept in the dark for closure of stomata under ambient room conditions and weighed under dark conditions at different time intervals to measure the residual water loss (Clarke and McCaig 1982; Golestani Araghi and Assad 1998; Petcu et al. 2009). Depending on the number of time intervals, Methods 6, 7 and 8 were termed as two time-points, one time-point and three time-points water loss, respectively. As expected, RT varied significantly (P < 0.01) for all these ‘time-point water loss’ methods. It has been assumed that maximum stomata closure has occurred after a certain period of dehydration time (Zhang et al. 2020). Thus, minimum stomatal conductance may not contribute to RT here. These three ‘time-point water loss’ methods are the most precise to measure RT due to the maximum closure of stomata under dark conditions. All these ‘time-points water loss’ methods are cost effective, not overly time- and labour-consuming and require no specific training. Large-scale assessments and genetic screening may be possible to estimate RT under water stress conditions using these ‘time-point water loss’ methods. Compared to other methods of measuring the RT, the ‘time-point water loss’ methods have four distinct advantages: (1) intact excised leaves can be directly used for RT measurement, and the obtained results are more relevant to leaf transpiration in planta; (2) these methods are less labour-intensive and time-consuming; (3) these methods can obtain RT rates from both abaxial and adaxial leaf surfaces at the same time; and (4) contributions by ST are minimised due to closure of stomata by quick initial water loss under dark conditions. Of these three ‘time-point water loss’ methods, Methods 6 and 7 are less sensitive compared to Method 8 (in terms of RRT index; Table 1).
Conclusion
Plant breeders need a reproducible, simple, and rapid screening protocol for quantifying residual transpiration to develop stress tolerance genotypes that can transpire less water via the cuticle of the leaf surface and conserve more water for higher water use efficiency under stress. In the present study, we examined the suitability of eight different methods for quantifying the rate of residual transpiration in barley. Methods 1 and 2 were not able to significantly differentiate the residual transpiration between young and old leaves and were, therefore, ruled out. The other methods showed a significant difference in RT between leaves of two different positions (young and old) but differed in amount of time/labour. Based on the cost–benefit analysis and comparison of sensitivity of different methods, it was found that Method 8 (the ‘three time-points water loss’ method) could be recommended as the most reliable and suitable for large-scale screening of plant genotypes in crop improvement programmes. Method 3 (based on quantification of water loss on a dry weight basis) was found to be the most sensitive and accurate, but not suitable for high throughput screening and hence is only recommended for detailed studies dealing with lesser numbers of genotypes.
Conflicts of interest
Sergey Shabala is the Editor-in-Chief of Functional Plant Biology. To mitigate this potential conflict of interest they were blinded from the review process. The authors declare no other competing interests.
Declaration of funding
This work was supported by the Grains Research and Development Corporation (GRDC) grant UT00027 to Sergey Shabala.
Acknowledgements
The authors thank Dr Alieta Eyles for her assistance to use IRGA and Dr Lana Shabala for her help with setting up the experiment and its logistic support. They also thank Dr Tim J. Brodribb for his valuable suggestions and proof-reading the article.
References
Boyer JS (2015) Turgor and the transport of CO2 and water across the cuticle (epidermis) of leaves. Journal of Experimental Botany 66, 2625-2633.
| Crossref | Google Scholar | PubMed |
Boyer JS, Wong SC, Farquhar GD (1997) CO2 and water vapor exchange across leaf cuticle (epidermis) at various water potentials. Plant Physiology 114, 185-191.
| Crossref | Google Scholar | PubMed |
Burghardt M, Riederer M (2003) Ecophysiological relevance of cuticular transpiration of deciduous and evergreen plants in relation to stomatal closure and leaf water potential. Journal of Experimental Botany 54, 1941-1949.
| Crossref | Google Scholar | PubMed |
Cape JN, Percy KE (1996) The interpretation of leaf-drying curves. Plant, Cell & Environment 19, 356-361.
| Crossref | Google Scholar |
Clarke JM, McCaig TN (1982) Excised-leaf water retention capability as an indicator of drought resistance of Triticum genotypes. Canadian Journal of Plant Science 62, 571-578.
| Crossref | Google Scholar |
Clarke JM, Richards RA, Condon AG (1991) Effect of drought stress on residual transpiration and its relationship with water use of wheat. Canadian Journal of Plant Science 71, 695-702.
| Crossref | Google Scholar |
Darwish DS, Fahmy GM (1997) Transpiration decline curves and stomatal characteristics of faba bean genotypes. Biologia Plantarum 39, 243-249.
| Crossref | Google Scholar |
David M (2010) Water loss from excised leaves in a collection of Triticum aestivum and Triticum durum cultivars. Romanian Agricultural Research 27, 27-34.
| Google Scholar |
Fricke W (2019) Night-time transpiration – favouring growth? Trends in Plant Science 24, 311-317.
| Crossref | Google Scholar | PubMed |
Golestani Araghi S, Assad M (1998) Evaluation of four screening techniques for drought resistance and their relationship to yield reduction ratio in wheat. Euphytica 103, 293-299.
| Crossref | Google Scholar |
González A, Ayerbe L (2010) Effect of terminal water stress on leaf epicuticular wax load, residual transpiration and grain yield in barley. Euphytica 172, 341-349.
| Crossref | Google Scholar |
Hasanuzzaman M, Shabala L, Zhou M, Brodribb TJ, Corkrey R, Shabala S (2018) Factors determining stomatal and non-stomatal (residual) transpiration and their contribution towards salinity tolerance in contrasting barley genotypes. Environmental and Experimental Botany 153, 10-20.
| Crossref | Google Scholar |
Hoad SP, Grace J, Jeffree CE (1996) A leaf disc method for measuring cuticular conductance. Journal of Experimental Botany 47, 431-437.
| Crossref | Google Scholar |
Jetter R, Riederer M (2016) Localization of the transpiration barrier in the epi- and intracuticular waxes of eight plant species: water transport resistances are associated with fatty acyl rather than alicyclic components. Plant Physiology 170, 921-934.
| Crossref | Google Scholar | PubMed |
Jordan GJ, Brodribb TJ (2007) Incontinence in aging leaves: deteriorating water relations with leaf age in Agastachys odorata (Proteaceae), a shrub with very long-lived leaves. Functional Plant Biology 34(10), 918-924.
| Google Scholar |
Karbulková J, Schreiber L, Macek P, Šantrůček J (2008) Differences between water permeability of astomatous and stomatous cuticular membranes: effects of air humidity in two species of contrasting drought-resistance strategy. Journal of Experimental Botany 59, 3987-3995.
| Crossref | Google Scholar | PubMed |
Kerstiens G (1996) Cuticular water permeability and its physiological significance. Journal of Experimental Botany 47, 1813-1832.
| Crossref | Google Scholar |
McAdam SA, Brodribb TJ (2014) Separating active and passive influences on stomatal control of transpiration. Plant Physiology 164, 1578-1586.
| Crossref | Google Scholar | PubMed |
McCaig T, Romagosa I (1989) Measurement and use of excised-leaf water status in wheat. Crop Science 29, 1140-1145.
| Crossref | Google Scholar |
Petcu E (2005) The effect of water stress on cuticular transpiration and relationships with winter wheat yield. Romanian Agricultural Research 22, 15-19.
| Google Scholar |
Petcu E, Schitea M, Cîrstea VE (2009) The effect of water stress on cuticular transpiration and its association with alfalfa yield. Romanian Agricultural Research 26, 53-56.
| Google Scholar |
Quisenberry JE, Roark B, McMichael BL (1982) Use of transpiration decline curves to identify drought-tolerant cotton germplasm. Crop Science 22, 918-922.
| Crossref | Google Scholar |
Rawson HM, Clarke JM (1988) Nocturnal transpiration in wheat. Functional Plant Biology 15, 397-406.
| Crossref | Google Scholar |
Riederer M, Schreiber L (2001) Protecting against water loss: analysis of the barrier properties of plant cuticles. Journal of Experimental Botany 52, 2023-2032.
| Crossref | Google Scholar | PubMed |
Santesteban LG, Miranda C, Royo JB (2009) Effect of water deficit and rewatering on leaf gas exchange and transpiration decline of excised leaves of four grapevine (Vitis vinifera L.) cultivars. Scientia Horticulturae 121, 434-439.
| Crossref | Google Scholar |
Schreiber L (2001) Effect of temperature on cuticular transpiration of isolated cuticular membranes and leaf discs. Journal of Experimental Botany 52, 1893-1900.
| Crossref | Google Scholar | PubMed |
Schreiber L, Riederer M (1996) Ecophysiology of cuticular transpiration: comparative investigation of cuticular water permeability of plant species from different habitats. Oecologia 107, 426-432.
| Crossref | Google Scholar | PubMed |
Schönherr J, Lendzian K (1981) A simple and inexpensive method of measuring water permeability of isolated plant cuticular membranes. Zeitschrift für Pflanzenphysiologie 102, 321-327.
| Crossref | Google Scholar |
Schönherr J (1982) Resistance of plant surfaces to water loss: transport properties of cutin, suberin and associated lipids. In ‘Physiological Plant Ecology II. Encyclopedia of Plant Physiology (New Series)’. (Eds OL Lange, PS Nobel, CB Osmond, H Ziegler) pp. 153–179. (Springer: Berlin, Heidelberg, Germany)
Xu HL, Gauthier L, Gosselin A (1995) Stomatal and cuticular transpiration of greenhouse tomato plants in response to high solution electrical conductivity and low soil water content. Journal of the American Society for Horticultural Science 120, 417-422.
| Crossref | Google Scholar |
Zhang Y, Chen X, Du Z, Zhang W, Devkota AR, Chen Z, Chen C, Sun W, Chen M (2020) A proposed method for simultaneous measurement of cuticular transpiration from different leaf surfaces in Camellia sinensis. Frontiers in Plant Science 11, 420.
| Crossref | Google Scholar |